Abstract
Chlorogenic acid (CA) has strong oxidative resistance. The content of CA is high in Eucommia ulmoides leaves which are easily available and low cost. Therefore, in this work, using Eucommia ulmoides leaves enzymatic hydrolysate (EEH) as the main material, the fermentation conditions of Eucommia ulmoides leaves vinegar (EV) were studied to increase the antioxidant activity of the vinegar. Box-Behnken design indicated the following optimal fermentation conditions: EEH 48%, acetic acid bacteria solution 10%, ethanol addition 6%. Under above conditions, the acetic acid content and CA content of EV was 41.5±2.2 mg/mL and 1.1±0.17 mg/mL, respectively. EV exhibited the higher antioxidant activity, with IC50 values of 2.62 µg/ mL, 27.21 µg/mL and 1.72 mg/mL for DPPH, hydroxyl radical scavenging activity and reducing power, respectively. The addition of Eucommia ulmoides leaves increased the antioxidant activity of vinegar.
Introduction
In China, vinegar is traditionally produced by cereal for more than 3000 years, and different regions of the country possess their own kinds of vinegars. Among them, Zhenjiang aromatic vinegar (ZAV) is extraordinary famous of their traditional vinegar (Wu et al., 2012). Vinegar is rich in organic acids, amino acids, mineral substance, and also contains phenolic compounds. Phenolics play a critical role in keeping health-promoting. Vinegar has an antioxidant effect (Kawano et al., 2010; Yusoff et al., 2015). Different kinds of vinegars have different oxidation resistance because the active ingredients in them are different (Sugiyama et al., 2003; Kim et al., 2012). In the United States, Japan, and some European countries, more and more attention was paid to the health benefits of vinegar, and different degrees of human and financial resources were invested to develop the health vinegar products (Horiuchi et al., 1999).
The study of the main composition and function of plant has been a research hotspot (Wang et al., 2017; Ge et al., 2017). Eucommia ulmoides is a very valuable medicine in china. In the tradition of China, the bark of Eucommia ulmoides is used as medicine. It has many functions, such as antioxidant, anti-inflammatory, anti-anaphylaxis and anti-microbial activity (Hussain et al., 2016; Luo et al., 2010). However, the yield of bark is very low, and the trees were also hurt when the bark medicine was taken. So, it is imperative for looking for the substitutes. Recently, it was found that there were some similar active ingredients as which as the barks in Eucommia ulmoides leaves except some individual chemicals. At the same time, it was found that chlorogenic acid (CA) content in leaves (1%∼5.5% in dried-leaves) was higher than that in barks. Studies also have proved that CA has strong oxidative resistance, bacteriological action, and inhibiting different free radicals (Hosoo et al., 2015; Chen et al., 2017). So, the application of functional components of Eucommia ulmoides leaves in foods has gained more and more interests. Supplement of Eucommia ulmoides leaves enzymatic hydrolysate (EEH) to vinegar may produce a novel beverage that provides medical or health benefits (Morris, 2003). However, there was no report about Eucommia ulmoides leaves vinegar (EV), especially adding EEH to vinegar.
The optimum process for the efficient release of chlorogenic acid from Eucommia ulmoides leaves has been reported (Jia et al., 2013). Therefore, the objective of this work is to study functional vinegar (EV) by using fementative substrate (EEH) which is low cost and easily available. In the present study, at first, response surface methodology (RSM) was employed to optimize acetic acid fermentation process (EEH percentage, addition of acetic acid bacteria solution and ethanol concentration) in order to obtain the maximal acidity of vinegar and to improve the antioxidant ability of the vinegar. Then, the antioxidant activity of EV was determined to further confirm the feasibility of acetic acid fermentation process and the antioxidative property of EV. The study provides fundamental support for the industrial production and application of vinegar.
Material and Methods
Materials and Reagents Acetic acid bacterium strain AS.141 was obtained from the Institute of Microorganisms of Chinese Academy of Sciences. Eucommia ulmoides leaves were collected in autumn from Hanzhong City, Shanxi Provence, China. Cellulase (10,000 U/g) was purchased from Beijing Oboxing Company. Chlorogenic acid standard product, α,α-diphenyl-b-picrylhydrazyl (DPPH), dichloroisocyanuric acid (TCA), ferrous sulfate, hydrogen peroxide, sodium dihydrogen phosphate, disodium phosphate, CA standard products, glacial acetic acid, acetonitrile, anhydrous ethanol are of chromatographic purity, and purchased from Shanghai Ronghe Medical Science and Technology Company limited.
Liquid cultivation of acetic acid bacterium strain AS.141 Acetic acid bacteria which came from solid medium was inoculated into 200 mL of liquid acetic acid medium and was cultivated at 200 r/min, 32 °C for 24 h. Then, the acetic acid bacteria concentration was about 1×10⁸ cfu/mL.
Acetic acid fermentation process of Eucommia ulmoides leaves According to the report (Jia et al., 2013), Eucommia ulmoides leaves were enzymatic hydrolysed to obtain EEH. Then, EEH was mixed with water and sterilized at 121 °C for 30 min. After cooling, ethanol and acetic acid bacteria solution were added into the sterilized solution. After that, it was fermented at 200 r/min, 32 °Cfor 5 d. Finally the Eucommia ulmoides leaves vinegar was obtained after collecting and treating the fermentation broth.
The optimization of acetic acid fermentation process of Eucommia ulmoides leaves
Effects of EEH percentage, addition of acetic acid bacteria solution and ethanol concentration on the acidity of vinegar In order to determine the proper scope of EEH percentage, the addition of acetic acid bacteria solution and ethanol concentration for acetic acid production, single factor experiments were tested as follows: Various ratio of EEH:water from 10:0 to 0:10 (v/v), the addition of acetic acid bacteria solution at a range of percentage from 6% to 16%, ethanol at different concentrations ranging from 4% to 14%. The desirable concentration scope of EEH percentage, the addition of acetic acid bacteria solution and ethanol concentration resulted in higher acidity of vinegar was used to optimize the acidity of vinegar using response surface methodology.
Box-Behnken experimental design The optimal range of EEH percentage, the addition of acetic acid bacteria solution, ethanol concentration were studied in independent test. According to previous reports (Zhang et al., 2011; Nie et al., 2010) and the results of single factor test, the coded independent variables used in the Response Surface Methodology design were listed in Table 1. In this table, the three factors chosen for this study, EEH percentage, addition of acetic acid bacteria and ethanol concentration, were designated as X1, X2 and X3, respectively. Each factor was prescribed into three levels, coded 1, 0, −1 for high, intermediate and low value, respectively. Then, according to a blocked Box–Behnken design with the three variables and three levels for each variable, the acidity of vinegar (Y) was taken as the response of the design experiments. A total of 17 experimental runs were carried out to determine optimum levels of three factors by the Design Expert 8.0 statistical software. A multiple regression analysis of the data was carried out for obtaining an empirical model, which related the measured responses to the independent variables. Data were fitted to second-order polynomial equation 1 (Eq.1) for each dependent Y variable.
Table 1.
Box-Behnken design and the experimental acidity of vinegar.
|
X1 |
X2 |
X3 |
|
| Runs |
EEH percentage (%) |
Addition of acetic acid bacteria solution (%) |
Ethanol concentration (%) |
Y The acidity of vinegara (mg/mL) |
| 1 |
50 (0) |
10 (0) |
6 (0) |
42.00±0.21 |
| 2 |
0 (−1) |
10 (0) |
4 (−1) |
17.20±0.32 |
| 3 |
50 (0) |
12 (1) |
4 (−1) |
28.00±0.42 |
| 4 |
50 (0) |
8 (−1) |
8 (1) |
17.21±0.26 |
| 5 |
0 (−1) |
8 (−1) |
6 (0) |
15.13±0.28 |
| 6 |
50 (0) |
12 (1) |
8 (1) |
17.09±0.34 |
| 7 |
0 (−1) |
10 (0) |
8 (1) |
13.51±0.22 |
| 8 |
50 (0) |
10 (0) |
6 (0) |
42.11±0.32 |
| 9 |
100 (1) |
10 (0) |
8 (1) |
11.08±0.18 |
| 10 |
100 (1) |
12 (1) |
6 (0) |
12.12±0.21 |
| 11 |
100 (1) |
8 (−1) |
6 (0) |
13.37±0.24 |
| 12 |
100 (1) |
10 (0) |
4 (−1) |
15.89±0.35 |
| 13 |
50 (0) |
10 (0) |
6 (0) |
42.12±0.32 |
| 14 |
0 (−1) |
12 (1) |
6 (0) |
17.43±0.29 |
| 15 |
50 (0) |
10 (0) |
6 (0) |
41.97±0.22 |
| 16 |
50 (0) |
10 (0) |
6 (0) |
41.95±0.19 |
| 17 |
50 (0) |
8 (−1) |
4 (−1) |
18.31±0.30 |
a Mean±standard (
n = 5). In this table, the three factors chosen for this study, EEH percentage, addition of acetic acid bacteria and ethanol concentration, were designated as
X1, X2 and
X3, respectively. Each factor was prescribed into three levels, coded 1, 0, .1 for high, intermediate and low value, respectively.
where Y: predicted response (the acidity of vinegar), X1, X2, X3 for independent variables EEH percentage, addition of acetic acid bacteria and ethanol concentration, respectively. β0: a constant, βi: linear coefficient, βii squared coefficient and βij: interaction coefficient.
Detection method of CA Sample pretreatment: The EEH and eucommia vinegar samples which were obtained according to the report (Jia et al., 2013), were centrifuged at 10,000 rpm for 1 minute, and then filtrated by 0.25 µm micro-porous membrane.
High performance liquid chromatography (HPLC) method: The instrument and experimental parameters are as follows: High performance liquid chromatograph (LC-20AT, SPD-M20A Detector, CalssVP chromatographic work station, Shimadzu, Japan); Dima C18 column (250 mm × 4.6 mm, 5 µm); acetonitrile/water/glacial acetic acid (12:88:1, v/v/v) as mobile phase; determine wavelength: 325 nm; Column temperature: 30 °C; Flow velocity: 1.0 mL/min; Sample volume: 5 µm; Retention times 11.57 min.
Detection Method of Vinegar Acidity According to the study of Chen (Chen et al., 2009), acid-base titration was used to detect the acidity of vinegar. After 0.1 mL of vinegar was diluted by 4.9 mL of distilled water, 1∼2 drops of phenolphthalein was added. Then, the sample was titrated with 0.05 mol/L NaOH until the solution turned red.
The determination of antioxidant activity
Sample preparation Because vitamin C (Vc) has strong antioxidant properties, and CA is the main active ingredient in the sample, so Vc and CA were chosen as experimental control samples in each sample of the parallel test. The content of CA, Vc, and CA of EEH was virtually identical. And the volume concentration of EEH, EV and ZAV were the same as well.
DPPH assay The antioxidant activity of Vc, CA, EEH, EV and ZAV were evaluated using a dilution series to obtain nine concentrations (1∼30 µg/mL). According to many reports (Maher et al. 2015; Endo et al. 2015), the method about DPPH radical-scavenging effect was minor modified. Specific operations were as follows: Diluted by 95% ethanol, the different concentrations samples was obtained. The 95% ethanol was control; 5 mL of 0.004% DPPH solution and 5 mL of the samples were added into a test tube. The tubes were put in the dark for 30 min at room temperature after concussed. Then, the absorbance was measured at 517 nm using spectrophotometer. The DPPH radical-scavenging activity (RSA) was calculated by the following equation:
where ‘Asample’ was the absorbance in the presence of samples and ‘Acontrol’ was the absorbance of control. Vc was used as the reference compound.
Hydroxyl radical-scavenging activity The antioxidant activity of Vc, CA, EEH, EV and ZAV was evaluated using a dilution series to obtain five concentrations (1–30 µg/mL). The hydroxyl radical-scavenging activity of the different concentration samples was measured by the fenton reagent method (Zhang et al., 2016) with some modification. One mL of samples, 1 mL of 6.0 mmoL/L salicylic acid ethanol solution and 1 mL of 6.0 mmoL/L ferric sulfate were mixed, distilled water was added to 4 mL. Then, 1 mL of 6.0 mmoL/L hydrogen dioxide solution was added and concussed for 2 min to start Fenton reaction. After incubating at 37 °C for 10 minutes, the absorbance Ai of the resulting mixture was measured at 510 nm using spectrophotometer. Vc was used as the reference compound. The distilled water was replaced with the salicylic acid ethanol solution to measure absorbance Aj. The samples were replaced by the distilled water instead of to measure absorbance A0. The scavenging activity on hydroxyl radicals (HRSA) was expressed as:
Reducing power assay The antioxidant activity of Vc, CA, EEH, EV and ZAV was evaluated using a dilution series to obtain five concentrations (0.02~0.3 mg/mL). The reducing power assay was performed according to previous reports (Ruiz-Ruiz et al., 2017; Zeng et al., 2011) with some modification. The different concentration samples (2 mL), sodium phosphate buffer (2 mL, 0.2 moL/L, pH6.6) and potassium ferricyanide (2 mL, 1%) were mixed and incubated at 50 °C for 25 min. Then, tri-chloroacetic acid (2 mL, 10%) was added and concussed for 2 minutes to stop the reaction. After centrifuging for 10 minutes at 3000 rpm, 5 mL of supernatant of the mixture was mixed with 5 mL of distilled water and 1 mL of Chloride-ferric chloride (1%). After last for 10 min at room temperature, absorbance of the resulting mixture was measured at 700 nm using spectrophotometer. The distilled water was a blank control. Vc was used as the reference compound.
Statistical analysis The data were processed by SPSS 17.0 and Design Expert 10. The figures were performed with Sigma Plot 10.0 and Originpro 9.1. Results were expressed as mean±standard daviation (n = 5) deviation through one-way analysis of variance (ANOVA) and the Duncan's test was used to test the difference between means.
Results and Disciussion
The CA concentration of EEH Using HPLC method, under optimal conditions, the CA content of EEH was 2.80±0.16 mg/mL. The results were consistent with previous researches in which the CA concentration of Eucommia ulmoides leaves was 1%∼5.5%.
Single factor experiment In this study, the different ratios of EEH and water were designed to investigate the effect of EEH percentage on acidity of vinegar. It could be seen from Fig. 1 that the acidity of vinegar increased with the decline of EEH percentage from 100% to 50%. However, the acidity of the vinegar which contained 0% EEH was lower than that contained 75% EEH. So, 0–100% EEH was chosen as the addition percentage of EEH in following test.
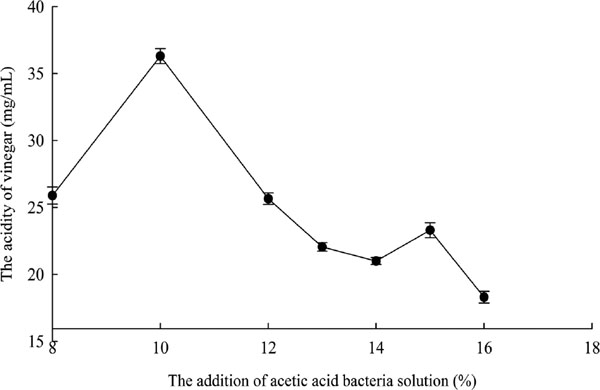
As shown in Fig.2, the acetic acid content increased continuously with the increase of the amount of acetic acid suspension. When acetic acid bacteria suspension is added to 10%, the acetic acid content reached the highest point. After that, it decreased. So, it could be concluded that 10% acetic acid bacteria solution was the optimal addition amount and 8∼12% was the suitable range in this single factor test.
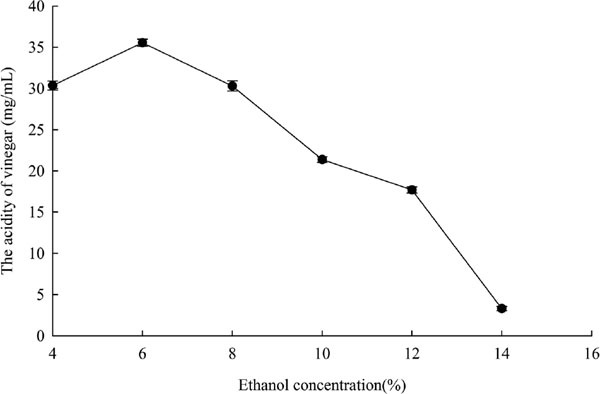
According to the report (Liu et al., 2007), 10% ethanol can inhibit most of microbial activity, more than 12% ethanol can inhibit the growth of acetic acid bacteria, and the maximum ethanol allowance for acetic acid bacteria is 15∼16%. Therefore, the range of ethanol concentration was designed to be from 4% to 14%. The results were shown in Fig. 3. The acidity of vinegar increased with the augment of ethanol concentration from 4 to 6%, and then the acidity of vinegar began to decline. The decline of acidity value was faster when ethanol concentration was higher than 6%. So, 4% ∼ 8% ethanol was designed in Box-Behnken design.
Analysis of Box-Behnken experiment for the acidity of vinegar According to the results of single-factor experiment, Box-Behnken experiment was designed, which was shown in Table 1. After the data in Table 1 was processed by Design Expert 10.0 software, the quadratic equation 4 (Eq.4) was obtained. The data were analyzed by Design Expert 10.0 software for statistical analysis of variance (ANOVA), and the results were expressed in Table 2. Through analysis of variance for extraction variables as linear, quadratic terms and interactions on response variables, it was concluded that the Model F-value of 161.18 implied the model was significant. Values of “Prob > F” less than 0.05 indicated model terms were significant. In this case, X1, X2, X3, X2X3, X12, X22, X32 were significant model terms. Values greater than 0.05 indicated the model terms were not significant. In addition, the high value of regression coefficient (R2=0.9951) came near the adjusted regression coefficient (Adj-R2=0.9890), so the model predictions fit satisfactorily with the experimental observations. These results suggested that the developed model could adequately represent the real relationship among the parameters chosen.
Table 2.
Analysis of variance of the primarily established quadric regression model.
| Source |
Sumof Squares |
df |
Mean Square |
F-Value |
Prob > F |
| Model |
25.15283 |
9 |
2.794758 |
161.1807 |
< 0.0001** |
| X1 |
0.143113 |
1 |
0.143113 |
8.253656 |
0.0239* |
| X2 |
0.14045 |
1 |
0.14045 |
8.100103 |
0.0248* |
| X3 |
0.525313 |
1 |
0.525313 |
30.29609 |
0.0009** |
| X1X2 |
0.0324 |
1 |
0.0324 |
1.868589 |
0.2139 |
| X1X2 |
0.003025 |
1 |
0.003025 |
0.174459 |
0.6887 |
| X2X3 |
0.2401 |
1 |
0.2401 |
13.84717 |
0.0074** |
| X12 |
11.62001 |
1 |
11.62001 |
670.1549 |
< 0.0001** |
| X22 |
4.991059 |
1 |
4.991059 |
287.8469 |
< 0.0001** |
| X32 |
5.060059 |
1 |
5.060059 |
291.8263 |
< 0.0001** |
| Residual |
0.121375 |
7 |
0.017339 |
|
|
| Lack of Fit |
0.121375 |
3 |
0.040458 |
|
|
| Pure Error |
0 |
4 |
0 |
|
|
| Corrected Total |
25.2742 |
16 |
|
|
|
* Significant at P < 0.05.,
** Significant at P < 0.01.
R2=0.9952 Adj-R2=0.9890
Analysis of the interaction among various factors Response surfaces plots were used to illustrate the interactive effects of EEH percentage, the addition of acetic acid bacteria solution and ethanol concentration for the acidity of vinegar. Response surface plots for the acidity of vinegar are presented in Figs. 4–6.


As shown in Fig. 4, the effect of EEH percentage and the addition of acetic acid bacteria solution on the acidity of vinegar in fermentation medium at 6% ethanol concentration. EEH percentage and the addition of acetic acid bacteria solution had very significant linear and quadratic effects on the acidity of vinegar (P < 0.01) (Table 2). However, EEH percentage and the addition of acetic acid bacteria solution did not interact significantly (P > 0.05) (Table 2). The acidity of vinegar increased with EEH percentage reached a certain value (approximately 50%), and then leveled off. At a fixed EEH percentage, the acidity of vinegar increased when the addition of acetic acid bacteria solution was extended from 8% to 10% but decreased when the addition of acetic acid bacteria solution was further elevated. When the percentage of acetic acid bacteria solution and EEH were approximately 10% and 50%, respectively, the acidity of vinegar reached up to the highest plot.
Fig. 5 shows the effect of EEH percentage and ethanol concentration on the acidity of vinegar in fermentation medium at 50% acetic acid bacteria solution addition. Ethanol concentration had very significant quadratic effect on the acidity of vinegar (P < 0.01). However, EEH percentage and ethanol concentration did not interact significantly (P > 0.05) (Table 2). The acidity of vinegar increased when ethanol concentration increased from 4% to 6%; thereafter it decreased when ethanol concentration was above 6%. At a fixed ethanol concentration, the acidity of vinegar increased with the increase of EEH percentage, but decreased when EEH percentage was raised from 50% to 100%, which also implied that the acidity of vinegar was significantly influenced by EEH percentage. When ethanol concentration and EEH percentage were optimal values respectively at the same time, the acidity of vinegar reached the highest plot.
The effect of the addition of acetic acid bacteria solution and ethanol concentration on the acidity of vinegar was also examined at EEH percentage of 50% (Fig. 6). It was found that not only the addition amount of acetic acid bacteria and ethanol concentration had a significant effect on acetic acid of vinegar, respectively, but also the interaction between these two factors on the acidity of vinegar was greatly remarkable (P < 0.01) (Table 2). The increase of ethanol concentration and the addition of acetic acid bacteria solution led to a gradual increase of the acidity of vinegar but it declined later. When the addition of acetic acid bacteria solution was about 10% and the optimal concentration of ethanol was about 6%, the acidity of vinegar reached its peak, indicating that the unfitting addition of acetic acid bacteria solution or inappropriate ethanol concentration would decrease the acidity of vinegar. The above phenomenon was because ethanol and acetic acid bacteria are really important substrates and fermentation agents in the process of acetic acid fermentation. Only when the contents of ethanol and acetic acid bacteria were in a proper proportion, more acetic acid can be fermented.
Optimization condition of acetic acid fermentation and Verification of the model According to quadratic equation (Eq.4), the partial derivative of X1, X2 and X3 was calculated when Y was designated as 0. The results were as the follow:
The conclusion of quadratic equation 5, 6 and 7 was X1=0.04278, X2=0.076612, X3=0.05398. So, the optimal conditions of the Eucommia ulmoides vinegar process were 47.86% EEH, 10.15% acetic acid bacteria solution, 6.11% ethanol, fermentation at 200 r/min, 32 °C for 5 d, the estimated value of acetic acid reached 41.9 mg/mL. In actual test, under the condition including 48% EEH, 10% acetic acid bacteria solution and 6% ethanol, the average experimental value was 41.5±2.2 mg/mL and this value was not significantly different (P > 0.05) from the predicted value of 41.9 mg/mL. Under above conditions, the CA content of the Eucommia ulmoides vinegar was 1.1±0.17 mg/mL. These data proved that the model designed in this study was valid.
Antioxidant activity of Eucommia ulmoides leaves vinegar DPPH assay As shown in Table 3, the IC50 values of Vc, CA, EEH, EV, V0 was 4.50±0.13 µL/mL, 4.69±0.09 µL/mL, 2.80±0.10 µL/mL, 2.62±0.06 µL/mL 13.40±0.13 µL/mL respectively through calculated by SPSS 17.0. Compared with other samples, the DPPH radical scavenging activity data revealed that EV was highest, and significantly higher than ZAV. So, the DPPH radical scavenging activity of EV was mainly came from EEH. It could be concluded that EEH addition increased the DPPH radical scavenging activity of vinegar.
Hydroxyl radicals assay EV exhibited the lower radical scavenging activity with an IC50 value that required a concentration of 27.21±0.77 µg/mL (see Table 3). Compared with control samples, EV had higher hydroxyl radical scavenging activity. The hydroxyl radical scavenging activity of EV was higher than ZAV, but closed to EEH. So, EEH addition increased the hydroxyl radical scavenging activity of vinegar.
Reducing power assay Reduced power was measured in methanolic extracts and its fractions by the transformation of Fe (III) to Fe (II).The reduced power is a significant indicator of antioxidant activity. Reducing power of all samples was higher (see Table 3). Comparable with other samples, the reducing power of EV was higher. But it was slightly higher than ZAV. So, the reducing power of EV was mainly came from vinegar, EEH addition slightly increased the reducing power of vinegar.
Conclusions
Under the optimal conditions, the CA content of EEH was highest as 2.80±0.16 mg/mL.
The fermentation conditions of EV was EEH percentage 48%, acetic acid bacteria solution 10%, ethanol concentration 6%, fermenting at 200 r/min, 32 °C for 5 days. Under these conditions, the average value of acetic acid content was 41.5±2.2 mg/mL which was agreed well with the estimated value (41.9 mg/mL), and the CA content was 1.1±0.17 mg/mL.
The antioxidant activity of different samples were tested and analyzed. The following conclusions could be obtained: the DPPH radical scavenging activity, hydroxyl radical scavenging activity and reducing power of EV were higher than ZAV. So, the addition of Eucommia ulmoides leaves increased the antioxidant activity of the vinegar, and EV had higher antioxidant activity.
Acknowledgments This study was carried out with the support of “China National spark project (2010GA600015)”
Abbreviations
CA
Chlorogenic acid
EEH
Eucommia ulmoides leaves enzymatic hydrolysate
EV
Eucommia ulmoides leaves vinegar
ZAV
Zhenjiang aromatic vinegar
References
- Chen, C.X. and Chen, F.S. (2009). Study on the conditions to brew rice vinegar with high content of γ-amino butyric acid by response surface methodology. Food Bioprod. Process., 87, 334-340.
- Chen, Y.P., Xu, Y.S., Cao, Y.Q., Fang, K., Xia, W.S., and Jiang, Q.X. (2017). Combined effect of microwave and steam cooking on phytochemical compounds and antioxidant activity of purple sweet potatoes. Food Sci. Technol. Research., 23, 193-201.
- Endo, Y., Aota, T., and Tsukui, T. (2015). Antioxidant activity of alginic acid in minced pork meat. Food Sci. Technol. Research., 21, 875-878.
- Ge, W.L., Suryoprabowo, S., Zheng, Q.K., and Kuang, H. (2017). Development of an immunochromatographic test strip for the detection of papaverine in pure ginger powder. Food Agr. Immunol., 28, 1304-1314.
- Horiuchi, J., Kanno, T., and Kobayashi, M. (1999). New vinegar production from onions. J. Biosci. Bioeng., 88, 107-109.
- Hosoo, S., Koyama, M., Kato, M., Hirata, T., Yamaguchi, Y., Yamasaki, H., Wada, A., Wada, K., Nishibe, S., and Nakamura K. (2015). The restorative effects of Eucommia ulmoides Oliver leaf extract on vascular function in spontaneously hypertensive rats. Molecules., 20, 21971-21981.
- Hussain, T., Tan, B., Liu, G., Oladele, O., Rahu, N., Tossou, M., and Yin Y. (2016). Health-promoting properties of Eucommia ulmoides: a review. EVid. Based. Compl. Alt., 12, 1-9.
- Jia, C.F., Zhang, B.L., Rong, K.X., and Hao, J.X. (2013). Study on process parameters of efficient release of chlorogenic acid from Eucommia ulmoides Oliv. Food Ind., 34, 57-60.
- kim, J.k., Baik, M.Y., Hahm, Y.T., and kim, B.Y. (2012). Development and optimization of a drink utilizing citrus (citrus unshiu) peel extract. J. Food Process Eng., 35, 557-571.
- Kawano, K., Morimura, S., Mori, E., Matsushita, H., Ohta, H., and Kida, K. (2010). Isolation and identification by cytoprotection assay of antioxidative compound contained in vinegar produced from sweet potato-shochu post-distillation slurry. Food Sci. Technol. Res., 16, 327-332.
- Liu, X.D., She, Y.H., and Zhang, H.Y. (2007). Study on the culture medium condition of acetobacter. Chem. Eng., 1, 17-19.
- Luo, L.F., Wu, W.H., Zhou, Y.J., Yan J., Yang, G.P., and Ouyang, D.S. (2010). Antihypertensive effect of Eucommia ulmoides Oliv. extracts in spontaneously hypertensive rats. J. Ethnopharmacol, 129, 238-243.
- Maher, M.A., Mohammed, I.S., and Khalid, A.I. (2015). Preservation methods impacted phenolic, flavonoid and carotenoid contents and antioxidant activities of carrots (Daucus carota L.). J. Food Process Pres., 39, 1618-1625.
- Morris, B. (2003). Bio-functional legumes with nutraceutical, pharmaceutical and industrial uses. Econ. Bot., 57, 254-261.
- Nie, S.P., Li, J.E., Yang, C., Qiu, Z.H., and Xie, M.Y. (2010). Optimization of supercritical fluid extraction of sssential oil from herba moslae by response surface methodology and its chemical composition analysis. Food Sci. Technol. Res., 16, 185-190.
- Ruiz-Ruiz, J.C., Matus-Basto, A.J., Acereto-Escoffié P., and Segura-Campos, M.R. (2017). Antioxidant and anti-inflammatory activities of phenolic compounds isolated from Melipona beecheii honey. Food Agr. Immunol., 1, 1-14.
- Sugiyama, A., Saitoh, M., Takahara, A., Satoh, Y., and Hashimoto, K. (2003). Aeute cardiovascular effects of a new beverage made of wine vinegar and grape juice, assessed using an in vivo rat. Nutr. Res., 23, 1291-1296.
- Wang, E.B., Jin, B.F., Li X., Liu, R.L., Xie, X.R., Guo, W.F., Zheng, H.X., and Zhao, Z.B. (2017). Comparative analysis between aerial parts and roots (Astragali Radix) of astragalus membranaceus by NMR-based metabolomics. Food Agr. Immunol., 28, 1126-114.
- Wu, J.J., Ma, Y.K., Zhang, F.F., and Chen, F.S. (2012). Biodiversity of yeasts, lactic acid bacteria and acetic acid bacteria in the fermentation of “Shanxi aged vinegar”, a traditional Chinese vinegar. Food Microbiol., 30, 289-297.
- Yusoff, N.A., Yam, M.F., Beh, H.K., Razak, K.N.A., Widyawati, T., Mahmud, R., Ahmad, M., and Asmawi, M.Z. (2015). Antidiabetic and antioxidant activities of Nypa fruticans Wurmb. vinegar sample from Malaysia. Asian. Pac. J. Trop. Med., 8, 589-597.
- Zeng, L.B., Zhang, Z.R., Luo, Z.H., and Zhu, J.X. (2011). Antioxidant activity and chemical constituents of essential oil and extracts of Rhizoma homalomenae. Food Chem., 125, 456-463.
- Zhang, M., Pan, L.J., Jiang, S.T., and Mo, Y.M. (2016). Protective effects of anthocyanins from purple sweet potato on acute carbon tetrachloride-inducedoxidative hepatotoxicity fibrosis in mice. Food Agr. Immunol., 27, 157-170.
- Zhang, Z.F., Lv, G.Y., Pan, H.J., Shi, L.G., and Fan, L.F. (2011). Optimization of the microwave-sssisted extraction process for polysaccharides in himematsutake (Agaricus blazei Murrill) and evaluation of their antioxidant activities. Food Sci. Technol. Res., 17, 461-470.


