Abstract
The physical properties of dough (PPD), instantaneous elasticity, regularity coefficient of viscosity, and relaxation time (τ0), of various white bread doughs without yeast addition were measured by the creep method based on a Maxwell-2-element model (Maxwell model). It was assumed that PPD do not change during fermentation and thus the stress of various doughs in the proofing process could be obtained using Euler's method. Simulation results revealed that dough with large elastic characteristics, a large τ0, and fermented quickly had a high stress peak during the expansion process and that the final stress (σend) also had a high value compared to other doughs. Meanwhile, dough characterized by a small τ0 and slow fermentation showed the opposite tendency. Additionally, the calculated σend was significantly correlated with the gas retention of dough and specific loaf volume (SLV). These results demonstrated that SLV of various white bread doughs could be estimated using PPD and fermentation speed.
Introduction
It is empirically known that bread-making qualities (BMQ), such as gas retention of dough (GRD) at the end of proofing and specific loaf volume (SLV), are closely related to the physical properties of dough (PPD). Previous reports also confirmed that GRD and SLV of dough and bread depend on rheological properties (Janssen et al., 1996; Kawai et al., 2006a; Kawai et al., 2006b; Rao et al., 2000; Takata et al., 2003; Takata et al., 2000; Yamauchi et al., 2003). Therefore, it is thought that the expansion behavior of dough during fermentation is related to rheological properties. Previous studies have analyzed the relationship between PPD immediately after preparation and BMQ. However, the behavior of PPD during fermentation was not analyzed. In addition, it is empirically known that BMQ are largely influenced by the fermentation speed of dough (with additional amounts of yeast) as well as the PPD. Thus, in order to clarify the influence of fermentation speed on BMQ, it is essential to analyze the behavior of PPD during the expansion process.
Bloksma (1957) studied the mechanism of dough expansion with an alveograph, which is used to measure dough expansion, using the Maxwell model and calculated the stress behavior during dough expansion by numerical analysis. He reported that the stress relaxation time was the most important factor for the expansion ability. Matsumoto (1981) also studied dough stress during the fermentation process theoretically, using the Maxwell model with a constant cross-section and nominal strain condition. This study showed that stress during dough expansion changes qualitatively depending on the initial stress. Although these reports explained the stress behavior in the expansion process to some extent, they were not applied to the actual bread making process.
The previous studies also did not examine the influence of the PPD and fermentation rate on the behavior of PPD during the expansion process. In addition, the correlation between the final stress of PPD in the expansion process and BMQ was not analyzed.
In this study, dough samples without yeast and with various PPD were prepared with the addition of various amounts of oxidizing and reducing reagents. PPD were expressed using the Maxwell model and coefficients of the physical properties of these various doughs were measured using the creep method. Subsequently, changes in dough stress during the proofing process were simulated using various expansion speeds and the initial PPD data by numerical analysis under the assumption that PPD would not change during the bread-making process. Based on the obtained results, the relationship between the simulation results and the actual GRD and SLV was analyzed in detail.
Materials and Methods
Analytical model of PPD The deformation model for the numerical analysis is shown in Fig. 1. It was assumed that the dough is an aggregate of many cylindrically shaped doughs (left side Fig. 1) and that the dough is stretched longitudinally by gas inflation at a constant expanding speed of C (m/s) with time t (s), but that the total volume is kept constant during the expansion. The initial diameter and height are defined as D0 (m) and a0 (m), respectively (right side Fig. 1). From the measurements of gassing power (GP) of actual doughs, the gassing power of carbon dioxide generated by the yeast is almost constant. Then, assuming that the gas hardly leaks out of the doughs, the expansion rate of each dough was set as constant. As described later, the expansion rate (C (m/s)) of each dough was obtained from the GP of each dough and the average area of the bread pan.

By using the data of the actual dough strain rate of longitudinal direction, the strain rate of dough ( (t)(1/s)) at t (s) is defined as Eq. (1).
Here, a(t) is the height of the dough at t (s). From this equation, (t) is not constant, although the dough expansion speed is constant.
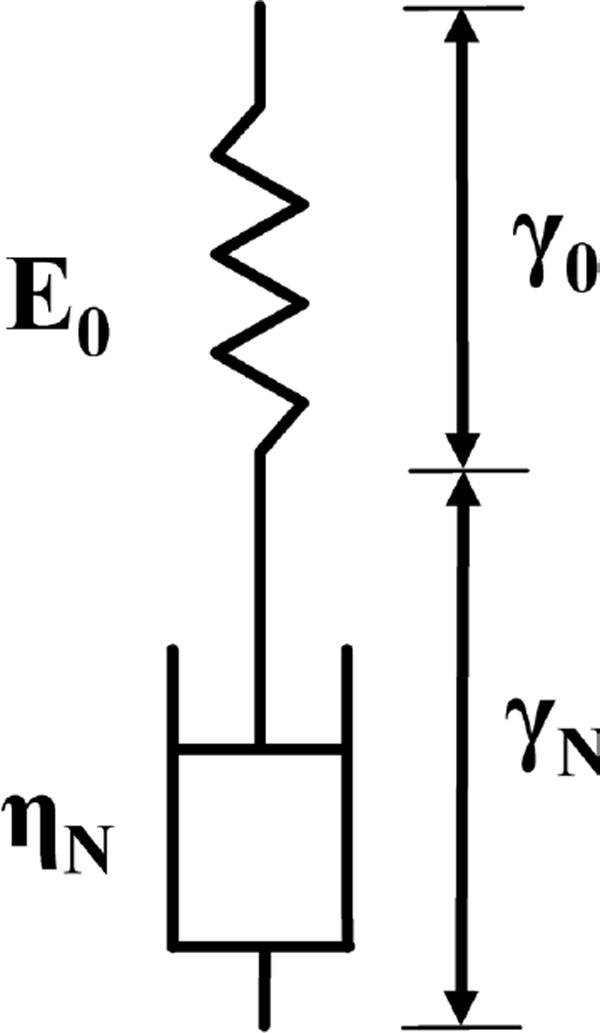
Next, the Maxwell model was used to represent the PPD as indicated in Fig. 2. In this figure, E0 (Pa), ηN (Pa·s), γ0 (−), and γN (−) are instantaneous elasticity, regularity coefficient of viscosity, strain of instantaneous elasticity region, and strain of regularity coefficient of viscosity region, respectively. In addition, the relaxation time (τ0 (s)) is defined as τ0 = ηN/E0 The strain rate of dough ((t)) is represented using the Maxwell model as Eq. (2).
Here, σ(t) (Pa) is the stress of dough at t (s) during expansion. Eq. (3) is obtained by substituting the right side of Eq. (1) for the left side of Eq. (2) and arranging the equation. Eq. (3) was obtained to show the stress changes in the expansion process of dough.
Here, σ(0) (Pa) is the initial stress, which was set as 0 (Pa) in the numerical analysis of σ(t). The σ(t) of several doughs with various physical properties and expansion rates was simulated using Eq. (3) with Euler's method.
The main reasons for using the Maxwell model as the PPD model in this research are as follows. (1) Previous reports show that the behavior of the PPD to changes during the expansion process can be represented by this model. (2) This model is simple and it is easy to numerically calculate the stress changes of dough during the expansion process. (3) In the expansion process of dough at a very slow strain rate, it is reasonable that the retardation elasticity region, which is normally present in the rapid deformation of dough, is included in the instantaneous elasticity region.
Flour, oxidizing and reducing reagents Commercial strong flour, Camellia, purchased from the Nisshin Flour Milling Co., Ltd. (Tokyo, Japan) was used in this study. The protein and ash contents were 12.2 and 0.39% (w/w, 13.5% moisture base), respectively. These contents were measured according to the methods reported by Yamauchi et al. (2014). Special grade reagents, L (+) − ascorbic acid (ASA) and reduced glutathione (GSH), were purchased from FUJIFILM Wako Pure Chemical Corporation (Tokyo, Japan) and used as oxidizing and reducing reagents of dough, respectively.
Dough preparations and bread making tests The tests for bread-making were carried out using the no-time method and standard white bread formulation. The tests were partially modified from the method reported by Yamauchi et al. (2001). Namely, the proofing temperature in this study was changed from 38 to 30 °C. The proofing process was allowed to proceed until the top height of the dough expanded to a height of 1 cm from the top edge of the pan.
The optimal amounts of water for dough preparations and bread-making tests were determined using a Farinograph at 500 BU according to the AACC method (1991). In this study, the optimal water absorption was 66.0 for all dough preparations and bread making tests.
The four types of doughs having various physical properties were prepared by adding ASA 100 and 0 ppm, and GSH 50 and 100 ppm, respectively. In order to change the expansion speed of these doughs, the bread making tests were carried out by adding 6, 3, and 1.5% yeast, respectively. The doughs used for measuring PPD were prepared in the same way as those used in the bread-making tests, except that no yeast was added because when leaved doughs are used, PPD measurements are less accurate.
The GRD was evaluated by measuring the maximum expansion volume of 20 g of dough proofed at 30 °C and 85% relative humidity (RH) for the time in a cylinder under reduced pressure, following the steps outlined by Yamauchi et al. (2000).
The GP of 20 g of dough after bench time was measured at 30 °C for 5 hrs at 5 min intervals using a Fermograph II (ATTO Co., Ltd., Tokyo, Japan) as reported by Santiago et al. (2015). GP rates of each 100 g of dough used for the bread-making tests during the proofing process were calculated with the assumption that GP rates are constant. Using the GP data, the vertical expansion rates of various doughs in the proofing process were calculated by taking into consideration the volume of 100 g of dough after molding (as described later) and the average area of the pan for baking, assuming that the dough shape after molding is a rectangular parallelepiped.
The SLV of various breads cooled at room temperature for 1 h after baking was measured by the AACCI rapeseed-displacement method (2000). Individual slices from the breads were imaged using a copy machine to evaluate the size and crumb grain of each bread.
Measuring conditions of PPD The PPD measurements were taken using doughs just after mixing. The doughs were divided into 30 g pieces, rounded to a spherical shape, compressed to 1.5 cm thickness using a flat box, placed inside a polyethylene bag to prevent water evaporation, and then kept in an incubator at 30 °C for 60 min to ensure a flat surface and stress relaxation of the dough. The actual PPD of all samples were measured using the creep method with a Rheoner (Model RE33005, Yamaden Co., Ltd., Tokyo, Japan) as reported by Kawai et al. (2006a). The load with creep measurement is 499 (Pa). This value was determined as a condition that can accurately measure the physical properties values of various doughs within the range where the relation between the load and the strain is almost linear. Each coefficient of the Maxwell model was determined with the automatic analytical software of the Rheoner. Each τ0 was calculated using the PPD coefficients described in the above section.
Simulation of dough stress during the proofing process Simulations of the stress of various doughs during the proofing process were carried out using Eq. (3) and Euler's method. The data in Table 1 were used as the values of each coefficient of various PPD. The boundary and initial conditions for the simulations were σ(0) = 0, a0 = 1.4 cm, and variable C at 0 s depending on the amounts of added yeast, respectively. The calculating interval used in Euler's method was 20 s. The value of a0 was calculated using the volume (98.1 mL) of 100 g of dough just after molding and the average area (68.3 cm2) of the baking pan, assuming that the dough was a rectangular parallelepiped. The C values of the doughs were 1.906 to 1.945x10⁻⁵, 0.935 to 1.063x10⁻⁵, and 5.798 to 5.884x10⁻⁶ (m/s) at 6, 3, and 1.5% added yeast, respectively, which were determined using the GP data of the various doughs.
Table 1.
The physical properties of various bread doughs
1)
| Dough Samples |
E0(Pa X103) |
ηN(Pa·s X105) |
τ0(s X102) |
| Strong flour, ASA 100 ppm |
4.215±0.449a |
12.232±2.635a |
2.910±0.600a |
| Strong flour, ASA 0 ppm |
4.371±0.412a |
9.138±1.492b |
2.087±0.213b |
| Strong flour, GSH 50 ppm |
3.333±0.143b |
5.577±0.192c |
1.675±0.075c |
| Strong flour, GSH 100 ppm |
3.347±0.257b |
4.761 ±0.193c |
1.427±0.080c |
1) Data are shown in mean±SD (n=8∼10). The values followed by different letters within column are signifcantly different (
p < 0.05). The physical properties of doughs were measured using no yeast doughs. E
0: instantaneous elasticity, η
N: regularity coeffcient of viscosity, τ
0: relaxation time , ASA: L-ascorbic acid, GSH: reduced glutathione.
Statistical analysis All experimental data are shown as the mean or the mean±SD. Significant differences of the data in Table 1 were evaluated using analysis of variance at 5% significance and Tukey's multiple range test using Excel statistical software 2012. Correlation analyses between the various data were performed using Excel 2012.
Results and Discussion
Physical properties of doughs The typical creep curves of four kinds of dough with various amounts of ASA and GSH added are shown in Fig. 3. These results showed that as the amounts of ASA, an oxidizer, decreased and those of GSH, a reducing agent, increased, the strain when weighted to the dough and the permanent strain after weight removal increased. It is clear that the dough is obviously softened by adding no an oxidizing agent or a reducing agent. In particular, since the value of the permanent strain largely changed due to the difference of amounts of ASA and GSH added, it can be seen that the variation of the ηN value of the Maxwell model is large.

The physical properties of the four kinds of dough with various amounts of ASA and GSH added are shown in Table 1. These results showed that as the amounts of ASA, an oxidizer, decreased and those of GSH, a reducing agent, increased, the dough had low physical properties values (especially ηN and τ0), softened, and displayed low elastic properties. Values of ηN and τ0 significantly decreased when the amounts of ASA and GSH were reduced and added. E0 values also significantly decreased with the addition of GSH. Even for doughs with the same composition, it can be seen that the PPD changed depending on the difference in the amounts of oxidizer and reducing agents added.
Simulation results of dough stress The results of representative simulations of dough stress during proofing are shown in Figs. 4 and 5. These results show that all stress curves increased sharply at the initial stage of expansion and then eventually decreased. The reason for this is that since the height of doughs is low during the initial stage of the dough's constant speed expansion and the strain rate is high, the increase of stress occurs more rapidly than the relaxation of stress during the initial stage. On the other hand, it seems that the decrease in stress after the peak is caused by the following factors. Dough height becomes high with the fermentation period, which causes a decrease in the strain rate. As the result, the relaxation of dough stress progresses significantly and the decline of the stress becomes dominant.


As seen in Fig. 4 that the expansion rates of all doughs were nearly the same, the stress peak and the stress at the end of the proofing process (σend) showed lower values as the τ0 value of the dough decreases. This result showed that when the expansion rates of the doughs are nearly the same, the relaxation of stress in the more elastic dough with a large τ0 value does not proceed as much in the expansion process, and its peak value and σend become larger compared to the others. In addition, this result basically corresponded to that reported by Matsumoto et al. (1973). They reported that the internal pressure of the dough, which is correlated with the dough stress, during the expansion process rises with the addition of an oxidizing agent and decreases with the addition of a reducing agent, such as GSH.
As shown in Fig. 5 in which the physical properties of all doughs were the same and the expansion rates were different, the stress peak and σend showed higher values depending on the increase in expansion speed with the amount of added yeast. This result also shows that, in the case of doughs with the same physical properties, the strain rate of the doughs during the proofing process increased with an increase in the amount of added yeast, and that the stress relaxation of dough with a high strain rate, especially at the initial stage of expansion, hardly occurs and indicates a large peak value compared to the other doughs.
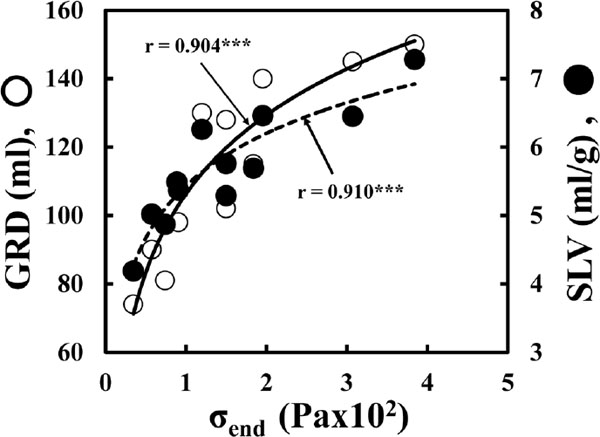
Relationship between σend, GRD, and SLV The relationship between σend, GRD, and SLV is shown in Fig. 6. Both values showed an increasing tendency as the σend increased. It was found that there was a significant correlation between σend and the logarithmic values of GRD and SLV (p < 0.001). These results showed that a high GRD and large SLV are related to a large σend, and that GRD and SLV can be estimated using the PPD and dough expansion rate. This study also shows that bread can attain a large SLV when the dough has a large τ0, high elastic properties, and expands quickly.
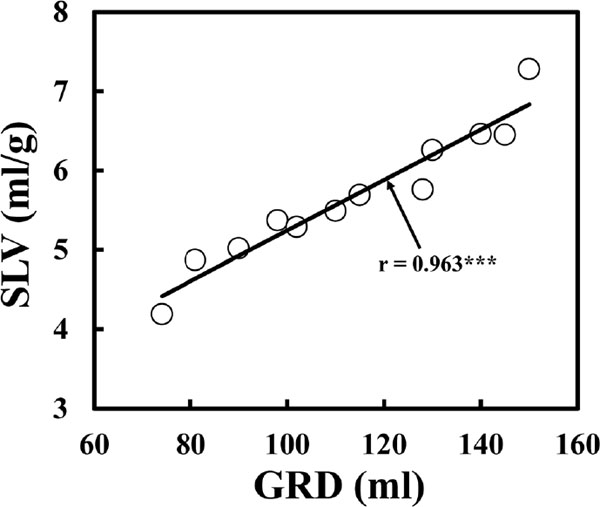
The relationship between GRD and SLV is shown in Fig. 7, obtained using all the data of Fig. 6. This result shows that there is a significantly high correlation between GRD and SLV (p < 0.001) in doughs and breads prepared using various physical properties and expansion rates doughs in the proofing process. In addition, it also shows that PPD and the expansion rate greatly influence GRD after proofing and the value of SLV, which changed in conjunction with GRD, as there is a high correlation between them. Therefore, it is suggested that the SLV of breads prepared under various conditions is almost definitely determined by the GRD, which is strongly influenced by the PPD and expansion rates of the dough.
Images of breads obtained from various doughs Images of breads obtained from the four types of doughs, containing three levels of added yeast, are shown in Fig. 8. The images show that the biggest bread is obtained from the dough with 100 ppm ASA and 6% added yeast, while the bread obtained from the dough with 100 ppm GSH and 1.5% added yeast is the smallest. These observations support the results of Fig. 6. Fig. 8 shows that the crumb grain of bread obtained from the dough with a high GSH level and little added yeast was rougher and non-uniform, and also contained many large bubbles. Matsumoto (1991; 1981) reported that when a soft dough with weak elastic properties expands due to yeast fermentation, the bubble membrane breaks and coalesces during the expansion process. The results shown in Fig. 8 basically agree with these previous reports.

BMQ of various doughs From the above experimental data using doughs of various physical properties and expansion speeds, it was observed that σend obtained in simulation was significantly correlated with GRD and SLV. This shows that, in order to obtain bread with a large SLV and good crumb grain, it is important to increase GRD in the proofing process so as to maintain a high dough stress and suppress the coalescence of gas bubbles in the dough. These factors are related to the PPD and the dough expansion speed during proofing. In this study, the raw materials and compositions for the preparation of various doughs were strictly controlled and the bread-making conditions, except for the amounts of oxidizing and reducing agents, were all performed under the same conditions. Therefore, the data concerning BMQ in this study is more reliable than that of a normal bread-making test. This is also because all the bread-making conditions in this study, except for the physical properties of dough, are the same.
On the other hand, actual bread-making is rarely carried out under constant conditions even in a research laboratory, and various wheat flours and other raw materials are used for bread-making. These are considered to be the main factors making it complicated and difficult to analyze the relationship between BMQ (mainly GRD and SLV) of dough, PPD, and the dough expansion rate.
Moreover, this study focused on the analysis of the influence of PPD and dough expansion rates on GRD and SLV. However, there are many other factors that affect GRD and SLV, such as wheat flour characteristics and dough composition. Therefore, it is necessary to study whether similar results can be obtained using different flours and dough compositions.
Conclusion
The physical properties (E0, ηN, and τ0) of various white bread doughs without the addition of yeast, to which various amounts of ASA and GSH were added, were measured by the creep method based on the Maxwell model. The expansion stress behaviors of those various doughs during the proofing process were also obtained by a numerical calculation method. The obtained results showed that the dough with a large τ0 and quick fermentation had the largest expansion stress in the proofing process and that the σend also had the highest value. Meanwhile, the dough with a small τ0 and slow fermentation showed the completely opposite tendency. This study also proved that the calculated σend was significantly correlated with BMQ, such as GRD and SLV. These results also showed that the BMQ of various white bread doughs could be greatly influenced by the PPD and fermentation speed.
References
- AAC. (1991). “Approved Methods of the AACC”, 8th ed. Method 08- 01. The American Association of Cereal Chemists, St. Paul, MN.
- AACC. (2000). Approved Methods of the AACCI, 11th ed. Method 10- 05.01. The American Association of Cereal Chemists International, St. Paul, MN.
- Bloksma, A. H. (1957). A calculation of the shape of the Alveograms of some rheological model substances. Cereal Chem., 34, 126-136.
- Janssen, A. M., van Vliet, T., and Vereijken, J. M. (1996). Fundamental and empirical rheological behaviour of wheat flour doughs and comparison with bread making performance. J. Cereal Sci., 23, 43-54.
- Kawai, H., Tanaka, F., Takahashi, H., Hashimoto, N., and Yamauchi, H. (2006a). Relationship between physical properties of dough and expansion ability during bread-making. Food Sci. Technol. Res., 12, 91-95.
- Kawai, H., Tanaka, F., Takahashi, H., and Yamauchi, H. (2006b). Measurement of physical properties and expansion ability of dough for bread making. Food Preservation Science, 32, 209-216.
- Matsumoto, H. (1991). Basic research on expansion of dough and loaf Internal pressure in yeast dough II, Bulletin of Kobe Women's University, 24, 161-178 (in Japanese).
- Matsumoto, H. and Nishiyama, J. (1973). Internal pressure in yeast dough II. Cereal Chem., 50, 363-371.
- Matsumoto, H. (1981). Various basic research on the expansion of bread. Cyourikagaku, 68, 215-221 (in Japanese).
- Rao, V. K., Mulvaney, S. J., and Dextert, J. E. (2000). Rheological characterisation of long- and short-mixing flours based on stress- relaxation. J. Cereal Sci., 31, 159-171.
- Santiago, D. M., Matsushita, K., Noda, T., Tsuboi, K., Yamada, D., Murayama, D., Koaze, H., and Yamauchi, H. (2015). Effect of purple sweet potato powder substitution and enzymatic treatments on bread making quality. Food Sci. Technol. Res., 21, 159-165.
- Takata, K., Nishio, Z., Funatsuki, W., Kuwabara, T., and Yamauchi, H. (2003). Difference in combination between Glu-B1 and Glu-D1 alleles in bread-making quality using near-isogenic lines. Food Sci. Technol. Res., 9, 67-72.
- Takata, K., Yamauchi, H., Nishio, Z., and Kuwabara, T. (2003). Effect of high molecular weight glutenin subunits on bread-making quality using near-isogenic lines. Breed. Sci., 50, 303-308.
- Yamauchi, H., Ichinose, Y., Takata, K., Iriki, N., and Kuwabara, T. (2000). Simple estimation of bread-making quality of wheat flour by modified expansion test under reduced pressure. J. Jpn. Soc. Food Sci. Technol.(Nippon Shokuhin Kagaku Kogaku Kaishi), 47, 46-49 (in Japanese).
- Yamauchi, H., Nishio, Z., Takata, K., Oda, Y., Yamaki, K., Ishida, N., and Miura, H. (2001). The bread-making quality of a domestic flour blended with an extra strong flour and staling of the bread made from the blended flour. Food Sci. Technol. Res., 7, 120-125.
- Yamauchi, H., Noda, T., Matsuura-Endo, C., Nishio, Z., Takata, K., Tabiki, T., Saito, K., Oda, Y., Funatsuki, W., and Iriki, N. (2003). Improving domestic flour for bread making by blending extra strong (ES) flour. Food Preservation Science, 29, 211-220.
- Yamauchi, H., Yamada, D., Murayama, D., Santiago, D. M., Orikasa, Y., Koaze, H., Nakaura, Y., Inouchi, N., and Noda, T. (2014). The staling and texture of bread made using the Yudane dough method. Food Sci. Technol. Res., 20, 1017-1078.7


 : ASA 100 ppm,
  : ASA 0 ppm,
  : GSH 50 ppm,
  : GSH 100 ppm.