Abstract
This study investigated the effect of epigallocatechin gallate (EGCg) on Staphylococcus aureus to determine its mechanism of antibacterial action. Adsorption of EGCg on the cell envelope of S. aureus after EGCg treatment was demonstrated using a FITC-labeled antibody specific to EGCg. After EGCg treatment of S. aureus for 4 h, abnormalities in septum formation and cell segregation were observed at concentrations greater than 250 mg/L, and debris presumed to arise from cell destruction or leakage of cytoplasmic materials was observed around the cells at 500 mg/L. Two-dimensional electrophoresis of proteins prepared from EGCg-treated S. aureus cells revealed the presence of 18 protein spots that disappeared or showed markedly decreased intensity compared to those from control cells. These proteins included DnaK, elongation factor G, DNA-directed RNA polymerase, l-lactate dehydrogenase, pyruvate dehydrogenase, and acetate kinase. Furthermore, S. aureus showed decreased glucose uptake after EGCg treatment. These results suggest that EGCg inhibits the functions of cell-envelope proteins, and it causes cellular damage and disruption of the cells in S. aureus.
Introduction
Mass production of both processed and natural foods has been rapidly developed in the past few years. Food additives from both natural and artificial sources have become a major component in all kinds of food industries. Tea is the second most consumed beverage worldwide besides water and has shown potential health benefits, leading to numerous investigations on its chemical components and their biological properties (Gupta et al., 2002). Many non-antibiotic compounds including green tea polyphenols have been reported to possess antibacterial activities (Steinmann et al., 2013). Catechins, a class of polyphenols abundant in green tea, have several useful properties including antibacterial activity (Himilliton-Miller, 1995; Juneja et al., 2007), antioxidant activity (Cao et al., 1996; Rice-Evans et al., 1996), anticarcinogenic effects (Ahmad and Mukhtar, 1999; Buschman, 1998), and body fat reduction activity (Maki et al., 2009; Murase et al., 2002). They can be classified into four major types according to their chemical structure: epigallocatechin gallate (EGCg), epigallocatechin (EGC), epicatechin gallate (ECg), and epicatechin (EC) (Singh et al., 2011). Among catechins, epigallocatechin gallate (EGCg) possesses particularly strong antibacterial activity (Mabe et al., 1999). The activity of pure EGCg has been investigated against gram-positive and gram-negative bacteria (Steinman et al., 2013). To clarify the underlying mechanism of antibacterial action, Nakayama et al. (2013) investigated the effects of EGCg on the cellular proteins of E. coli by two-dimensional polyacrylamide gel electrophoresis (2D-PAGE) and identified 16 protein spots that disappeared or showed markedly decreased intensity after treatment with EGCg compared to the control. They thus concluded that EGCg inhibits the major function of porin proteins, particularly involved in the passive transport of small hydrophilic molecules such as glucose, leading to growth inhibition in E. coli.
Staphylococcus aureus has been reported as one of the most common causes of foodborne disease worldwide, ranging from localized skin lesions to systemic infections and other life-threatening complications (Furuya, 2006). The bacterial cell wall is the first barrier exposed to environmental, physical, and chemical hazards. Thus, studies on antibiotics investigate antibacterial activities that target or interfere with cell wall biosynthesis to encounter the bacterial infection (Jordan et al., 2008). Some strains of S. aureus are resistant to various antibiotics. Compared to antibiotics, naturally occurring antimicrobials, such as EGCg, do not induce resistance acquisition in bacteria. The antibacterial action of EGCg on S. aureus has been investigated by Nakayama et al. (2012). Using SDS-PAGE, they demonstrated that green tea extracts including EGCg as a major component, attached to the surface proteins of S. aureus to form high-molecular weight complexes, suggesting inhibition of the functions of these proteins. However, these proteins were not identified in S. aureus. Although EGCg are widely studied in the context of their antibacterial properties against S. aureus in combination with antibiotics (Zhao W.H. et al., 2001), the antibacterial mechanism of EGCg alone against S. aureus remains to be clarified.
In this study, we investigated the effect of EGCg on viability, cell morphology, and proteins in S. aureus to determine its mechanism of antibacterial action.
Materials and Methods
Bacterial strain and culture conditions Staphylococcus aureus NCTC 8325 was obtained from the National Collection of Type Cultures of Public Health England, Porton Down, Salisbury, SP4 0JG UK. S. aureus was cultured overnight at 37 °C in Trypticase Soy Broth (TSB, Becton, Dickinson and Co., Franklin Lakes, NJ, USA) containing 2% NaCl (2% NaCl-TSB) with shaking at 130 rpm, to obtain cells in the stationary phase of growth (Bacterial concentration, ca. >109 CFU/mL). The cells were harvested and washed twice with sterile water. The final suspension was prepared by suspending the pelleted bacterial cells in sterile water to attain a final concentration of ca. 1010 CFU/mL for subsequent experiments.
Time-dependent effects of EGCg on growth, viability, and morphology Time dependency of the antibacterial action of EGCg on growth and viability of S. aureus was investigated. EGCg (Teavigo®, containing 95% EGCg; DSM Nutrition Japan, Tokyo, Japan) was dissolved in 0.1 M Na-phosphate buffer (pH 6.5) or sterile water at 10 g/L. The EGCg solution was sterilized by filtration through a membrane filter (pore size 0.2 µm, Kurabo Industries Ltd., Tokyo, Japan). To examine the effects of EGCg on the growth of S. aureus, the sterile EGCg solution was added to 3 mL of 2% NaCl-TSB to attain final EGCg concentrations of 125, 250, and 500 mg/L. To 3 mL of the broth containing EGCg in a test tube, 0.03 mL of bacterial cell suspension (1010 CFU/mL) was added to attain a final concentration of ca. 108 CFU/mL. The sterile EGCg solution was diluted to 550 mg/L with the same buffer to investigate its effects on bacterial cell viability in the buffer. To 3 mL of EGCg solution in a test tube, 0.3 mL of bacterial cell suspension (1010 CFU/mL) was added to attain a final concentration of ca. 109 CFU/mL. For the control, cells were mixed with broth or buffer without EGCg. The mixtures were thoroughly vortexed and incubated for 24 h at 37 °C with gentle shaking. Cells were harvested from 1 mL of culture at suitable intervals by centrifugation, and suspended in 0.1 mL of sterile water. The cell suspension was then mixed with 0.001 mL of 0.05 mg/mL 4′,6-diamidino-2-phenylindole (DAPI, Thermo Fisher Scientific Inc.) solution. The stained cells and nucleoids were observed using a fluorescence microscope BX53 (OLYMPUS Corporation, Tokyo, Japan) with excitation at 358 nm and emission at 461 nm.
Viable counts were determined after dilution with PBS. The diluted sample (0.1 mL) was spread over Trypticase Soy Agar (TSA, Becton, Dickinson and Co., Franklin Lakes, NJ, USA) containing 2% NaCl (2% NaCl-TSA) or Mannitol Salt Agar (MSA, Nissui Pharmaceutical Co., Ltd., Tokyo, Japan). Viable bacterial counts were determined after cultivation for 24 to 48 h at 37 °C. Since TSA is non-selective media rich in nutrients supporting the growth of both intact and injured cells, colony counts from 2% NaCl-TSA were defined as total viable count. On the other hand, MSA is a selective media for Staphylococcus aureus. The medium contains high concentration of salt (7.5%), the colony counts from MSA were defined as intact or uninjured cell count.
Measurement of oxygen consumption rate accompanied by glucose uptake The effect of EGCg on the incorporation of substrates was determined. S. aureus was cultured overnight in 2% NaCl-TSB at 37 °C. The preculture was transferred to a fresh medium to obtain cells in the exponential phase of growth. Bacterial cells were harvested by centrifugation at 6,000 × g, 5 min, 25 °C. The cells were resuspended in 1.0 mL of 10 mM HEPES Buffer (Irvine Scientific, Santa Ana, CA, USA), pH 6.0, containing 2% NaCl (2% NaCl-10 mM HEPES Buffer). 500 mg/L of the EGCg solution was added to bacterial cell suspension to attain a final concentration of 109 CFU/mL. For control, bacterial cell suspension was mixed with buffer without EGCg. The samples were then incubated at 35 °C for 1 h. After incubation, the cells were centrifuged and resuspended in 1.0 mL 2% NaCl-10 mM HEPES Buffer (pH 6.0). One mL of sample solution was added to a DOX S-electrode cell (Bio-Theta, Ltd., Osaka, Japan), to which 1 mL of a 0.2% glucose solution supplemented in 2% NaCl-10 mM HEPES buffer (pH 6.0) was added. The DOX S-electrode cells were immediately placed in a DOX-60F analyzer (Bio-Theta, Ltd., Osaka, Japan) The movement of electron involved in oxygen reduction is captured as electric current. Moreover, the dissolved oxygen in the fluid of the DOX cell was measured using an oxygen electrode.
Detection of EGCg on S. aureus cells S. aureus was cultured in with 2% NaCl-TSB, at 37 °C with shaking. Detection of EGCg on bacterial cells treated with EGCg at 0, 250, 500, and 1,000 mg/L was performed according to the method described by Miyamoto et al. (2017). The bacterial cells were collected by centrifugation at 8,000 × g for 5 min at 4 °C. The cells were then washed twice with 0.1 M Na-phosphate buffer (pH 6.5) by centrifugation. The cells pellets were resuspended in 0.1 M Na-phosphate buffer to a final concentration at about 108 CFU/mL. Next, 0.1 mL EGCg solution was added to 0.9 mL bacterial cell suspension and the mixture was incubated at 37 °C for 1 h. The mixture was again washed by centrifugation at 8,000 × g for 5 min at 4 °C and resuspended in 0.1 mL of 0.1 M Na-phosphate buffer. Two microliters of the cell suspension were mixed with 0.002 mL of the FITC-labeled MAb b-1058 (2.04 mg/mL) and the mixture was observed using a fluorescence microscope BX53 with excitation at 488 nm and emission at 520 nm. The FITC-labeled antibody b-1058, a specific antibody which bind to EGCg, was prepared in our laboratory according to the previous research by Miyamoto et al. (2017).
2D-PAGE To 3 mL of EGCg solution at 1,000 mg/L in a test tube containing 27 mL of 0.1 M Phosphate buffer solution to give 30 mL, then 0.3 mL of S. aureus suspension (1010 CFU/mL) was added to attain a final concentration of ca. 108 CFU/mL. The mixture was vortexed and then incubated at 37 °C for 1 h. The extraction of the proteins of the cells treated with and without EGCg, 2D-PAGE and identification of the protein spots were performed by following the methods previous described by Nakayama et al. 2013.
Statistical analysis The experiments were repeated 3 times and all data were expressed as mean ± standard deviation. Comparisons among groups were performed by using one-way ANOVA followed by Tukey-Kramer multiple comparison post hoc test (Figs. 1, and 2). A probability of P < 0.05 was considered to be statistically significant. Statistical analysis was performed using Excel 2010 (Microsoft, USA) with the add-in software Statcel 3 (Yanai, 2011).
Results
Time-dependent changes of viability in the presence of EGCg The changes in S. aureus viability in the presence and absence of EGCg were determined in both broth and buffer.
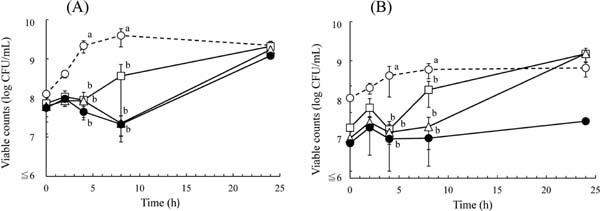
In the broth, there were no significant changes in the viable count in the presence of EGCg, as determined by 2% NaCl-TSA after 4 h, and growth inhibition by EGCg was observed at concentrations greater than 125 mg/L (Fig. 1(A)). The counts were decreased by about 0.7 log after 8 h in the presence of EGCg at 250 and 500 mg/L compared to those at 2 h but were increased to levels similar to those in the absence of EGCg after 24 h (Fig. 1(A)). The viable counts determined by MSA in the presence of EGCg were about 1 log lower than those of control cells without EGCg even at 0 h, suggesting that the damages caused by EGCg were recoverable on 2% NaCl-TSA (Fig. 1(A) and (B)). After incubation for 8 h in the presence of 250 and 500 mg/L EGCg, the viable counts by MSA were maintained at levels similar to those at 0 h. Although the viable counts were largely increased to levels similar to the control after 24 h incubation in the presence of 125 and 250 mg/L EGCg, the counts were only slightly increased at 500 mg/L after the same incubation period (Fig. 1(B)).
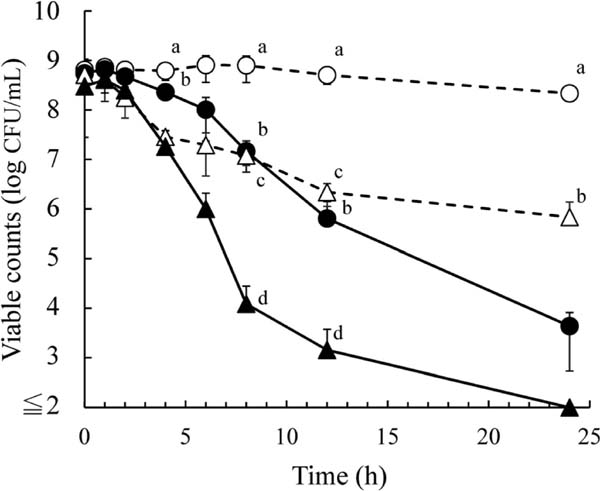
In buffer, as shown in Fig. 2, the viable counts of S. aureus as determined by 2% NaCl-TSA did not decrease in the presence of 500 mg/L EGCg at 2 h; however, they began to decrease after incubation for 4 h, and were decreased in a time-dependent manner thereafter. The viable counts determined by MSA were lower than those on 2% NaCl-TSA even in the absence of EGCg after incubation for 2 h. The viable counts by MSA were almost same despite the presence of EGCg until 4 h. However, after incubation for 6 h, the viable counts in the presence of EGCg were 3 log lower than those in the absence of EGCg when determined on MSA.
Detection of EGCg on bacterial cells using FITC-labeled MAb b-1058 S. aureus cells treated without or with EGCg at 250, 500, and 1,000 mg/L for 1 h were stained with FITC-labeled MAb b-1058. Fig. 3 shows the fluorescence micrographs of S. aureus cells treated with EGCg. The bacterial cells treated with EGCg showed green fluorescence around the cells and their fluorescence intensity increased with increasing concentrations of EGCg, indicating the presence of EGCg on their surface. In contrast, green fluorescence was not observed on control cells without EGCg.

Effects of EGCg on morphology of S. aureus In order to determine the effects of EGCg on the morphology and division of S. aureus, cells cultured without and with EGCg for 4 and 24 h were stained with DAPI, and then observed using a combined phase-contrast microscopy method. The untreated bacterial cells display typical cell morphology with a single central division septum at both 4 and 24 h of incubation (Fig. 4 (A) and (D)). On the other hand, S. aureus cultured in the presence of EGCg exhibited aggregation of cells. The aggregation increased with increasing EGCg concentrations. Septum formation in some EGCg treated cells seemed to be abnormal. Cell segregation was also inhibited (Fig. 4(B), (C), (E) and (F)). In addition, debris were observed around the cells in the presence of 500 mg/L EGCg.

2D-PAGE analysis of cellular proteins of S. aureus treated with EGCg The 2D-PAGE pattern of S. aureus cell proteins prepared from EGCg treated and untreated cells is shown in Fig. 5. Imaging analysis of the total protein migration pattern showed that the spot intensity of 18 protein spots present in the control sample was decreased to ≤1/5 or was disappeared upon treatment with EGCg. The proteins corresponding to these spots tended to form aggregates and did not migrate in the gel after the treatment with EGCg. In total, 26 candidate proteins with significant scores were identified for the 18 proteins detected by 2D-PAGE (Table 1) and following among these were cell-envelope-associated proteins: DnaK, elongation factor G, DNA-directed RNA polymerase, l-lactate dehydrogenase, pyruvate dehydrogenase, and acetate kinase (Gatlin et al., 2006).

Table 1.
Identification of
S. aureus proteins whose spot intensity was decreased to ≤1/5, or those that disappeared upon treatment with EGCg.
| Spot No |
Annotation name |
GI number |
tMwa |
tPIb |
| 1 |
ornithine carbamoyltransferase |
gi|15925624 |
37867 |
5.15 |
| 2 |
molecular chaperone DnaK |
gi|296275798 |
66426 |
4.67 |
|
pyruvate kinase |
gi|323440758 |
63291 |
5.23 |
|
molecular chaperone DnaK |
gi|15924570 |
66378 |
4.65 |
| 3 |
elongation factor G |
gi|15923537 |
76849 |
4.80 |
| 4 |
ornithine carbamoyltransferase |
gi|57650280 |
37721 |
5.06 |
| 5 |
phosphoenolpyruvate-protein phosphotransferase |
gi|57651692 |
63350 |
4.66 |
| 6 |
elongation factor G |
gi|15923537 |
76849 |
4.80 |
| 7 |
DNA-directed RNA polymerase subunit beta |
gi|15923532 |
133504 |
4.90 |
| 8 |
l-lactate dehydrogenase |
gi|87161566 |
29543 |
4.95 |
|
phosphate acetyltransferase |
gi|15923578 |
35044 |
4.72 |
| 9 |
pyruvate dehydrogenase E1 component alpha subunit |
gi|15924083 |
41357 |
4.90 |
| 10 |
formate acetyltransferase |
gi|161508484 |
85829 |
5.27 |
| 11 |
fructose-bisphosphate aldolase |
gi|15925115 |
30931 |
5.01 |
| 12 |
acetate kinase |
gi|334277390 |
39296 |
5.71 |
| 13 |
aspartyl/glutamyl-tRNA amidotransferase subunit B |
gi|15924889 |
53680 |
5.23 |
| 14 |
glycerate dehydrogenase |
gi|21283953 |
34653 |
5.14 |
| 15 |
asparaginyl-tRNA synthetase |
gi|302332230 |
56710 |
5.08 |
|
lysyl-tRNA synthetase |
gi|258424447 |
59021 |
5.12 |
| 16 |
inositol-monophosphate dehydrogenase |
gi|21282095 |
52904 |
5.61 |
| 17 |
CoA-disulfide reductase |
gi|283470186 |
49371 |
5.27 |
|
SufS subfamily cysteine desulfurase |
gi|269202469 |
46398 |
5.33 |
| 18 |
hypothetical protein MW1941 |
gi|21283670 |
38738 |
8.76 |
|
gamma-hemolysin component B |
gi|253734881 |
38776 |
8.72 |
|
leukocidin/hemolysin toxin family protein |
gi|87160982 |
38776 |
8.72 |
|
leukocidin F subunit |
gi|82751596 |
38721 |
8.58 |
Effect of EGCg on glucose uptake The oxygen consumption rate accompanied by glucose uptake was measured using the DOX-60F analyzer. Fig. 6 shows the effect of EGCg treatment on the oxygen consumption rate due to glucose uptake. The oxygen consumption rate of EGCg-treated cells was lower than that of untreated cells, indicating the decreased glucose uptake.
Discussion
The results of this study suggest that EGCg binds to bacterial cells and inhibits the function of various cell-envelope proteins in S. aureus, resulting in cell aggregation and decrease in viability leading to death. Fluorescence microscopy analysis of EGCg-treated cells stained with FITC-labeled MAb b-1058 shows localization of EGCg on the bacterial cell surface (Fig. 3). This finding corresponds with a previous study reported by Nakayama et al. (2011). S. aureus cells treated with EGCg in phosphate buffer showed decreased viability determined by the plating method using 2% NaCl-TSA in a time-dependent manner (Fig. 2). In 2% NaCl-TSB, the presence of 500 mg/L EGCg inhibited the growth of S. aureus until 8 h of incubation, but the viable counts determined by 2% NaCl-TSA were increased to levels similar to those of the control after 24 h (Fig. 1(A)). However, the counts by MSA did not increase after incubation for 24 h (Fig. 1(B)). These results suggest that S. aureus cells remained damaged but proliferated in 2% NaCl-TSB even in the presence of 500 mg/L EGCg.
The viable counts determined by MSA were lower than those on 2% NaCl-TSA even in the absence of EGCg after incubation for 2 h. TSA is a nutrient rich growth medium, allowing both intact and injured cells to form colonies on the agar. The nutrient content of MSA, selective media of S. aureus, is lower than that of TSA. NaCl contents of MSA and 2% NaCl-TSA are 7.5% and 2% NaCl, respectively. It has been reported that on unstressed cells of S. aureus, indicating a decrease in viable count of the organism at any pH level as the NaCl concentration increases (Constantin et al., 1971; Smolka et al., 1974). The water activity (aw) of the medium decreased with increase in salt concentration is one of the major parameters influencing bacterial growth and survival (Wijnker et al., 2006). The lethal effect of a low aw (Gutierrez et al., 1995) is linked to the fact that the turgor pressure in a cell established as a result of the intracellular aw and the aw in the surrounding medium. These facts seem to be the reason why the viable counts of control cells determined on MSA were lower than those on 2% NaCl-TSA.
It has been shown that glucose uptake by E. coli was inhibited in cells treated with EGCg (Nakayama et al., 2013). Glucose uptake of EGCg-treated and untreated S. aureus cells was measured at pH 6.0 to avoid stress due to H2O2 produced by EGCg (Arakawa et al., 2004). Our results indicate that the oxygen consumption rate of EGCg-treated S. aureus cells was lower than that of untreated cells (Fig. 6), showing a decrease in glucose uptake after treatment with EGCg similar to observations in E. coli. According to the results of the localization of EGCg visualized by the MAb and those of 2D-PAGE, it seems that the decrease in glucose uptake of S. aureus treated with EGCg was attributed to the decrease in the function of transporter due to the inhibition of the function of the proteins involved in energy generation by EGCg and the EGCg itself attached on the surface of the bacterial cells.
It is reported that EGCg can directly bind to the bacterial cell membrane (Yoda et al., 2004, Zhao, et al., 2001) and interfere with the structures of the lipid bilayer, proteins, or peptides through hydrogen bonding determined by its hydroxyl group or galloyl group (Madhana et al., 2007). Nakayama et al. (2012) showed that green tea extract containing EGCg attached to proteins on the bacterial surface to form high-molecular weight complexes. However, binding between EGCg and S. aureus proteins remain unclear. In 2D-PAGE analysis, 18 protein spots were disappeared or remarkably decreased in EGCg-treated cells compared to untreated cells (Fig. 5). These results demonstrate that EGCg binds and aggregates proteins near the bacterial surface. Thus, the proteins in these spots were agglutinated by EGCg treatment and did not migrate in the gel. The results of the present study suggest that EGCg is attached to cell-envelope-associated proteins such as DnaK, elongation factor G, DNA-directed RNA polymerase, l-lactate dehydrogenase, pyruvate dehydrogenase, and acetate kinase (Gatlin et al., 2006). The proteins bound with EGCg on S. aureus are not the same to those of E. coli (Nakayama et al., 2013) according to the difference of cell membrane structure of Gram-positive and Gram-negative bacteria. In the case of E. coli, EGCg binds to the outer membrane porin proteins in the outer membrane (Nakayama et al., 2013). The results of DAPI-stained S. aureus cells also showed that EGCg was distributed across the cell surface and affected the septum formation of cells (Fig. 4). It seems that the function of these proteins was inhibited by EGCg, leading to decreased viability in buffer. l-lactate dehydrogenase catalyzes the conversion of lactate to pyruvic acid. Acetate kinase is a key enzyme to control acetyl phosphate levels and their conversion to acetyl-CoA. The enzyme is involved in the synthesis of ATP by reacting with ADP. Pyruvate dehydrogenase is involved in pyruvate decarboxylation, which converts pyruvate into acetyl-CoA. Acetyl-CoA may then enter the citric acid cycle to maintain cellular respiration. Inhibition of the functions of these proteins would thus reduce energy generation in bacterial cells. DnaK facilitates chromosomal DNA replication through analogous interactions by accumulating adequate DnaA protein. The chaperone also participates in the response to cellular stress, especially heat shock conditions. DNA-directed RNA polymerase is essential for transcription. Elongation factor G is a catalytic enzyme involved in the translocation step of translation. These facts suggest that EGCg affects DNA replication, transcription, and translation. The detailed effects of EGCg on bacterial DNA replication, transcription, and translation will be reported shortly.
EGCg was distributed across the cell surface (Fig. 3), suggesting effects on the functions of cell-envelope proteins. Examination of DAPI-stained cells showed that septum formation and cell segregation was disturbed with 250 mg/L EGCg. Debris formation due to disruption of cells or leakage of cellular materials was observed in micrographs of cells treated with 500 mg/L EGCg (Fig. 4). According to the US department of agriculture (USDA) report in 2007 that one cup of regular green tea contains approximately 800 mg/L of EGCg (i). These results indicate that EGCg, at a concentration equal to or less than that in the green tea drink, damages cells leading to cell disruption in S. aureus.
Conclusion
EGCg binds and damages S. aureus cells, especially the cell surface, as observed by fluorescence microscopy. However, the cells were recoverable from injury after EGCg treatment in broth but not in buffer. After the cultivation of S. aureus in 2% NaCl-Tryptic Soy Broth with 500 mg/L EGCg for 24 h, the S. aureus cells remained damaged but could proliferate. In phosphate buffer, the viable counts were decreased with an increase in the treatment time of EGCg. DAPI staining of S. aureus cells showed abnormal and misplaced division septa upon treatment with EGCg. The 2D-PAGE analyses of cellular proteins indicated that EGCg binds and aggregates the bacterial cell surface proteins, thus inhibiting their migration in the gel. Moreover, the oxygen consumption rate of S. aureus treated with EGCg was lower than that of untreated cells, indicating a decrease in glucose uptake after EGCg treatment.
Further research needs to be conducted to clarify the entire mechanism of antibacterial action of EGCg on S. aureus. The effects of EGCg on the changes in S. aureus gene expression will be investigated using DNA microarray analysis.
References
- Ahmad, N. and Mukhtar, H. (1999). Green tea polyphenols and cancer: biological mechanism and practical implications. Nutr. Rev., 57, 78-83.
- Arakawa, H., Maeda, M., Ookubo, S., and Shimamura, T. (2004). Role of hydrogen peroxide in bactericidal action of catechin. Biol. Pharm. Bull., 27, 277-281.
- Buschman, J. L. (1998). Green tea and cancer in humans: a review of the literature. Nutr. Cancer., 31, 51-57
- Cao, G., Sofic, E., and Prior, R. L. (1996). Antioxidant capacity of tea and common vegetables. J. Agric. Food Chem., 44, 3426-3431.
- Constantin, G., Sue, M., Charles, E. F., and Hans, R. (1971). Initiation of Staphylococcal Growth in Laboratory. Medi. Appl. Microbiol., 21, 934-939.
- Furuya, E.Y. and Lowy, F.D. (2006). Antimicrobial-resistant bacteria in the community setting. Nat. Rev. Microbiol., 4, 36-45.
- Gutierrez, C., Abee, T., and Booth, I.R. (1995). Physiology of the osmotic stress response in microorganisms. Int. J. Food Microbiol., 28, 233-244.
- Gupta, P. K., Balyan, H. S., Edwards, K. J., Isaac, P, Korzun, V., Röder, M., Gautier, M. F., Joudrier, P., Schlatter, A. R., Dubcovsky, J., De la Pena, R. C., Khairallah, M., Penner, G., Hayden, M. J., Sharp, P., Keller, B., Wang, R. C. C., Hardouin, J. P., Jack, P., and Leroy, P. (2002). Genetic mapping of 66 new microsatellite (SSR) in bread wheat. Theor. Appl. Genet., 105, 413-422.
- Himilliton-Miller, J. M. (1995). Antimicrobial properties of tea (Camellia sinensis L.). Antimicrob. Agents Chemother., 39, 2375-2377.
- Jordan, S., Hutchings, M. I., and Mascher, T. (2008). Cell envelope stress response in Gram-positive bacteria. Microbiol. Rev., 32, 107-146.
- Mabe, K., Yamada, M., Oguni, I., and Takahashi, T. (1999). In vitro and in vivo activities of tea catechins against Helicobacter pylori. Antimicrob. Agents Chemother., 43, 1788-1791.
- Madhana, B., Krishnamoorthya, G., Rao, J. R., and Nair, B. U. (2007). Role of green tea polyphenols in the inhibition of collagenolytic activity by collagenase. Int. J. Biol. Macromol., 41, 16-22.
- Maki, K. C., Reeves, M. S., Farmer, M., Yasunaga, K., Matsuo, N., Katsuragi, Y., Komikado, M., Tokimitsu, I., Wilder, D., Jones, F., Blumberg, J. B., and Cartwright, Y. (2009). Green tea catechin consumption enhances exercise-induced abdominal fat loss in overweight and obese adults. J. Nutr., 139, 264-270.
- Miyamoto, T., Zhang, X., Ueyama, Y., Kitichalermkiat, A., Nakayama, M., Suzuki, Y., Ozawa, T., Mitani, A., Shigemune, N., Shimatani, K., Yui, K., and Honjoh, K. (2017). Development of novel monoclonal antibodies directed against catechins for investigation of antibacterial mechanism of catechins. J. Microbiol. Methods, 137, 6-13.
- Murase, T., Nagasawa, A., Suzuki, J., Hase, T., and Tokimitsu, I. (2002). Beneficial effects of tea catechins on diet-induced obesity, stimulation of lipid catabolism in the liver. Int. J. Obes. Relat. Metab. Disord., 26, 1459-1464.
- Nakayama, M., Shigemune, N., Tsugukuni, T., Tokuda, H., and Miyamoto, T. (2011). Difference of EGCg adhesion on cell surface between Staphylococcus aureus and Escherichia coli visualized by electron microscopy after novel indirect staining with cerium chloride. J. Microbiol. Methods, 86, 97-103.
- Nakayama, M., Shigemune, N., Tsugukuni, T., Jun, H, Matsushita, T., Mekada, Y., Kurahachi, M., and Miyamoto, T. (2012). Mechanism of the combined anti-bacterial effect of green tea extract and NaCl against Staphylococcus aureus and Escherichia coli O157:H7. Food Control, 25, 225-232.
- Nakayama, M., Shimatani, K., Ozawa, T., Shigemune, N., Tsugukuni, T., Tomiyama, D., Kurahachi, M., Nonaka, A., and Miyamoto, T. (2013). A study of the antibacterial mechanism of catechins: isolation and identification of Escherichia coli cell surface proteins that interact with epigallocatechin gallate. Food Control., 33, 433-439.
- Rice-Evans, C. A., Miller, J. M., and Paganga, G. (1996). Structure-antioxidant activity relationship of flavonoids and phenolic acids. Free Radic. Bio. Med., 20, 933-569.
- Singh, S. P., Gundavarapu, S., Pena-Philippides, J. C., Rir-Sima-Ah, J., Mishra, N. C., and Wilder, J. A. (2011). Prenatal secondhand cigarette smoke promotes Th2 polarization and impairs goblet cell differentiation and airway mucus formation. J. Immunol., 187, 4542-4552.
- Smolka, L. R., Nelson, F. E., and Kelley, L. M. (1974). Interaction of pH and NaCl on enumeration of heat-stressed Staphylococcus aureus, Applied Microbiology, 27, 443-447.
- Steinmann, J., Buer, J., Pietschmann, T., and Steinmann, E. (2013). Anti-infective properties of epigallocatechin-3-gallate (EGCG), a component of green tea. Br. J. Pharmacol., 168, 1059-1073.
- Wijnker, J. J., Koop, G., and Lipman, L.J.A. (2006). Antimicrobial properties of salt (NaCl) used for the preservation of natural casings. Food microbiol., 23, 657-662.
- Yanai, H. (2011). “Statcel 3-the useful add-in software forms on Excel”, 3rd edn. OMS, Tokyo.
- Yoda, Y., Hu, Z. Q., Zhao, W. H., and Shimamura, T. (2004). Different susceptibilities of Staphylococcus and gram-negative rods to epigallocatechin gallate. J. Infect. Chemother., 10, 55-58.
- Zhao, J. X., Hu, K., Collerson, K. D., and Xu, H. K. (2001). Thermal ionization mass spectrometry U-series dating of a hominid site near Nanjing, China. Geology, 29, 27-30.
- Zhao, W.H., Hu, Z.Q., Okubo, S., Hara, Y., and Shimamura, T. (2001). Mechanism of synergy between epigallocatechin gallate and β-Lactams against methicillin-resistant Staphylococcus aureus. J. Antimicrob. Chemother., 45, 1737-1742.
- i) https://www.ars.usda.gov/ARSUserFiles/80400525/Data/Flav/Flav02-1.pdf