Introduction
Wasabi (Wasabia japonica Matsumura) is a perennial plant that belongs to the Brassicaceae family, and its rhizome is widely used as a pungent spice (wasabi) in Japanese foods such as sushi and sashimi. The pungent component of wasabi is a volatile allyl isothiocyanate (AITC) component, which differs from capsaicin, the pungent component of red pepper. Most studies on wasabi have focused on volatile components, especially AITC, which are not originally present in wasabi itself. When wasabi is grated, sinigrin glycoside in the plant cells is hydrolyzed by myrosinase to produce the volatile components (Lüthy and Matile, 1984). Many isothiocyanates (ITCs) have been identified from wasabi (Etoh et al., 1990). Among them, 6-methylsulfinylhexyl isothiocyanate (6-MSITC) has been intensely researched, and its antibacterial (Ono et al., 1998), anti-inflammatory (Uto et al., 2005), antimutagenic (Kinae et al., 2008), and antiplatelet activities have been reported. The antibacterial properties of ITCs have been exploited in the preparation of antibacterial agents and deodorants (Morimitsu et al., 2000).
In previous research, it has been reported that the amounts of ITCs in the wasabi rhizome are higher than those in the stem and leaves (Etoh et al., 1990). As the wasabi rhizome is rich in functional components such as ITCs, the main purpose of current wasabi cultivation is to harvest the rhizome. For this reason, some parts such as the leaf, stem, and flower are only used for edible purposes, with the majority being discarded. Flavonoids, phenylpropanoids, and carotenoids have been identified in previous studies on wasabi leaves. (Hosoya et al., 2005, Yoshida et al., 2015). In addition, there are reports on the antioxidant (Hosoya et al., 2008), anti-inflammatory (Yoshida et al., 2015), antigenotoxic (Shimamura et al., 2008), and fat accumulation inhibiting activities (Misawa et al., 2018). These reports are considered to contribute to the effective use of wasabi leaves. To the best of our knowledge, however, research on the wasabi flower, which produces a similar level of waste as the leaves, has not previously been reported.
Recently, attention has been focused on the application of waste and byproducts resulting from food processing, as well as under-utilized agricultural products. The problems related to food industry waste are difficult to solve, and increased efforts are needed to develop the industrial potential of these non-used or under-utilized raw materials as new, alternative and cheaper resources for industrial applications (Banerjee et al., 2017).
In the course of our screening, we also found that the methanolic extract of wasabi flowers showed strong activity against lipopolysaccharide (LPS)-induced nitric oxide (NO) production by macrophages compared to wasabi rhizome and leaves. NO is a free radical associated with processes of vasodilation, smooth muscle relaxation, and neurotransmission (Phaniendra et al., 2015). This free radical plays important regulatory roles in the early stages of inflammatory cell transmigration to the site of inflammation. Further, it plays major roles in host protection from parasites, mycobacteria, fungi, and viruses (Green et al., 1991, Xie and Nathan, 1994). However, the sustained production of NO sometimes has adverse effects such as vascular dilatation, sepsis or organ failure (Wollert et al., 2002, Zamora et al., 2000).
Besides inhibition of NO production, the methanolic extract of wasabi flowers showed greater 2,2-diphenyl-1-picrylhydrazyl (DPPH) radical scavenging activity than wasabi rhizome and leaves. The oxidative damage created by free radical generation is a critical etiological factor implicated in several chronic human diseases such as cancer and infectious diseases (Newman et al., 2012). Several epidemiologic studies have indicated that a diet rich in fruits and vegetables provides protection against oxidative stress disorders and lowers the occurrence of chronic diseases, namely cancer and diabetes (Gul et al., 2016). Indeed, plants like herbs, fruits and vegetables are considered to be primary sources of many bioactive compounds. Among them, polyphenols exhibit strong medicinal and nutritional effects (Ekor, 2014). It is inferred that polyphenols are also contained in wasabi flowers; however, no studies have been conducted on its component composition.
The purpose of this research is thus to clarify previously unknown compounds of wasabi flowers, and to identify antioxidant and anti-inflammatory active compounds contained in the flowers.
Materials and Methods
Plant material The flowers of Wasabia japonica Matsumura (5.0 kg), cultivated in Memanbetsu, Hokkaido, Japan, were collected in April 2013.
Extraction and isolation Wasabi flowers (5.0 kg) were dried in an incubator (40 °C, 96 h) and pulverized to obtain the dried sample. The dried flowers were then extracted with methanol (MeOH) (3 L) two times, acetone (3 L) three times, ethyl acetate (EtOAc) (3 L) three times, and 50 % MeOH (2 L) two times. The combined extract was concentrated under vacuum. The obtained concentrated extract was suspended in water, and then extracted with n-hexane (1 L) three times, EtOAc (1 L) six times, and n-butanol (n-BuOH) (1 L) two times successively using a separation funnel. The respective layers were then concentrated under vacuum to give the following extracts: n-hexane extract (25.1 g), EtOAc extract (7.3 g), n-BuOH extract (12.9 g), and water extract (117.8 g). All extracts were subjected to DPPH radical scavenging activity and NO inhibition assays. EtOAc and n-BuOH extracts showed activities in a dose-dependent manner. The EtOAc extract was separated by column chromatography over silica gel 60N (spherical, neutral, 63–210 µm; Kanto Chemical Co., Inc., Tokyo, Japan). The column was eluted sequentially with chloroform, chloroform/MeOH (49:1, 19:1, 8:2, 7:3, 6:4, v/v) and MeOH to give ten fractions (E1–10). E4 was purified by HPLC in a Jasco PU-2086 Plus system equipped with a Jasco UV-2075 Plus detector (254 nm) (Jasco Co., Inc., Tokyo, Japan) and a Capcell Pak C18 reversed phase column (5 µm, ϕ20 × 250 mm; Shiseido, Tokyo, Japan). The column was eluted with the following gradient program: acetonitrile (MeCN)/H2O, 10:90 (0 min) – 15:85 (5 min) – 50:50 (20 min) – 0:100 (30 min), to give 1 (2.8 mg) and 2 (1.8 mg). E5 was separated by column chromatography over silica gel 60 N. The column was eluted sequentially with chloroform/MeOH (9:1, 8:2, 7:3, 6:4, 1:1, 4:6, 3:7, 2:8, 1:9, v/v) to give seven fractions (E5-1 – 5-7). E5-3 was purified by preparative HPLC (MeCN/H2O (0.1 % formic acid), 20:80, v/v) to obtain 1 (1.2 mg), 3 (1.2 mg), and 4 (0.8 mg). E6 was purified by preparative HPLC (MeCN/H2O (0.1 % formic acid), 30:70, v/v) to obtain 5 (18.1 mg). E7 was purified by preparative HPLC (MeCN/H2O (0.1 % formic acid), 25:75, v/v) to obtain 6 (2.2 mg), 7 (2.0 mg) and 8 (5.8 mg). E9 was purified by preparative HPLC (MeCN/ H2O (0.1 % formic acid), 20:80, v/v) to obtain 9 (22.8 mg) and 10 (7.4 mg). The n-BuOH fraction was purified by preparative HPLC (MeCN/H2O (0.1 % formic acid), 20:80, v/v) to obtain 9 (17.2 mg), 10 (8.5 mg), and 11 (4.5 mg).
Structural determination of components by NMR and MS analyses The compounds that were isolated through preparative HPLC were further identified by NMR and MS analyses. The 1D 1H (400 MHz) and 13C NMR (100 MHz) spectra, and the 2D COSY, HSQC and HMBC spectra were recorded on an AVANCE III 400 spectrometer (Bruker BioSpin, Billerica, MA, USA). The chemical shift values (δ) have been reported in ppm, and the coupling constants (J) have been reported in Hz. The chemical shifts in the 1H and 13C NMR spectra were corrected using the residual solvent signals of methanol-d4 (δH 3.31, δC 49.0) and dimethyl sulfoxide (DMSO)-d6 (δH 2.50, δC 39.5). High-resolution electrospray ionization mass spectra (HR-ESIMS) were recorded using an Accela LC system (Thermo Fisher Scientific, Waltham, MA, USA), equipped with a quadrupole mass spectrometer (Q-Exactive, Thermo Fisher Scientific). Xcalibur software was used for system control and data analysis.
DPPH free radical scavenging assay DPPH radical scavenging activity was evaluated according to a modified method previously reported by Okumura (Okumura et al., 2016). The reaction mixture contained 1.5 mL ethanol (EtOH), 0.1 mM DPPH and the test sample, which had been dissolved in a small amount of DMSO. After 30 min incubation at room temperature in the dark, the absorbance was recorded at 517 nm using a Spectra Max 190 microplate reader (Molecular Devices, Sunnyvale, CA, USA). The control solution contained only EtOH, with 0.2 % DMSO, and DPPH. The isolated compounds were evaluated at concentrations of 12.5, 25, 50, and 100 µM. The results were expressed as the percentage decrease in absorbance with respect to the control values. Trolox (6-hydroxy-2,5,7,8-tetramethylchroman-2-carboxylic acid) was used as the positive control.
Cell culture Murine macrophage J774.1 cells were cultured in RPMI-1640 medium (Nacalai Tesque Co., Inc., Kyoto, Japan) supplemented with 10 % fetal bovine serum, penicillin (10 U/mL) and streptomycin (100 µg/mL). J774.1 cells were seeded into a 96-well microplate at 100 µL per well, and preincubated for 24 h at 37 °C in a humidified atmosphere containing 5 % CO2. The cells were cultured in the medium containing LPS (5 µg/mL) with various concentrations of the test samples dissolved in DMSO for 24 h.
Determination of nitric oxide production and cell viability The production of NO was monitored using a Griess assay. The supernatant (100 µL) was transferred to a 96-well microtiter plate, and each sample was treated with 100 µL of Griess reagent (1 % sulfanilamide and 0.1 % N-l-naphthylethylenediamine dihydrochloride in 2.5 % H3PO4). The absorbance of each sample was measured at 550 nm using a Spectra Max 190 microplate reader. Cell viability was determined using a 3-(4,5-dimethylthiazol-2-yl) 2,5-diphenyltetrazolium bromide (MTT) assay. After the supernatant was removed, 100 µL of phosphate-buffered saline (PBS) containing 10 µL of a 5 mg/mL MTT solution was added to each well, and the cells were incubated for 2 h at 37 °C. The medium was then discarded and the formazan was dissolved in 100 µL of DMSO. The absorbance of the resulting DMSO solutions was then measured at 570 nm using a Spectra Max 190 microplate reader. All experiments were performed in triplicate for each sample. The ratio of NO production was determined from the difference in the absorbance values of the samples and the controls (mixed with 0.1 % DMSO). NG-Monomethyl-L-arginine (L-NMMA) was used as the positive control.
Quantification analysis of active compounds using HPLC Quantification of compounds with antioxidant or anti-inflammatory activities was performed using analytical HPLC. Analytical HPLC was carried out using an instrument equipped with a Jasco PU-980 (Jasco Co., Inc.) pump, a UV-2075 Plus detector, and a Capcell Pak C18 reversed phase column (5 µm, ϕ4.6 × 250 mm; Shiseido). The MeOH extract of wasabi flowers was analyzed using the following gradient program, with MeCN/H2O (in 0.1 % formic acid): 17:83 (0 min) – 17:83 (23 min) – 30:70 (24 min). The detection wavelength was set at 320 nm to detect the target compounds. Isolated compounds from the wasabi flowers were used as standards to obtain a calibration curve for each compound. The limits of detection (LOD) and quantification (LOQ) were determined at signal-to-noise (S/N) ratios of 3 and 10, respectively. Analysis of the MeOH extract of wasabi flowers was conducted three times, and the standard deviation (SD) was calculated. To correct for compound loss occurring during sample preparation, a spike test was conducted using hesperetin. Hesperetin was used because it has a similar skeleton as the target compounds and allows for good peak separation from the target compounds.
Results and Discussion
Identification of isolated compounds The column chromatography and preparative HPLC processes described in the experimental section resulted in the isolation of three phenylpropanoids (1–3), an alkaloid (4), and seven flavonoids (5–11) from the EtOAc and n-BuOH extracts of wasabi flowers (Fig. 1). Compound 8 is a newly discovered compound. The structures of these compounds were determined using NMR and MS analyses.
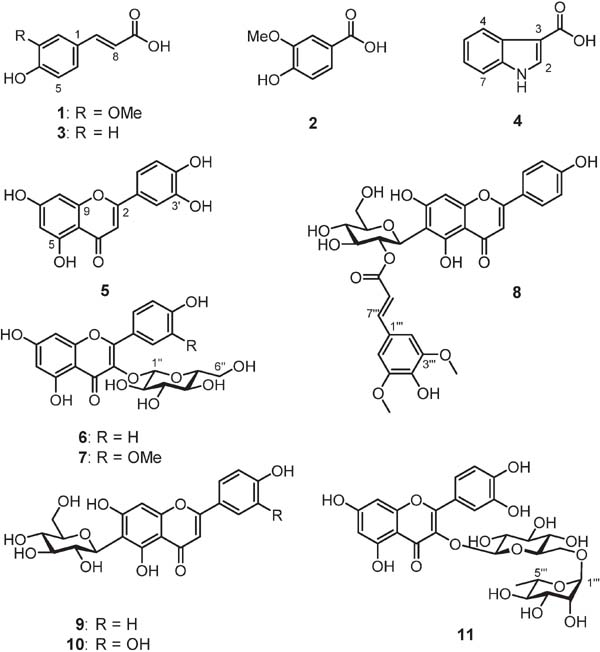
Structural elucidation of isolated compounds Compounds 1–3 were analyzed by 1H and 13C NMR spectroscopy in CD3OD. Evaluation of the 1H NMR data for 1 and 3 suggested that the olefinic protons are in a trans-configuration, based on the large coupling constant between the protons (i.e., J =16.0 Hz). Signals around δC 170 were observed in the 13C NMR spectra of 1 and 3, and the presence of carboxylic acid was considered. The molecular formulae of 1–3 were determined by HR-ESIMS; i.e., C10H10O4 (m/z 193.0496 [M−H]−, calculated for C10H9O4, 193.0495), C8H8O4 (m/z 167.0342 [M−H]−, calculated for C8H7O4, 167.0339) and C9H8O3 (m/z 163.0392 [M−H]−, calculated for C9H7O3, 163.0390), respectively. In addition, in reference to NMR spectral data in the literature, each compound was identified as trans-feruric acid (1), vanillic acid (2), and p-coumaric acid (3) (Prachayasittikul et al., 2009, Salum et al., 2010).
Compound 4 was isolated as a light yellow amorphous material, and its molecular formula was determined by HR-ESIMS as C9H7O2N (m/z 160.0396 [M−H]−, calculated for C9H6O2N, 160.0393). Aromatic signals were observed at δH 7.17–8.07 in the 1H-NMR spectrum. Therefore, 4 was predicted to be an indole alkaloid because of the nitrogen-containing compound. HMBC analysis of 4 showed a correlation between the H-2 (δH 7.94) and COOH (δC 169.1) signals, thus confirming the carboxylic acid position. In addition, in reference to NMR data in the literature, 4 was identified as indole-3-carboxylic acid (Wang et al., 2010).
Compound 5 was isolated as a yellow amorphous material, and its molecular formula was determined to be C15H10O6 by HR-ESIMS (m/z 285.0401 [M−H]−, calculated for C15H9O6, 285.0394). In the 1H NMR data, six aromatic-derived protons between δH 6.21 to 7.39, and two proton doublets (J = 8.0 Hz) at δH 6.90 and 7.39, which are typical signals of the flavonoid B ring, were observed. From the 13C NMR data, a carbonyl-derived signal was observed at δC 183.9, and a flavonoid skeleton was revealed for 5 by HSQC and HMBC spectra. In addition, in reference to the literature, 5 was identified as luteolin (Park et al., 2007).
Compounds 6, 7, 9, 10, and 11 were isolated as yellow amorphous materials. Their molecular formulae were determined by HR-ESIMS to be C21H20O11 (m/z 447.0935 [M−H]−, calculated for C21H19O11, 447.0922), C22H22O12 (m/z 477.1034 [M−H]−, calculated for C22H21O12, 477.1028), C21H20O10 (m/z 431.0978 [M−H]−, calculated for C21H19O10, 431.0973), C21H20O11 (m/z 447.0929 [M−H]−, calculated for C21H19O11, 447.0922) and C27H30O16 (m/z 609.1466 [M−H]−, calculated for C27H29O16, 609.1450), respectively. 1H and 13C NMR data of these compounds were similar to those of 5, suggesting the presence of a flavonoid skeleton. In the 1H NMR spectrum of 6, multiple signals from sugar were observed at δH 3.20 to 5.25, and an anomeric proton at δH 5.25 was also confirmed. The sugar moiety was determined as β-glucose because the coupling constant of the anomeric proton was 7.2 Hz. The 13C NMR spectrum of 6 showed nineteen carbon signals, and six sugar-derived signals were observed between δC 62.6 to 104.1. A cross peak between the anomeric proton at δH 5.25 (H-1″) and the carbon atom at δC 135.5 (C-3) was observed in the HMBC spectrum. As the carbon signal of C-1″ was observed at a relatively low magnetic field (δC 104.1), the O-glycosidic bond of the sugar was suggested to be linked to C-3. Based on the above information, 6 was identified as astragalin (Okuyama et al., 1978).
The 13C chemical shift values of 7 were in agreement with those of 6, except for the signals attributed to the flavonoid B ring (C-1 to C-6). In addition, from its 1H NMR spectrum, 7 was considered to have one additional carbon atom, one oxygen atom and two hydrogen atoms that were not observed in 6. Thus, a methoxy group is considered to be present at 7, and it was identified as isorhamnetin-3-glucoside (Kim et al., 2005).
In the 1H NMR spectrum of 9, multiple signals from sugar were observed at δH 3.28 to 4.59, and the anomeric proton at δH 4.59 was confirmed. The sugar moiety was determined as β-glucose, because the coupling constant of the anomeric proton was 9.6 Hz. The 13C NMR spectrum of 9 showed twenty carbon signals, including six sugar-derived signals that were observed around δC 61.4 to 81.5. A cross peak between the anomeric proton at δH 4.59 (H-1′) and the carbon atom at δC 108.9 (C-6) was observed in the HMBC spectrum. As the carbon signal of C-1″ was observed at a relatively high magnetic field, δC 73.1, it was suggested that the C-glycosidic bond of the sugar was linked to C-6. In addition, in reference to NMR spectra in the literature, 9 was identified as isovitexin (Rayyan et al., 2005).
The 13C chemical shift values of 10 were in agreement with those of 9, except for the signals attributed to the flavonoid B ring. It was confirmed that 10 had an additional oxygen atom, suggesting that two hydroxyl groups were attached to the B ring. In addition, in reference to NMR spectra in the literature, 10 was identified as isoorientin (Rayyan et al., 2005).
In the 1H NMR spectrum of 11, signals at δH 6.88 and 7.63 (J = 8.4 Hz) indicated ortho-bonding aromatic ring protons. In addition, multiple signals were observed between δH 3.27 to 5.11 from sugar, and two signals presumed to be anomeric protons at δH 4.52 and 5.11. In the 13C NMR spectrum of 11, twelve sugar-derived signals were observed between δC 17.9 to 145.7, suggesting the presence of a disaccharide. One sugar compound was determined to be β-glucose because the coupling constant of the anomeric proton was 7.6 Hz. The anomeric proton of another sugar compound had a very small coupling constant (1.0 Hz) in the 1H NMR spectrum, which indicated the presence of an α-sugar. Furthermore, a singlet signal, likely originating from a methyl group, was observed at δH 1.12. Thus, this sugar compound was determined to be α-rhamnose. A cross peak between the anomeric proton of glucose at δH 5.11 (H-1″) and the carbon atom at δC 135.6 (C-3) was observed in the HMBC spectrum.
As the carbon signal of C-1″ was observed at a relatively low magnetic field of δC 104.7, it was decided that the glucose had an O-glycosidic bond to C-3. A cross peak between the anomeric proton of rhamnose at δH 4.52 (H-1‴) and the carbon atom at δC 68.6 (C-6′) was observed in the HMBC spectrum. Thus, 1-position of rhamnose indicated an O-glycosidic bond with 6-position of glucose. Finally, 11 was identified as rutin by additional comparison with the reference standard (Li et al., 2008).
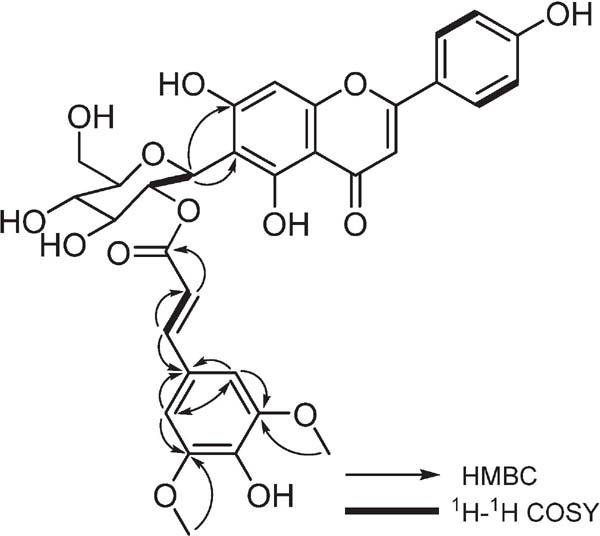
Compound 8 was isolated as a deep yellow amorphous material, and its molecular formula was determined by HR-ESIMS to be C32H30O14 (m/z 637.1561 [M−H]−, calculated for C32H29O14, 637.1552). In the 1H NMR spectrum of 8, measured in CD3OD, signals of six protons were observed between δH 6.46 to 7.77, indicating the presence of a flavonoid skeleton (Table 1). Among them, two signals at δH 6.89 and 7.77 were observed with an integral value of two protons; where two of the signal peaks in them were broad in CD3OD. Thus, the solvent used for this NMR analysis was replaced with DMSO-d6. In the 1H NMR spectrum obtained by using DMSO-d6 as the solvent, doublet signals with a coupling constant of 8.8 Hz were observed at δH 7.87, potentially indicating two sets of equivalent o-coupled aromatic ring protons. This then suggests that the structure of the flavonoid B ring is p-disubstituted benzene. Further, the 1H NMR spectrum of 8 showed signals for two methoxy group protons (δH 3.80), six sugar-derived protons (δH 3.73–5.13), and an anomeric proton (δH 5.13). The presence of a β-glucose was thus determined because the coupling constant of the anomeric proton was 9.6 Hz. Analysis of the 13C NMR spectrum of 8 showed a carbonyl carbon (δC 183.9), twenty-two aromatic and olefinic carbons (δC 95.4–168.2), two methoxy groups (δC 56.8) and six sugar-derived carbons (δC 62.8–82.9). However, the signal of C-5 was not detected. A cross peak between the anomeric proton at δH 5.13 (H-1′) and the carbon atom at δC 107.9 (C-6) was observed in the HMBC spectrum. As the carbon signal of C-1″ appears at a relatively high magnetic field (δC 73.2), the C-glycosidic bond of the sugar was linked to C-6. It was found that the signal at δH 3.75 (H-2′) for glucose appeared at a low magnetic field and was correlated with the signal at δH 5.13 (H-1′) in the 1H-1H COSY spectrum. Therefore, it was expected that some unit was bound to the C-2″. A signal derived from the ester carbonyl group at δC 168.2, and the doublet coupling constant 15.6 Hz of δH 6.32 and δH 7.58 was suggested to be present as a trans double bond. Moreover, two singlet signals at δH 6.76 (integral value of two protons) and δH 3.80 (integral value of six protons) were observed. In addition to this information, the presence of the sinapoyl group was revealed from the HMBC spectrum (Fig. 2). From the above results, 8 was determined as 2′-O-trans sinapoyl isovitexin. Compound 8 is a newly discovered compound, which has not yet been reported in the literature.
Table 1.
1H NMR (400 MHz) and 13C NMR (100 MHz) chemical shift (δ) for
8 in CD
3OD.
| position |
δC |
δH |
| 2 |
166.2 |
|
| 3 |
103.9 |
6.49 (1H, s) |
| 4 |
183.9 |
|
| 5 |
‡ |
|
| 6 |
107.9 |
|
| 7 |
164.8 |
|
| 8 |
95.4 |
6.46 (1H, s) |
| 9 |
158.8 |
|
| 10 |
105.0 |
|
| 1′ |
123.1 |
|
| 2′, 6′ |
129.5 |
7.77 (2H, s) |
| 3′, 5′ |
117.0 |
6.89 (2H, s) |
| 4′ |
162.8 |
|
| β-D-glucose (at C-6) |
|
|
| 1″ |
73.2 |
5.13 (1H, d, 9.6) |
| 2″ |
74.0 |
3.75 (1H, m†) |
| 3″ |
78.0 |
3.61 (1H, m†) |
| 4″ |
71.8 |
3.51 (1H, m†) |
| 5″ |
82.9 |
3.93 (1H, m†) |
| 6″a |
62.8 |
3.73 (1H, m†) |
| 6″b |
|
|
| sinapoyl (at C-2″) |
|
|
| 1‴ |
126.6 |
|
| 2‴, 6‴ |
106.8 |
6.76 (2H, s) |
| 3‴, 5‴ |
149.4 |
|
| 4‴ |
139.5 |
|
| 7‴ |
147.0 |
7.40 (1H, d, 15.6) |
| 8‴ |
115.8 |
6.17 (1H, d, 15.6) |
| 9‴ |
168.2 |
|
| 3‴, 5‴-OMe |
56.8 |
3.80 (6H, s) |
† Multiplicity was not determined due to overlapping.
‡ The signal was not detected.
Antioxidant activity All the isolates (1–11) were evaluated by the DPPH radical scavenging assay and the results are shown in Table 2. Compounds 1, 5, 10, and 11 showed significant inhibitory activity, with IC50 values of less than 100 µM. In particular, 5 (14.3 ± 1.0 µM) and 10 (15.0 ± 1.0 µM) showed stronger activity than Trolox (25.9 ± 2.9 µM). Compounds 5, 10, and 11 contained a catechol moiety in the B ring of the flavonoid, and the antioxidant activity was observed to be obviously different depending on the presence or absence of the catechol moiety in a comparison of compounds 9 and 10. Compounds with a catechol structure have been previously reported to exhibit antioxidant activity by donating H, with subsequent formation of an o-quinone structure (Sawai and Sakata, 1998).
Table 2.
Antioxidant and anti-inflammatory activities for
1–11.
| Compound |
IC50 (µM) |
| Antioxidant activity |
Anti-inflammatory activity |
| 1 |
56.9 ±4.3 |
>100 |
| 2 |
>100 |
>100 |
| 3 |
>100 |
>100 |
| 4 |
>100 |
>100 |
| 5 |
14.3 ± 1.0 |
24.1 ±4.4 |
| 6 |
>100 |
>100 |
| 7 |
>100 |
>100 |
| 8 |
>100 |
>100 |
| 9 |
>100 |
>100 |
| 10 |
15.0 ± 1.0 |
>100 |
| 11 |
70.9 ± 27.3 |
>100 |
| Positive control |
25.9 ±2.9 |
51.9±0.1 |
Each value is the mean ± standard deviation (n = 3).
Anti-inflammatory activity NO is a crucial signal transmission molecule that acts in immune and inflammatory responses as well as neuronal brain transmissions. The inhibitors of NO production have the potential to act as anti-inflammatory agents. The isolates (1–11) were evaluated using murine macrophage J774.1 cells, where NO production originates by LPS stimulation. The results are shown in Table 2. Compound 5 showed clear inhibitory effects on NO production compared to the positive control sample. Incidentally, the other compounds showed no significant inhibitory effects on NO production at 100 µM. It has previously been reported that luteolin (5) inhibits secretion of inflammatory cytokines such as IL-1β, IL-8, IL-18, and TNF-α in vivo and in vitro (Abu-Elsaad and El-Karef, 2018, Jeon et al., 2014, Kim et al., 2005). Additionally, the inhibition of NO production has been reported to provide negative feedback to TNF-α mRNA expression (Madhu et al., 2016). These reports are consistent with the presented results. Since oxidative stress is the one factor causing expression of TNF-α (Mukherjee et al., 2003), the anti-inflammatory mechanism of 5 is thought to be derived from its antioxidant activity.
An MTT assay was applied to evaluate the cytotoxicity of the isolated compounds in J774.1 cells. Although most of the evaluated isolates showed no cytotoxic effects, compound 5, which had NO inhibiting activity, showed cytotoxic effects at a concentration of 100 µM. However, the cell survival rate in the presence of 5 at 50 µM was considered reasonable, i.e., 96 %, and NO production was reduced to ≤ 20 % (Fig. 3).

Quantification analysis Quantitative analysis was performed on the antioxidant and anti-inflammatory activities of 1, 5, 10, 11, and the new compound 8. A calibration curve was prepared for each compound, and good linearity (R2 > 0.97) was obtained over the concentration range tested (1–1000 µg/mL). The hesperetin used in the addition recovery test had a recovery rate of about 80 %, which was used to correct the quantification analysis. The amounts of the compounds obtained in 1 g of pulverized wasabi flowers were determined and LOD and LOQ were calculated and are provided in Table 3. The contents of 10 and 11 were found to be over 100 µg, suggesting that these compounds are the main components of wasabi flowers. Among them, 10 had higher antioxidant activity than that of Trolox as a positive control (Table 2). Thus, it is possible that 10 is the main antioxidant component in wasabi flower. In vivo antioxidant activity of isoorientin (10), one of the main components in passion fruit leaves, has been previously reported (da Silva, 2013). For this reason, antioxidant activity is also expected as one of the qualities of wasabi flowers.
Table 3.
Contents of the active components in wasabi flower.
| Compound |
Contents (µg/g fresh weight) |
LOD (µg/mL) |
LOQ (µg/mL) |
| ferulic acid (1) |
3.4 ± 0.0 |
0.02 |
0.1 |
| luteolin (5) |
26.5 ± 4.2 |
10 |
50 |
| sinapoyl isovitexin (8) |
2.8 ± 0.1 |
0.25 |
0.5 |
| isoorientin (10) |
137.6 ± 5.6 |
0.20 |
1.0 |
| rutin (11) |
137.7 ± 1.3 |
0.20 |
1.0 |
Each value is the mean ± standard deviation (n = 3).
Luteolin (5), which indicated anti-inflammatory activity, was contained at about 25 µg in 1 g of pulverized wasabi flowers. Thus, it is difficult to attribute the whole anti-inflammatory activity of wasabi flower extracts to the contribution of 5 alone due to its low content. Presumably other active compounds are also present in wasabi flowers. Actually, we confirmed that several other fractions showed anti-inflammatory activity. Elucidation of active compounds in these fractions is in progress.