Original papers
High Sensitivity Analysis and Food Processing Stability of Rare Sugars
2019 Volume 25 Issue 6 Pages 891-901
Details
2019 Volume 25 Issue 6 Pages 891-901
To evaluate the stability of rare sugars, i.e., sorbose, allose, tagatose and allulose, in food products containing rare sugar syrup (RSS) during cooking, we developed a highly sensitive analysis method using high performance liquid chromatography (HPLC) with corona charged aerosol detector (CAD) and analyzed the rare sugars in a Maillard reaction mixture and in food products available at market. In the Maillard reaction, the amounts of each rare sugar decreased at the initial pH of 6.0. Further, the increase in allulose was accelerated in reaction mixtures at pH 7.5. The stability of rare sugars, which are added to improve food functions during food processing, was greatly influenced by the pH, temperature and heating time. Surprisingly, allulose was retained at the highest level (86.0%–88.5%) under the various cooking conditions, while the other rare sugars were obviously decreased. Therefore, it was suggested that allulose can be maintained under various manufacturing conditions, including under weakly alkaline treatment.
Rare sugar syrup (RSS), which contains a small amount of sorbose, allose, tagatose and allulose (psicose), was developed by alkaline isomerization of high-fructose corn syrup (HFCS) (Takamine et al., 2015). As a food additive, RSS can be successfully produced on a large scale and its utilization for various kinds of processed foods, such as cakes, side dishes and drinks, has spread widely in Japanese food markets (i; Takamine et al., 2016). Recently, the physiological functions of various rare sugars have been investigated. D-Allulose has been shown to prevent postprandial hyperglycemia in diabetic patients (Matsuo and Izumori, 2006) as well as induce GLP-1 release, activate vagal afferent signaling, reduce food intake, and promote glucose tolerance in healthy and obese-diabetic animal models (Iwasaki et al., 2018). Buemann et al. (2000) suggested that D-tagatose might contribute to reduced energy intake, while Oku et al. (2014) reported that D-sorbose inhibits disaccharidase activity in the brush border membrane vesicles of rat small intestines. Iida and Okuma (2013) reported on the properties and applications of D-allose, D-tagatose and D-allulose, and similar functions have been reported for RSS containing these rare sugars. For example, the syrup assisted in weight management (Hayashi et al., 2014) with its continuous consumption, and elicited a significantly lower glycemic response than sucrose in humans (Yamada et al., 2017). As a specific physiological function for RSS, Ochiai et al. (2017) recently reported that modified glucose syrup (rich in D-allulose) suppressed body weight gain, and RSS suppressed abdominal tissue weight and total fat accumulation in Wistar rats. Thus, RSS could be used as a low-calorie sweetener in place of sucrose and high-fructose corn syrup (HFCS), thereby providing an anti-obesity effect. The development and application of various processed foods with RRS functionality are highly anticipated, in addition to conventional foods. However, the composition of sugar is thought to change during the processing and cooking of foods (Martins et al., 2001) and to be susceptible to loss of function.
To evaluate the functionality and stability of rare sugars in foods, it is necessary to precisely and quantitatively analyze those sugars in foods. Evaporation light scattering detector (ELSD; Sun et al., 2014), pulsed amperometric detector (PAD; Cheng et al., 2003) and corona charged aerosol detector (CAD) are proposed as excellent candidates for high sensitivity devices. However, in the case of sugar analysis, CAD is preferable because of the following characteristics: large dynamic range, non-destructive and not reliant on UV absorbance, and is thus applicable to various kinds of food products that contain rare sugars on a microscale or large scale. Oshima et al. (2006) reported on the quantitative analysis of D-allulose in foods using PAD; however, RSS rare sugars (sorbose, allose, tagatose and allulose) in foods have not yet been reported. Meanwhile, the major rare sugars in RSS were separated using three different columns (MCI GEL CK08EC, Shodex sugar SP0810, and Asahipak NH2P-40 3E) with a RI detector (Takamine et al., 2015; Takamine et al., 2016).
In this study, to provide highly sensitive, quantitative detection of alterations in RSS rare sugars during and after food processing, the CAD device and the coupling of two HPLC columns for excellent separation of sugars were applied to determine the concentrations of rare sugars and observe changes during food processing. As a result of these analytical improvements, we evaluated the role of rare sugars in food functionality as well as their stability during food processing and in the final products.
Chemicals Rare sugar syrup (RSS; concentration of each sugar: 44.3% glucose, 31.9% fructose, 6.0% allulose and 17.8% other saccharides) (Hayashi et al., 2014) was purchased from Matsutani Chemical Industry Co., Ltd. (Hyogo). D-Sorbose, D-allose, D-tagatose and D-allulose were supplied by International Institute of Rare Sugar Research and Education, Kagawa University (Kagawa). Unless otherwise specified, all other sugars and chemicals were obtained from FUJIFILM Wako Pure Chemical Corporation (Osaka). HPLC-grade water was obtained using an RFU663 ultra-pure water system (Advantec Toyo Kaisha, Ltd., Tokyo).
Instruments HPLC analysis was performed on a Thermo Scientific Dionex UltiMate 3000 System with Corona Veo RS Charged Aerosol Detector (CAD, Thermo Fisher Scientific K.K., Tokyo) equipped with DGP-3600SD dual gradient pumps, a WPS-3000TSL in-line split loop sampler and a TCC- 3000SD column oven. Chromatographic data acquisition and system control were performed using Chromeleon 7.2 eWorkflow solution software (Thermo Fisher Scientific). The pH of each sample was determined using a compact pH meter B-212 (HORIBA, Ltd., Kyoto). The brown color intensity of Maillard reactions was measured using a U-2001 spectrophotometer (Hitachi Ltd., Tokyo) at 420 nm.
Samples and sample preparation#x00A0; Various food products containing rare sugar syrup (combustion cake, Japanese-style confection, daily dishes, seasoning and coffee beverage) were provided by Rare Sweet Co., Ltd., Kagawa. The combustion cake (biscuit) and canned coffee (coffee) were obtained as commercial items. The samples for analyses were prepared according to the method of Oshima et al. (2006) as follows: solid food products were cut into small pieces (<1 mm) and homogenized using a mini-chopping machine (Iwatani Co., Tokyo). The approx. 5-g sample was weighed in a 50-mL centrifuge tube and then 30 mL of HPLC-grade water was added. Extraction was carried out using ultrasonic treatment (SHARP UT-204; Sharp Co., Tokyo) at 10 °C for 20 min. The extract was centrifuged at 3,500 g for 5 min and filtered through qualitative filter paper No. 2 (Advantec Toyo). The residue was re-extracted twice with HPLC-grade water and then the combined supernatants were diluted to 100 mL with water.
For liquid foods, 5-g samples were diluted to 100 mL with HPLC-grade water, and n-hexane treatment was used to remove lipids from the samples.
The collected extracts were filtered through a 0.45-µm syringe filter (Advantec Tokyo), and then the extracts (5 mL) were passed through Toyopak IC-SP and DEAE-cartridges (Tosoh Co., Tokyo) and a Sep pak C18 cartridge (Waters Co., Milford, MA, USA) before their injection into the HPLC system.
HPLC analysis Separation was achieved by direct coupling of two CARBOSep CHO 882 lead form columns (7.8 mm i.d. x 300 mm, Tokyo Chemical Industry Co., Ltd., Tokyo). Elution was performed at a flow rate of 0.5 mL/min at 55 °C using ultra-pure water as eluent. The eluates from the column were mixed with acetonitrile (LC/MS grade; FUJIFILM Wako Pure Chemical) as post-column make-up flow at a 0.3 mL/min flow rate to promote volatilization of the analytical samples for high sensitivity. The CAD analysis was executed under the following operating conditions: nitrogen-gas pressure of 0.5 MPa and evaporation temperature of 35 °C.
Quantification Samples and standard sugars (20 µL, 50 mg/mL for samples and 20.0–1000 µg/mL for standard sugars) were injected into the HPLC system, and the concentrations of various sugars, such as sucrose, D-glucose, D-fructose, D-mannose, D-galactose, D-sorbitol, D-sorbose*, D-allose*, D-tagatose* and D-allulose* (*rare sugars), were quantified by comparing their retention times and peak areas with those of standard compounds. The four rare sugar standards, which were dried for 3 h at 60 °C in a vacuum dryer until constant mass was achieved, were employed to make the individual standard curves by injection with five different concentrations (20 µg/mL-1000 µg/mL). D-Galactose content in the samples was selectively determined using a lactose/ galactose assay kit (Megazyme Inc., Chicago, IL, USA) according to the method of Beutler (1988).
Recovery and reproducibility Recovery tests were performed by adding the standard rare sugar solution of D-sorbose, D-allose, D-tagatose and D-allulose (10.0 µg/mL each) to the food samples (coffee and biscuit). For biscuit, the rare sugar standards were spiked to the sample prior to homogenization. The recovery rate of standards was individually calculated after their addition to both the coffee and the biscuit as typical examples of highly colored or high-fat materials, respectively. Each sample was extracted, and the sugar contents were determined according to the method described above. The reproducibility of the method was evaluated by five successive extractions of coffee and biscuit, and the mean values and standard deviations (SD) were calculated.
Heating procedure of the Maillard reaction For the Maillard reaction, a 3-mL mixture of 10°Brix RSS and 1% glycine was placed in a 5-mL screw-cap tube under different pH conditions and heated in a block heater at 80 °C and 100 °C for 7 h and 60 min, respectively. The initial pH of the reaction mixture was adjusted using the following buffers: 0.05 M sodium acetate buffer at pH 4.0, 0.05 M sodium phosphate buffer at pH 6.0 and pH 7.5. At definite times, each tube was removed from the block heater and cooled to room temperature. After cooling, the sugar content, brown color intensity at 420 nm and final pH value of the solutions were measured using the methods described above. Finally, the mean values ± the standard deviations (SD) were calculated.
Culinary treatments of food materials In culinary treatments of the three food materials described below, foods in which RSS was substituted for a part of sucrose were tested for the stability of rare sugars in processed foods. 1) Sponge cake was prepared as follows: Egg white (160 g) was whipped using a hand mixer (THM26; Tescom Denki Co., Ltd., Tokyo). Next, sucrose (100 g) and RSS (20 g), and egg yolk (80 g) were added in a stepwise manner, and then wheat flour (100 g) was added to the combined mixture. The resulting cake batter was placed in a coated cake mold and baked at 180 °C in a steam convection oven (MIC-6SA3-1; HOSHIZAKI Co., Tokyo) for 20 min. 2) Pudding was treated as follows: Full egg (240 g), milk (400 mL), sucrose (80 g), and RSS (20 g) were placed in a bowl and mixed using a hand mixer THM26, and then the mixture was poured into aluminum cups (about 130 mL each). The filled cups were covered with aluminum foil and steamed in a food steamer with a low flame for 20 min. 3) Steamed bread was prepared as follows: wheat flour (200 g), sodium bicarbonate (baking soda; 4 g), sucrose (50 g), RSS (10 g) and tap water (170 mL) were placed in a bowl and mixed. The prepared bread batter was placed in aluminum cups (about 60 mL each) and steamed in a food steamer with a low flame for 10 min. Determinations of each sugar content of the cooked food products were carried out in triplicate and the mean values ± the standard deviations (SD) were calculated.
Separation of rare sugars by HPLC Takamine et al. (2015) reported good separation of allulose and sorbose using a Shodex SUGAR SP0810 column, and of allulose, tagatose, allose, and mannose using an Asahipak NH2P-40 3E column. Additionally, Chung et al. (2018) developed a prototype hydrophilic interaction liquid chromatography (HILIC) column packed with polyethyleneimine-attached resin, and reported an analytical method for the discrimination of sugars (D-xylose, D-allose, D-glucose, D-fructose, D-psicose, D-sorbose and D-tagatose). However, excellent separation of various kinds of monosaccharides is very difficult with direct analysis using an HPLC system. Specifically, it is necessary for the HILIC method to change the ion pair reagent levels according to sugar concentrations, complicating the operation. In this paper, HPLC separation of 10 monosaccharides including 4 rare sugars was successfully achieved by direct coupling of two CARBOSep CHO 882 lead form columns (Fig. 1). The resolution factor (Rs) between D-allose and D-tagatose, and D-sorbitol and D-allulose was 1.2 and 1.6, respectively. Good separation of these two sets of sugars was achieved; however, D-sorbose and D-galactose overlapped completely at the same retention time. As D-galactose is present in food products as simple sugars and complex carbohydrates, such as lactose in milk (Rajendran and Irudayaraj, 2002) and oligosaccharides (i.e., raffinose, stachyose) and polysaccharides in soybean (Ikuta et al., 1994; Kawamura, 1967), detection of D-galactose is important to determine the composition of food ingredients. Thus, we developed a new method to quantify the amount of D-galactose in mixtures of D-galactose and D-sorbose in foods by means of an enzymatic reaction specific for D-galactose (Megazyme lactose/galactose assay kit, Beutler, 1988). According to the kit manual, the detection limit (DL) is 1.48 µg of D-galactose per 1 mL of sample solution, which was equivalent to the DL of each sugar analyzed by the HPLC-corona CAD (Table 1). In duplicate determinations using one sample solution, D-galactose concentrations of an approx. range of 0.37 to 0.74 µg/mL of the sample solution may occur. Therefore, in our sample preparation, a difference of 0.7 to 1.48 mg of D-galactose per 100 g of sample could be expected. From this, the kit was shown to have higher accuracy than the HPLC analysis.

Chromatogram of 10 standard sugars.
Standard sugar solution (20 µL) containing 2 µg each sugar was injected into the HPLC system. Resolution factor (Rs) of D-allose and D-tagatose was 1.2. Chromatographic conditions: column, CARBOSep CHO-882 (7.8 mm i.d. x 300 mm) x 2; column temperature, 55 °C; eluent, water; flow rate, 0.5 mL/min; detector, Corona Veo
| QLa) (µg/mL) [RSD (%)] | DLb) (µg/mL) [S/N] | Regression equationc) (range; µg/mL) | Correlation coefficient (R2) | |
|---|---|---|---|---|
| D-Sorbose | 3.003 [3.8] | 1.001 [4.3] | y=0.1387x2+9.5847x−0.4148 (3.0–1001.1) | 0.9998 |
| D-Allose | 9.004 [2.2] | 3.001 [3.2] | y=0.0562x2+7.3713x+3.0812 (9.0–1000.4) | 0.9998 |
| D-Tagatose | 16.021 [2.9] | 4.005 [3.3] | y=0.2534x2+13.8445x+7.0806 (16.0–1001.3) | 0.9997 |
| D-Allulose | 9.005 [3.6] | 4.002 [3.7] | y=0.0834x2+8.2270x+6.3079 (9.0–1000.6) | 0.9996 |
Each value is presented as means RSD (relative standard deviation) of 5 samples.
After quantification of D-galactose content by the enzyme method, D-sorbose content in the food product can be calculated by subtracting the amount of D-galactose from the total amount of D-sorbose and D-galactose, as determined by HPLC analysis. This is because D-sorbose and D-galactose each showed the same detection characteristics by the HPLC analysis.
Therefore, the dual column system and enzymatic detection of D-galactose applied here expanded the possibility for future quantification of many monosaccharides in natural and processed foods, including the four rare sugars (i.e., D-sorbose, D-allose, D-tagatose and D-allulose) in RSS successfully analyzed herein.
Determination of quantification limits and calibration curves The quantification limits (QL) and DL of rare sugars in RSS were defined based on Currie (1968). QL of D-sorbose, D-allose, D-tagatose and D-allulose (n=5) were 3.0, 9.0, 16.0, and 9.0 µg/mL, respectively (Table 1). QL of D-tagatose was the highest among the four rare sugars under the analytical conditions. We propose that the high QL of D-tagatose means instability in the column during analysis, attributable to chelate formation with lead ions adsorbed in the column (Scott, 1992). The upper limit of the QL value was set at ca. 1000 µg/mL in terms of the capacity of the CAD detector. Within the QL ranges of the four sugars, calibration curves of each sugar showed a good exponential curve fitting with a high correlation coefficient (R2) (>0.9996). The HPLC method for allulose detection in foods using a PAD detector has been reported to show good detection with high sensitivity (Oshima et al., 2006). The upper and lower QL values of D-allulose using the PAD method were determined to be 5.0 and 150.1 µg/mL. Consequently, the CAD method applied here (9.0–1000 µg/mL) has a wider range than the PAD method in detection limitation. The overall conclusion in quantification of rare sugars indicates that the CAD method is suitable for rare sugar analyses in foods with quite low QL values (3.0–16.0 µg/mL), as shown in Table 1.
Evaluation of the recovery and reproducibility of additional rare sugars Although the HPLC analysis, and QL and DL determinations described above were conducted using four rare sugar chemicals in a single solvent, rare sugar detection in natural foods, which contain a more heterogeneous matrix as well as ingredients such as carbohydrates, fats, proteins, coloring materials, flavor substances and so on, must be evaluated carefully, since the matrix and ingredients may interfere with detection and change the QL and DL values. Therefore, rare sugar contents in coffee and biscuit, which were selected as typical food samples for a dark brown colored food and a high oil content food, were determined and the expanded application of the CAD method can be demonstrated.
Despite the color and high lipid content, the recovery of four rare sugars from coffee and biscuit samples was 97.1–108.9% for coffee and 91.4–106.5% for biscuit, as shown in Table 2. The relative standard deviation (RSD) of the reproducibility of each rare sugar was 0.2–2.1% and 0.1–3.9% for coffee and biscuit samples, respectively. Oshima et al. (2006) reported the recovery of allulose from coffee and corn-snack was 96.6% and 96.7%, respectively. Our results showed high recovery and reproducibility equivalent to that reported by Oshima et al. (2006). Recovery yield and reproducibility of four rare sugars in a wide range of concentrations using the CAD method could ensure analytical reliability and sensitivity, as the former analytical method was established using the PAD detector (Oshima et al., 2006) with the additional merit of analytical concentration range.
| Coffee | Biscuit | |||||||
|---|---|---|---|---|---|---|---|---|
| Sugar | Added | Found | Recovery | RSD | Added | Found | Recovery | RSD |
| (µg/mL) | (%) | (µg/g) | (%) | |||||
| D-Sorbose | 25.0 | 24.3 | 97.1 | 2.1 | 25.0 | 22.8 | 91.4 | 3.9 |
| D-Allose | 25.0 | 25.2 | 100.6 | 0.2 | 25.0 | 26.3 | 105.2 | 0.2 |
| D-Tagatose | 25.0 | 24.5 | 98.0 | 0.1 | 25.0 | 26.6 | 106.5 | 0.1 |
| D-Allulose | 25.0 | 27.2 | 108.9 | 0.2 | 25.0 | 26.4 | 105.4 | 0.2 |
Coffee and biscuit were diluted to twenty folds with water, respectively. Each value is presented as meanRSD of 5 samples.
Analysis of rare sugar contents in various food products containing RSS Twelve food products containing RSS were analyzed for rare sugars (sorbose, allose, tagatose and allulose). Figure 2 shows a typical HPLC chromatogram of a sponge cake containing RSS, and Table 3 summarizes the contents of the rare sugars in twelve food products. Sucrose, glucose, and fructose were the main sugars in the processed foods containing the RSS and four rare sugars. The rare sugar component in RSS was 13.1% by dry weight, and the ratio of rare sugars: sorbose, allose, tagatose and allulose is authorized to be 37:11:14:38 on average (Yamada et al., 2017). Figure 2 shows the presence of sorbitol, and the four rare sugars in food products showed excellent separation largely without interference with one another. The contents of rare sugars in various foods could be quantified with 5% RSD or lower values, except for madeleine (marron). In analyses of soybean products or soybean seasoning products such as soy sauce, D-galactose was detected together with other sugars. Enzymatic detection of D-galactose in foods separate from sorbose was successfully accomplished in tsukudani, coffee syrup and extra virgin olive dressing, as shown in Table 3. Besides, the RSD levels of D-galactose content in various foods were in the range of 2.84–6.98%. Although the RSD values were somewhat greater than those of the other eleven foods, the reproducibility of enzymatic detection is reasonable and acceptable for D-galactose quantification.
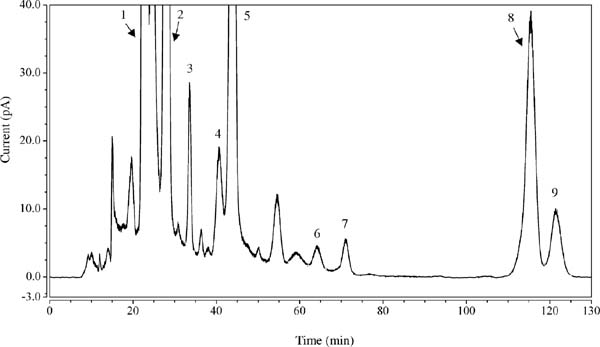
Separation of four rare sugars in RSS extracted from a sponge cake extract.
1, sucrose; 2, glucose; 3, sorbose; 4, mannose; 5, fructose; 6, allose; 7, tagatose; 8, sorbitol; 9,allulose Chromatographic condition and sample preparation procedure are described in the text.
| Sorbose | Allose | Tagatose | Allulose | Galactose a) | Ratio of Allulose/Allose | |
|---|---|---|---|---|---|---|
| (mg/100g) [RSD] | ||||||
| Dnut | 157.5 [1.05] | 41.5 [1.21] | 34.2 [0.63] | 178.3 [1.27] | n.d. b) | 4.3 |
| Orange-cake | 199.1 [2.47] | 27.1 [3.18] | 64.7 [4.53] | 144.5 [1.72] | n.d. | 5.3 |
| Madeleine (Sweet-potato) | 162.6 [1.05] | 67.4 [3.56] | 74.4 [1.44] | 279.9 [0.06] | n.d. | 4.2 |
| Madeleine (Apricot) | 146.7 [1.58] | 66.6 [0.42] | 67.4 [2.13] | 269.0 [0.55] | n.d. | 4.0 |
| Madeleine (Maron) | 140.5 [0.55] | 61.4 [1.47] | 60.8 [0.32] | 258.9 [5.06] | n.d. | 4.2 |
| Syouyu-mame (Black beans) | 180.0 [2.07] | 51.3 [0.78] | 45.5 [0.03] | 230.4 [1.70] | n.d. | 4.5 |
| Syouyu-mame (Broad beans) | 158.0 [2.26] | 49.3 [2.75] | 42.2 [2.67] | 212.3 [0.42] | n.d. | 4.3 |
| Yo-kan (Salt taste) | 220.8 [3.12] | 89.3 [1.98] | 77.3 [2.25] | 276.0 [4.60] | n.d. | 3.1 |
| Yo-kan(Green tea taste) | 212.4 [1.84] | 78.0 [1.94] | 69.9 [3.86] | 273.5 [2.30] | n.d. | 3.5 |
| Tsukudani | 942.5 c) | 293.2 [1.54] | 468.7 [2.96] | 1980.4 [4.21] | 165.3 [6.98] | 6.8 |
| Extra virgin olie dressingd) | 403.2 c) | 188.8 [0.79] | 142.1 [1.50] | 927.4 [2.05] | 190.0 [2.84] | 4.9 |
| Coffee syrupd) | 691.6 c) | 321.3 [2.48] | 202.0 [4.27] | 860.3 [1.85] | 51.6 [3.69] | 2.7 |
Each value is presented as mean RSD of 3 samples.
The allulose/allose ratio of RSS was originally reported to be 3.5 (Yamada et al., 2017); however, the ratio for tsukudani, orange-cake and extra-virgin olive dressing was 6.8, 5.3 and 4.9, respectively. The different ratios may be attributed to the decomposition of some sugars under different cooking methods for the various dishes. This ratio can be an indicator of different thermal and pH treatments of processed foods containing RSS. Thus, the allulose/allose ratio of processed foods should be monitored carefully, and indicates the importance of the ratio for different thermal and pH conditions in proper modeling of stew preparation.
Stability of rare sugars in RSS during the Maillard reaction The Maillard reaction is influenced by many factors, such as temperature, pH, water activity and types of reactants (Martins et al., 2001). Various researchers reported that sugar type is a major factor related to reaction rates and pathways (Ajandouz et al., 2001; Reyes et al., 1982; Cho et al., 2010). Especially, Laroque et al. (2008) reported that hydroxyl group configuration in the sugar is important for sugar reactivity in the Maillard reaction; the position of hydroxyl groups in the sugar destabilizes the structure and forces it open. Additionally, Dills (1993) reported that the initial stages of the Maillard reaction, which involves the formation of reactive intermediates and cross-linking of proteins, occur more rapidly with fructose than with glucose, because fructose exists in the open-chain form to a greater extent compared to glucose. In this context, the four kinds of rare sugars in RSS each differed in chemical structure. Oshima et al. (2014a) reported that D-allulose (psicose) degradation occurred at elevated temperatures and pHs, and D-allulose loss can be regulated by controlling the temperature and pH under flexible cooking conditions. However, the stability of the four rare sugars in RSS has not previously been studied in detail, except for D-allulose. Therefore, the effects of temperature and pH conditions on the stability of rare sugars in RSS were investigated in this paper (Fig. 3). The effect of pH on the stability of a 10°Brix RSS and 1% glycine mixture during Maillard reaction was examined at 80 °C for 7 h as a model condition for stew preparation. The initial pH of the reaction mixture was adjusted to 4.0, 6.0 and 7.5 as typical pHs for jams, ramen noodles and other processed foods. The brown color intensity increased linearly at 420 nm in each reaction mixture. Seven hours later, the color intensity at pH 7.5 was 25 times and 4.5 times greater than that at pH 4.0 and pH 6.0, respectively. At 7.5, the initial pH of the reaction mixture gradually decreased to pH 6.5 during the Maillard reaction for 7 h, whereas the Maillard reaction of pH 4.0 and pH 6.0 buffers did not change each sugar concentration substantially under the reaction period (Fig. 3A). At pH 4.0, the initial concentration of the four rare sugars hardly changed under the reaction process (Fig. 3B). On the other hand, at pH 6.0, each rare sugar content gradually decreased and was significantly different (*p<0.05 and **p<0.01) compared with the concentration at 0 h (Fig. 3C). The concentration of allulose at pH 7.5 declined to 89.1% after incubation at 80 °C for 7 h, however, the final allulose content was not significantly different from the initial concentration (Fig. 3D). All four rare sugars showed significant differences at pH 6.0 during the Maillard reaction; however, at pH 7.5, a significant difference was observed only for sorbose at 7 h. It is possible that glucose, fructose and mannose in RSS may to some extent transform rare sugars at pH 7.5 during processing, via Lobry de Bruyn-Alberda van Ekenstein rearrangement (Speck, 1958) or through a route like the Izumoring (Granström et al., 2004), which was reported as an alkali isomerization reaction via non-enzymatic reaction. Under this condition, it was thought that the sugars in RSS were in an equilibrium state with each other. Therefore, the variance of concentration of allulose in the reaction mixture increased with increases in the initial pH condition of the reaction mixture (Fig. 3B, Fig. 3C and Fig. 3D). Oshima et al. (2014b) reported that the pH of foods is the most important factor for allulose formation from fructose, and reported that D-allulose (psicose) degradation occurs at elevated temperature and pH (Oshima et al., 2014a). In Figure 3D, the concentration of allulose did not change remarkably at pH 7.5. Moreover, Fig. 3C showed the decrease of each rare sugar content in the RSS-glycine mixture under a pH 6 condition. From the above results, each rare sugar decreased at an initial pH of 6.0; however, the generation of allulose was also confirmed in reaction solutions at pH 7.5 for the mixture during the reaction process.

The effect of pH on the stability of four rare sugars during the Maillard reaction (80 °C).
A reaction mixture of 10°Brix RSS and 1% glycine was adjusted to initial pH values of 4.0, 6.0, and 7.5 respectively, and heated at 80 °C for 7 h. Each value is presented as mean ± SD of 3 samples.
(A) Browing and pH at pH 4.0 ( ,×), pH6.0 (
 ,○), pH 7.5 (,
 ,□); (B) Reaction condition at pH 4.0; (C) Reaction condition at pH 6.0; (D) Reaction condition at pH 7.5. ●, allulose; △, sorbose; ×, tagatose; ○, allose.
Values not sharing an asterisk are significantly different against 0 h sample solution by Student's t-test. *p<0.05 **p<0.01
To understand the stability of rare sugars in sterilized foods and confectioneries such as sponge cake and pie, the effect of pH on the stability of a 10°Brix RSS and 1% glycine mixture during the Maillard reaction was examined at 100 °C for 60 min. The initial pH of the Maillard reaction was set at 4.0, 6.0 and 7.5, as with the previous session during culinary treatment (Fig. 4). The brown color intensity at pH 7.5 was much greater than that of the other tested pHs after 60 min. After Maillard reaction for one hour, the brown color intensity at an initial pH of 7.5 was 42 times and 6.5 times greater than that at pH 4.0 and pH 6.0. The initial pH value at pH 7.5 changed to pH 7.0 after 60-min reaction under sterilization conditions; however, the initial pH values of 6.0 and 4.0 at 100 °C barely changed during the process (Fig. 4A). The concentrations of the four rare sugars at pH 4.0, pH 6.0 and pH 7.5 did not change during the Maillard reaction, except for the contents of allulose and sorbose at pH 7.5 for 60 min (Fig. 4B, Fig. 4C and Fig. 4D). In other words, concentrations of allulose and sorbose declined to 91.3% and 88.6%, respectively, with the reaction mixture at pH 7.5 and 100 °C for 1 h. Even though the sterilization condition at pH 7.5 and 100 °C for 1 h is severe, ca. 90% of allulose and sorbose remained. It was suggested that the four kinds of rare sugars in RSS are mostly stable under normal culinary and manufacturing conditions (at 100 °C and < pH 7.5).

The effect of pH on the stability of four rare sugars during the Maillard reaction (100 °C).
A reaction mixture of 10°Brix RSS and 1% glycine was adjusted to intial pH values of 4.0, 6.0, and 7.5 respectively, and heated at 100 °C for 60 min. Each value is presented as mean ± SD of 3 samples.
(A) Browing and pH at pH 4.0 ( ,×), pH 6.0 (
 , ○), pH 7.5 (
 , □); (B) Reaction condition at pH 4.0; (C) Reaction condition at pH 6.0; D, Reaction condition at pH 7.5. ●, allulose; △, sorbose; ×, tagatose; ◛, allose.
Values not sharing an asterisk are significantly different against 0 min sample by Student's t-test. *p<0.05
Stability of rare sugars during food processing As a result of the model experiment described above, we were able to observe the trend in the stability of rare sugars under cooking conditions (i.e., pH, temperature); however, the stability of rare sugars in food products containing RSS differs greatly from that of the model reaction. Therefore, evaluation of the stability of rare sugars in general foods is indispensable for the measurement of rare sugar contents in cooked foods under various cooking conditions. Particularly, home-cooked confectioneries (sponge cake and steamed bread) and soft fresh sweets (pudding) were investigated, since the stability of rare sugars before and after cooking (Fig. 5) can be analyzed by HPLC. These prepared foods are some of the items that contain RSS as a raw material.

Change of the various sugar contents of foods before and after cooking culinary treatment.
(A) and (a) Sponge cake; (B) and (b) Pudding; (C) and (c) Steamed bread. Each value is presented as mean ± SD of 3 samples.  , Raw material;
  , Product. Values not sharing an asterisk are significantly different by Student's t-test. **p<0.01, *p<0.05
In sponge cake, the concentration of the rare sugars sorbose, allose, tagatose and allulose decreased to 85.0%, 86.4%, 82.9% and 88.5%, respectively, compared to levels in the dough (Fig. 5). On the other hand, the content of glucose, fructose and mannose in the sponge cake was 91.4%, 93.3% and 91.0%, respectively (Fig. 5a and Fig. 5A). However, there were no significant differences in the four rare sugar contents before and after cooking. Although the baking temperature of the cake was 180 °C, the interior temperature of the cake should be 100 °C during the cooking process. Thus, high stability of the four rare sugars was observed. Regarding changes in pH, the pH of the sponge cake decreased slightly from pH 7.6 to pH 7.3 during cooking, indicating that the rare and natural sugars are likely to be hardly decreased in the cake.
With respect to the pudding, the concentration of rare sugars, sorbose, allose, tagatose and allulose, was decreased to 39.4%, 72.1%, 65.5% and 86.0%, respectively. Additionally, glucose, fructose and mannose contents were 41.3%, 43.7% and 55.7%, respectively (Fig. 5b and Fig. 5B). In HPLC analysis, the rare sugars in the pudding product had a small RSD range (5.1–7.5%), except for sorbose (RSD 21.0%); however, the raw materials before production of the pudding product showed a high RSD value (14.2–33.4%). We assumed that proteins in the egg and milk interfered with the quantification of sugars by HPLC analyses. The pH of the pudding was pH 7.5, similar to that of sponge cake, and did not change during cooking. The interior temperature of the pudding was 92.1 °C. Under these conditions, the rare sugar concentrations during cooking of pudding were decreased. We expected that the rare sugars might contribute to the Maillard reaction with proteins in the raw pudding materials during cooking.
In the steamed bread, the rare sugar concentrations of sorbose, allose, tagatose and allulose were decreased to 53.2%, 57.1%, 69.4% and 86.0%, respectively. Additionally, glucose, fructose and mannose contents were 47.2%, 50.2% and 67.1%, respectively (Fig. 5c and Fig. 5C). Significant differences (*p<0.05 and **p<0.01) were observed in rare sugars (allose and tagatose) and natural sugars (glucose, fructose and mannose) before and after the preparation of steamed bread. The pH of the steamed bread changed from pH 8.7 to pH 9.2 during cooking, due to baking soda normally being added to the food products during the manufacturing process, and the interior temperature of the steamed bread was 80.1 °C.
The four rare sugars in the three home-cooked foods were commonly decreased by large values or a wide range compared to some model samples for the Maillard reaction. Allulose showed the greatest retention at 86.0%–88.5% under the three cooking conditions. Allulose was the most stable rare sugar among the four rare sugars in RSS. As mentioned above, home-cooked products have a complex matrix, and differ in their physicochemical properties, the thickness of the food materials and so on. Thus, it is difficult to infer the stabilities of rare sugars because of sample complexity. Therefore, we propose that the stability of rare sugars in RSS should be determined individually by HPLC analysis.
We measured the contents of rare sugars in various food products containing RSS by means of a highly sensitive sugar detector (CAD) with the HPLC analytical system. Direct coupling of two CARBOSep CHO 882 columns enabled very good separation of 10 monosaccharides. The recovery yield and reproducibility of the four rare sugars over a wide concentration range using the CAD method could be established with high analytical reliability and sensitivity. As a result, the composition of the rare sugars was determined and differences in composition were observed compared to RSS. As the stability of rare sugars in processed foods is affected by cooking, we assessed temperature, pH and time using a mixture of RSS and glycine as a model of the Maillard reaction in cooking processes and confirmed the stability of rare sugars in RSS. Each rare sugar decreased at the initial pH of 6.0 in a model experiment; whereas, the generation of allulose was confirmed in reaction solutions at pH 7.5. Finally, we applied the stability test to cooked confectioneries containing RSS. As a result, the combination of pH and temperature, and cooking time and raw materials influenced the composition and stability of the rare sugars. Allulose, which is known to have physiological health functions, was found to be the most stable rare sugar among the four rare sugars in RSS.
This is the first study to precisely quantify the four rare sugars in RSS added to various commercially-available processed foods as well as to evaluate their stability in various cooked products.
Acknowledgements We wish to thank Prof. Hirotoshi Tamura (Faculty of Agriculture, Kagawa University) for comments on this paper.