Abstract
Steviol glycosides are found in the leaves of Stevia rebaudiana Bertoni plants and have been used as natural, high-intensity sweeteners. Rebaudioside D (RebD) is a steviol glycoside derivative that has a similar sweetening profile to that of sugar; however, it is poorly soluble in water. Therefore, in this study, polymorphs of RebD showing greater solubility were investigated. We identified at least two novel polymorphs using differential scanning calorimetry (DSC) and X-ray diffractometry (XRD). We identified the transition to one polymorphic form of RebD (named “form α”) by desolvation at about 50 °C, and the other (named “form β”) at about 70 °C. Both forms exhibited greater water solubility compared to untreated RebD. This is the first report of RebD polymorphs with improved solubility, which may contribute to the production of RebD with both a sugar-like taste profile and high-solubility property.
Introduction
In recent years, the health consciousness of consumers (related to obesity, diabetes, and cardiovascular diseases) has increased globally. Sugar is one of the causes of obesity, and the World Health Organization (WHO) recommends reducing free-sugar intake to less than 10% of total energy intake (WHO, 2015). In addition, the movement toward introducing sugar taxes has gained traction in various countries. Thus, alternative non-caloric sweeteners to replace sugar are in high demand these days.
Stevia rebaudiana Bertoni (stevia) is a sweet herb that is native to Paraguay. Its leaves have historically been used as a sweet herbal tea and its purified product has been commercialized as a non-caloric sweetener. Many components related to the sweet taste, which are called steviol glycosides, are contained in the leaves of stevia plants (Geuns, 2003; Ohta et al., 2010). All steviol glycosides contain ent-kaurene diterpenoid aglycone as a basic structure —known as steviol— and each steviol glycoside is distinguished by the number and type of sugar added to it. Rebaudioside B is composed only of glucose, whereas rebaudioside C includes rhamnose and rebaudioside F xylose. Among steviol glycosides, rebaudioside A (RebA) and stevioside, which also have a sweet taste, are contained in high amounts in leaves and have been used commercially as natural, high-intensity sweeteners. However, these two components have an unpleasant after-taste, especially lingering sweet and bitter tastes (Hellfritsch et al., 2012).
Rebaudioside D (RebD) is also a steviol glycoside derivative, and it has been reported to have a good sweetening profile, similar to that of sugar (Pang et al., 2015; Upreti et al., 2011). However, RebD exhibits low solubility in water compared to RebA. In the drink-manufacturing industry, a concentrated beverage —called syrup— is generally prepared, which is then diluted with water to obtain the final product. However, it is not possible to add sufficient amounts of RebD to the syrup for optimal sweetness intensity due to its low solubility. Thus, it is vital to consider the solubility of the final products in concentrated liquids.
Several methods to improve the solubility of RebD have been reported. In a previous paper, a physical mixture of RebD with γ-cyclodextrin was shown to enhance the solubility of RebD (Upreti et al., 2011). Potassium sorbate can contribute to enhance the solubility of RebD to approximately 4,000 ppm in water at 20 °C, an approximately ten-fold increase. The surface area of crystalline RebD was increased by the combination with potassium sorbate (Pang et al., 2015). This means that the increased surface area can increase the interaction with water. Other reports demonstrated that the combination of RebD with other components derived from stevia is an effective method to enhance the solubility of RebD. For example, the solubility of RebD was enhanced by mixing with RebA and RebB (Purkayastha et al., 2016). Another report demonstrated that RebD mixed with a non-glycoside fraction purified from stevia extract showed improved solubility (Markosyan et al., 2017).
In the pharmaceutical industry, enhancing the solubility of active pharmaceutical ingredients is also an important challenge in the context of greater bioavailability. Thus, many studies have been dedicated to this subject for decades (Leuner and Dressman, 2000). Methods consisting of the combination with other components, such as solubilizers, have also been reported, as is the case for RebD (Saravana et al., 2013; Challa et al., 2005). Other researchers reported on the fabrication of co-crystals, which are solid materials composed of two or more different molecules (Shiraki et al., 2008; Nishimaru et al., 2017). Recently, more attention has been paid to polymorphs, which are defined as crystalline particles that have the same chemical structure as the original, but with different molecular arrangements in the crystal lattice. Polymorphic crystalline particles not only affect the solubility and bioavailability but also the chemical and physical stabilities of the materials. Therefore, several investigations on the development of methods to control the formation of polymorphs have been carried out (Kitamura and Sugimoto, 2003; Hao et al., 2012; Censi and Martino, 2015).
The aim of the present study is to characterize novel polymorphic forms of RebD and evaluate their solubility in water. We confirmed at least two polymorphs (forms α and β) with differential scanning calorimetry (DSC) and X-ray diffraction (XRD) experiments, and developed a successful preparation method involving a drying process. This may contribute to the supply of healthful and tasty beverages to consumers, as no other components besides RebD are added. Furthermore, we confirmed the improvement in the aqueous solubility of RebD polymorphs compared to untreated RebD.
Materials and Methods
Sample preparation RebD was obtained by purification from stevia leaf extracts containing RebD (Ohta et al., 2010). Purification was performed using an ion exchange resin and synthetic adsorbent to remove any impurities. After powdering of the eluate, the powder and 90% ethanol were used for cooling crystallization to obtain RebD with high purity. To confirm several RebD polymorphs by XRD, RebD samples were obtained from Jining Renewal & Joint International, China; Qufu Xiangzhou, China; Layn, China; GLG lifetech, Canada; and Lovpure Natural, China. For all samples, the purity of RebD (dry weight) was more than 95%.
The method to produce polymorphic crystalline particles of RebD (forms α and β) was as follows: Form α was made by drying the sample for about 1 hour after keeping it at 50 °C under flowing nitrogen. Form β was made by drying for about 1.5 hour at 100 °C under flowing nitrogen. After drying, each sample was cooled down to ambient temperature (about 25 °C) and used in the trials.
Transformation analysis of RebD polymorphs Simultaneous DSC and XRD (Thermo Plus2 system XRD-DSC III, Rigaku Corp., Japan) analyses were performed to confirm changes in the crystal structure. DSC experiments were carried out to measure the phase change by endothermic or exothermic reactions through an elevated-temperature process (temperature range: ambient temperature to 300 °C; rate of temperature increase: 2 K/min; nitrogen flow rate: 100 mL/min; sample pan material: aluminum sealed pans).
Changes in the crystal lattice were monitored by XRD at each temperature, monitored by DSC (ULTIMA IV, Rigaku Corp., Japan; at 40 kV, 40 mA and a scanning rate of 5°/min over the range: 2θ = 5°–35° using Cu Kα radiation of wavelength 0.15405 nm at temperatures between ambient and 300 °C).
Imaging of RebD crystals Scanning electron microscopy (SEM) studies were performed to observe the crystal structure. The samples were attached to double-sided conductive tape and fixed on a mount. Dry samples were coated with gold to reduce the charge effect. The prepared samples were analyzed using a JSM-6510 microscope (JEOL Ltd., Japan) with an accelerated voltage of 10 to 15 kV.
Water content of crystalline RebD particles A thermogravimetric analyzer (TGA) was used to analyze mass changes in the samples. After weighing the RebD sample, it was set in the instrument (TGA-50, Shimadzu Corp., Japan) and mass changes were monitored upon increasing the temperature from room temperature to four different heating temperatures (i.e., 50, 60, 70, and 80 °C) at a rate of 2 °C/min. A nitrogen purge was used as the inert gas to flush through the TGA furnace (purge rate: 50 mL /min).
The Karl Fisher method was applied to measure the water content in the sample. A sample that was weighed in advance was put on a glass tray and set on the VA200 vaporizer (Mitsubishi Chemical Analytec Co., Ltd., Japan). The water contained in the sample was evaporated in flowing nitrogen (130 °C, 300 mL/min). The water evaporated from the sample using the VA200 apparatus was then carried to a CA200 coulometric moisture meter (Mitsubishi Chemical Analytec Co., Ltd.) for analysis. Aquamicron AX and Aquamicron CXU (Mitsubishi Chemical Analytec Co., Ltd.) were used as the reaction solution with water for each anolyte and catholyte, which were packed in CA200. The amount of electricity generated by the reaction was detected to calculate the water content.
Solubility measurement A RebD powder was suspended in water until an over-saturated mixture was obtained, and then agitated at 200 rpm after the pure water (100 mL) was cooled down to 7.5 or 10 °C using a thermostatically controlled bath. After agitation for a certain period of time, the suspension was sampled and filtered with a membrane filter (Omnipore PTFE membrane filter, 0.45 µm, Merck KGaA). The RebD concentration dissolved in the permeate was measured by liquid chromatography–mass spectrometry (LCMS). The same procedure was repeated using the other samples.
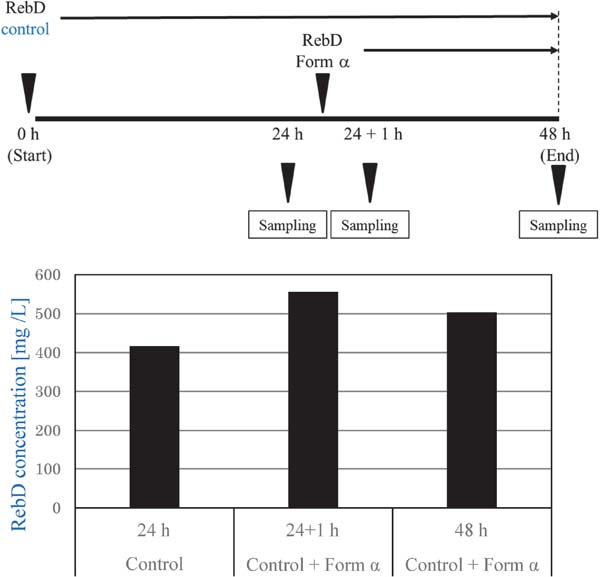
Additional experiments, in which form α was added to a suspended liquid that was already saturated with untreated RebD, were carried out to confirm the effect of form α on the solubility enhancement of RebD. In detail: the untreated RebD powder was suspended in an over-saturated solution in water, agitating at 200 rpm after the pure water (100 mL) reached 7.5 °C using a thermostatically controlled bath. Part of the suspension was sampled after 24 h of agitation, and form α was added to the suspension in which untreated RebD powder had already been dissolved. Part of the suspension was sampled 1 and 24 h after adding form α. All the samples were filtered using a 0.45 µm membrane filter and then analyzed to determine the quantity of soluble RebD in the permeate.
Quantification of RebD The quantity of RebD in the permeate was analyzed by LCMS (column: Shim-pack XR-ODS II (2.0 mm i.d., 150 mm, Shimazu Corp., Japan); mobile phase: 30% acetonitrile/70% Milli-Q including 0.1% formic acid; flow rate: 0.34 mL/min) using an electronic detection system (LCMS-8050, Shimadzu Corp.) operated at ambient temperature. Quantification of RebD was carried out using a standard calibration curve.
Results and Discussion
Evaluation of RebD solubility compared to RebA The chemical structures of RebA and RebD are shown in Fig. 1. Both have a common ent-kaurene diterpenoid aglycone basic structure, but differ in the number of glucose units conjugated at the C19 position. The results of the solubility measurements of RebA and RebD are shown in Fig. 2. Since the difference in the solubilities of the two components was very large, the solubility curve was presented as a van't Hoff plot. This figure indicates that RebD has a lower aqueous solubility compared to RebA. It has been reported that RebD generally exhibits a sweetening intensity that is 250 to 350 times greater than that of sucrose. Therefore, the sucrose equivalent value (SEV) is 11.0 to 15.4 at 10 °C. On a production scale, a highly concentrated syrup is prepared and blended with a large amount of water to obtain the final product; for example, in the case of using a five-fold concentrated syrup, an approx. 55 to 77 SEV syrup is needed. However, RebD does not impart sufficient sweetness to the syrup due to its low solubility, whereas RebA has 200 to 300 times higher intensity (Prakash et al., 2008). Thus, it has sufficient sweetness, even for a syrup, because of its high aqueous solubility.


Confirmation of RebD polymorphs by XRD and DSC measurements Results of the simultaneous XRD and DSC analyses are shown in Fig. 3. The XRD peak patterns displayed on the left-hand side of the figure show that at least two pattern shifts occurred from the ambient temperature to about 300 °C, and it was found that RebD was degraded to RebB at temperatures above about 250 °C (data not shown). Especially, a 2θ shift at a low angle was significantly marked. One shift change occurred at about 50 °C, shifted to 2θ = 6.7 ± 0.2 deg (named form α) and another one drastically occurred at about 70 °C, shifted to 2θ = 5.9 ± 0.2 deg and 2θ = 7.3 ± 0.2 deg (named form β). The DSC curve displayed on the right-hand side of the figure also indicates that there is an endothermic peak at the temperature at which the pattern shift was observed in the XRD experiments. This is a reasonable observation, as in this measurement no melting occurred, but there was solid-solid phase transformation.

Features of RebD polymorphs Fig. 4 shows the XRD peak patterns of crystalline RebD particles obtained by the drying method (see the Materials and Methods section). It was confirmed that the crystalline particles obtained by the drying method were polymorphic RebD having the specific peaks mentioned in Fig. 3.
A TGA analysis was performed to investigate the changes in RebD crystalline particles at the transition temperature shown in Fig. 3. A reduction in the weight (on a dry basis) of particles processed at each temperature of 50, 60, 70 and 80 °C was measured. Although the rate of weight reduction at each temperature differed, Fig. 5 shows that the maximum weight reduction was about 5.4%. Considering Figs. 3–5, this result estimated that forms α and β are solvate or ansolvate. Prakash reported that RebA has hydrate and anhydrate properties (Prakash et al., 2008).
The Karl Fischer method was applied to measure the water content of the polymorphic crystalline particles. The results show that untreated RebD had 6.7% water content, which is consistent with the TGA data, whereas form β had 0.40% water content and form α contained 0.93% water. The result implies that form β is an anhydrous crystal and form α is a hydrate one.
A typical SEM image obtained in this study is shown in Fig. 6, where RebD shows a needle-like crystal structure. However, no morphological changes of forms α and β compared to untreated RebD were observed.

Confirmation of the versatility of RebD polymorph production Confirmation of the versatility of the method for producing RebD polymorphs is important for its commercial application. In this examination, various RebD products obtained from different suppliers were used. To confirm whether RebD polymorphs could be made from each RebD product, XRD peak patterns of two types of polymorphs produced by the drying method were obtained. Fig. 7 (i) demonstrates that none of the RebD products used in the present study had patterns corresponding to forms α and β under normal conditions. In contrast, all the products treated by the drying process exhibited patterns corresponding to both polymorphs (Fig. 7 (ii, iii)). This result is industrially important, since RebD products showing enhanced solubility can be easily obtained by simply introducing a drying process.

Solubility of RebD polymorphs The solubility of forms α and β and untreated RebD was determined. The solubility of the control was 537 ppm, whereas forms α and β at 7.5 °C had about 626 and 593 ppm of RebD solubility, respectively, which was greater than the control. The amount of soluble form α in water was about 1.2 times greater than that of the control 40 min after adding the crystalline particles to the water. This result shows that the hydrate is more soluble than the anhydrate. An LY334370 HCl hydrate having a higher dissolution rate in water than the anhydrous form has been reported (Pudipeddi and Serajuddin, 2005).
Another experiment was performed to determine whether form α was more soluble than untreated RebD, in which form α was added to a suspension already saturated with untreated RebD at 7.5 °C. Fig. 8 demonstrates that the addition of form α to the already RebD-saturated suspension showed a more solubilized function over the untreated RebD, and its effect was maintained for more than 24 h after the addition of form α. These results indicated that form α had an enhanced aqueous solubility function.
State of form α during dissolution in water The state of dissolution of form α in water was observed using SEM, as shown in Fig. 9. The results indicated that the crystal was not dissolved uniformly. Instead, a mosaic-like, heterogeneous dissolution pattern was observed. This implies that form α was composed of both insoluble and soluble crystallites.
Conclusions
This is the first report to show that at least two polymorphs of RebD have been identified. Their enhanced solubility function in water was also studied. Fig. 10 illustrates that RebD, which is a hydrate under normal conditions, is transformed into form α at about 50 to 80 °C, depending on the rate of heat increase. Form α was transformed into form β at a higher temperature, namely, from 70 to 90 °C. The formation of polymorphs was correlated with the water content and could easily be obtained through the drying method. This is a convenient method because it is not necessary to dissolve the samples in a solvent and powder them to obtain a more soluble composition. This is the first report of the development of RebD polymorphs that may contribute to maintaining both the sugar-like taste profile and the high-solubility property of RebD. Furthermore, the dissolution state of form α was mosaic-like. It may be possible to further improve the solubility of form α by controlling the arrangement of the crystal lattice.

References
- Censi, R. and di Martino, P. (2015). Polymorph impact on the bioavailability and stability of poorly soluble drugs. Molecules, 20, 18759-18776.
- Challa, R., Ahuja, A., Ali, J., and Khar, R. K. (2005). Cyclodextrins in drug delivery: An updated review. AAPS. Pharm. Sci. Tech., 6, E329-E357
- Geuns, J. M. C.. (2003). Stevioside. Phytochemistry, 64, 913-921.
- Hao, H., Barrett, M., Hu, Y., Su, W., Ferguson, S., Wood, B., and Glennon, B. (2012). The use of in situ tools to monitor the enantiotropic transformation of p-aminobenzoic acid polymorphs. Org. Process. Res. Dev., 16, 35-41.
- Hellfritsch, C., Brockhoff, A., Stähler, F., Meyerhof, W., and Hafmann, T. (2012). Human psychometric and taste receptor responses to steviol glycosides. J. Agric. Food Chem., 60, 6782-6793.
- Kitamura, M. and Sugimoto, M. (2003). Anti-solvent crystallization and transformation of thiazole - derivative polymorphs - I: effect of addition rate and initial concentrations. J. Cryst. Growth., 257, 177-184.
- Leuner, C. and Dressman, J. (2000). Improving drug solubility for oral delivery using solid dispersions. Eur. J. Pharm. Biopharm., 50, 47-60.
- Markosyan, A. and Purkayastha, S. (2017). Highly soluble rebaudioside D. EU patent No 3181574, Jun. 21.
- Nishimaru, M., Nakasa, M., Kudo, S., and Takiyama, H. (2017). Operation condition for continuous anti-solvent crystallization of CBZ-SAC cocrystal considering deposition risk of undesired crystals. J. Cryst. Growth., 470, 89-93.
- Ohta, M., Sasa, S., Inoue, A., Tamai, T., Fujita, I., Morita, K., and Matsuura, F. (2010). Characterization of novel steviol glycosides from leaves of stevia rebaudiana morita. J. Appl. Glycosci., 57, 199-209.
- Pang, S., Ma, C., Zhang, N., and He, L. (2015). Investigation of the solubility enhancement mechanism of rebaudioside D using a solid dispersion technique with potassium sorbate as a carrier. Food Chemistry, 174, 564-570.
- Prakash, I., DuBois, G. E., Clos, J. F., Wilkens, K. L., and Fosdick, L. E. (2008). Development of rebiana, a natural, non – caloric sweetener. Food. Chem. Toxicol., 46, S75-S82.
- Pudipeddi, M. and Serajuddin, A. T. M. (2005). Trends in solubility of polymorphs. J. Pharm. Sci., 94, 929-939.
- Purkayastha, S., Markosyan, A., Martin, J., and Petit, M. (2016). Stevia composition to improve sweetness and flavor profile. US ypatent No 9510611, Dec. 6.
- Saravana, K. K., Sushma, M., and Prasanna, R.Y. (2013). Dissolution enhancement of poorly soluble drugs by using complexation technique - a review. J. Pharm. Sci. Res., 5, 120-124.
- Shiraki, K., Takata, N., Takano, R., Hayashi, Y., and Terada, K. (2008). Dissolution improvement and the mechanism of the improvement from cocrystallization of poorly water - soluble compounds. Pharm. Res., 25, 2581-2592.
- Upreti, M., Strassburger, K., Chen, Y. L., Wu, S., and Prakash, I. (2011). Solubility enhancement of steviol glycosides and characterization of their inclusion complexes with gamma - cyclodextrin. Int. J. Mol. Sci., 12, 7529-7553.
- World Health Organization. (2015). Guideline: Sugars intake for adults and children.
- i) http://apps.who.int/iris/bitstream/handle/10665/149782/9789241549028_eng.pdf (Oct. 17, 2018)