Technical papers
Effects of Harvest Maturity and Storage Time on Storage Quality of Korla Fragrant Pear Based on GRNN and ANFIS Models: Part I Firmness Study
2020 Volume 26 Issue 3 Pages 363-372
Details
2020 Volume 26 Issue 3 Pages 363-372
Generalized-regression-neural-network (GRNN) and adaptive neuro-fuzzy inference system (ANFIS) models were utilized to develop mathematical models for assessing the effects of harvest maturity and storage time on the storage quality of Korla fragrant pear. The results showed that fruit firmness had high correlations with harvest maturity and storage time. At different harvest maturities, the firmness of fragrant pear decreased with increasing storage time; while under the same storage time, a lower harvest maturity resulted in a faster decrease in the fruit firmness of fragrant pear. The GRNN and ANFIS models were validated to be reliable in predicting the variation tendency of fruit firmness of fragrant pear. In addition, the ANFIS model with generalized bell (gbellmf) (RMSE = 0.161; R2 = 0.98) was proved to be the optimum model. The findings of this study can provide reference for the research and practice of the storage of fragrant pear.
Korla fragrant pear, one of the most important fruit crops in Xinjiang, China, is popular in many countries around the world owing to its thin peel and juiciness as well as highly sweet and fragrant taste (Wei et al., 2018). Currently, Korla fragrant pears are traded in the form of fresh fruit or deep processing products such as fragrant perry and fragrant pear juice. The sale patterns of the fruit are generally divided into two types: seasonal sales and inventory sales, and the latter can prolong the period of market supply and increase income. Therefore, farmers tend to employ ice-temperature storage to ensure the freshness, special flavor and texture of Korla pears in storage (Murayama et al., 1998; Fu et al., 2007). The harvest maturity and storage time have significant effects on the quality of fruits under storage (Nordey et al., 2019). The quality of fruit may vary significantly at different harvest maturity, and storage will result in dramatic changes in fruit quality, which may greatly influence the production and sale of Korla fragrant pear. Hence, fruit firmness, soluble solid content (SSC), and chlorophyll and Vitamin c (VC) contents can be taken as the main storage quality indices of fragrant pear (Yu et al., 2018). These main quality indices can be determined to monitor and explore the storage performance of the fruit, which is of great significance for the production, storage and sale of Korla fragrant pear.
At present, many studies are focused on the quality of pears during storage from different points of view. Boonyakiat et al. (1987) found that harvest maturity affects the decay rate and quality change of d'Anjou pear during storage. A previous study has shown that storage temperature has a significant effect on the ripening quality of ‘Packhams Triumph’ pear (Downs et al., 1989). Rizzolo et al. (2015) demonstrated that storage temperature and time have significant effects on the storage quality and physiological changes of ‘Abbé Fétel’ pears treated with 1-MCP. In general, researchers apply mathematical models to predict fruit quality. For example, a correction model for predicting pear fruit firmness was established based on multiple linear regression (MLR) and principal component analysis (PCA) (Liu et al., 2007). Partial least-squares regression (PLSR) was used to predict the quality of pear and apple (Liu et al., 2007; Ferrari et al., 2015). Weibull model was employed to predict the drying data of pear (Karacabey et al., 2017). Artificial neural network (ANN) was used to establish the model of sugar content and moisture content of pear (Hong et al., 2007). GRNN model was utilized to predict the SSC of pears (Guo et al., 2015). ANFIS model was applied to the prediction of the retention of ascorbic acids in fresh-cut pineapple during storage (Jiang et al., 2016). Among these models, GRNN is a radial basis function neural network, which is often used in function approximation. It has the characteristics of fast training, strong non-linear approximation ability, and the ability to deal with unstable data. Hence, it has obvious advantages in classification, recognition and non-linear fitting applications (Ausati et al., 2016). The GRNN and ANFIS models have excellent performance in non-linear fitting, classification and identification (Altug et al., 1999). These two models have been used to predict the fruit and vegetable quality in previous studies. For example, the models were used to evaluate tomato quality in greenhouse (Zaborowicz et al., 2017), establish a classification model for Myrica rubra damage detection (Zheng et al., 2011), and predict the radical scavenging activities of anthocyanins (Jhin et al., 2014). However, there has been no report about the application of GRNN and ANFIS models in predicting the relationship of fruit firmness with harvest maturity and storage time of Korla fragrant pear.
Therefore, the objectives of the paper are to (1) reveal how the main storage quality indices of Korla fragrant pear of different harvest maturity vary under ice-temperature storage, (2) predict the relationship of the main storage quality indices with harvest maturity and storage time of Korla fragrant pear via using GRNN and ANFIS models of neural network, and (3) select the most appropriate model based on the prediction performance.
Samples Korla fragrant pear fruits were collected from the orchards in Tarim University of Xinjiang during the 2018 production season, which were basically consistent in size, shape and color, and had no visible signs of damage. The fruits were transported to the refrigerated warehouse and stored under ambient conditions −1 °C temperature and 90% relative humidity.
Test method With reference to the national standards and industry standards, Korla fragrant pear fruits at commercial maturity were collected by hand in an orchard from 31 August to 2 October (NY/T 585-2002 2002; NY/T 881-2004 2004). One hundred fruits were picked every day. Before storage, ten fruits from each batch were checked for firmness, and SSC, chlorophyll and VC contents, and the harvest maturity was computed using the maturity evaluation equation for Korla fragrant pear.
The remaining samples were stored at ice temperature, and the pears with different harvesting maturity gradually matured and their quality gradually changed during the storage process. During the ice-temperature storage period, four indices including fruit firmness, and chlorophyll, SSC and VC contents were detected every 30 days till the rotting of the stored fragrant pears.
Measurements of fruit storage quality The storage quality has been defined as degree of excellence quality of fruit during storage. In general, the studies suggested that firmness, SSC, chlorophyll and VC contents are good index to reflect the degree of storage quality in Korla fragrant pear (Liu et al., 2019). Among them, firmness as the main index can reflect the internal quality of fragrant pear, so it is often used as a first-class index to distinguish the grades of fragrant pear (Sheng et al., 2019).
The fruit firmness chlorophyll, SSC and VC contents of fragrant pear were measured in this work. Ten fruits were selected for the testing of each index, and the average value of 10 measurements was set for the index value.
Fruit firmness A small area (2 cm2) of peel was removed around the equatorial section of pear fruit (Fig. 1). The firmness of the peeled section was analyzed destructively using a 3.5 mm diameter Magness-Taylor (M-T) probe, which was attached to a fruit sclerometer (Model: GY-4, Beijing Sunshine Yishida Trading Co., Ltd., Beijing, China). A downward pressure with a velocity of 1 mm/s was provided until the plunger penetrated 10 mm into the fruit. The maximum force was recorded and used as the measurement of pear fruit M-T firmness expressed as kg/cm2 (Hertog et al., 2004).

Measuring points of quality indices of fragrant pear (●).
SSC One circular wedge (maximum diameter of 50 mm) from the measurement position of each fruit was taken, pressed through cheesecloth, and the SSC of the juice was measured with a temperature-compensated refractometer (model PAL1; Atago Co., Tokyo, Japan) (Wang et al., 2017).
Chlorophyll Twenty peel discs (1 cm2 of each disc) of ten fruits in each replicate were extracted in 15 mL of 80% (v/v) acetone in the dark at 25 °C for 24 h. Absorbance (A) was read at 645 and 663 nm on a spectrophotometer. Chlorophyll a (Chl a), chlorophyll b (Chl b) and chlorophyll a+b (Chl a+b) were calculated according to Arnon's equations. The results were expressed as mg chlorophyll per g of fresh weight tissue (Aispuro-Hernández E et al., 2019).
VC content The pulp (9.0 g) and 2% oxalic acid solution (50 mL) were put into a mortar to grind the pulp sufficiently. Then, 30 g pulp was weighed accurately and measured by Automatic Potentiometric Titrator (Model: METROHM 808 Titrando, Shanghai Renhe Scientific Instrument Co., Ltd., Shanghai, China). The unit was expressed as mg·100 g−1.
Determination of harvest maturity In the suitable pear-harvesting period, the quality indices is constantly changing, as shown in Fig. 2. In order to quantify the harvest maturity of Korla fragrant pear, the simple and practicable maturity evaluation equations proposed by Lan et al. (2015) were used. The harvest maturity are defined as follows:
 |

Calibration of the harvest maturity of Korla Fragrant Pear.
Obviously, with the help of the quantity evaluation method, the maturity of harvested samples could be evaluated. The prediction model of maturity based different indices are listed in Table 1.
| Index | Maturity evaluation equation |
|---|---|
| Firmness (N·cm−2) | Mi = 0.23yi − 1.99 |
| Soluble solid content (%) | Mi = 0.26yi − 3.83 |
| Chlorophyll (mg·100g−1) | Mi = 0.30yi − 1.94 |
| VC (mg·100g−1) | Mi = 0.40yi − 1.44 |
Note: Mi is the maturity calculated by certain indices; yi is the value of a particular index.
The equations mentioned above have certain regional limitations on guiding practical application. Although Korla fragrant pear shows similar growth patterns in various environments, it may exhibit different features due to different specific climates, soil conditions, field management methods and other factors. When a maturity evaluation equation is used to guide the production, especially in a certain environment, experimental calibration should be conducted first (Tijskens et al., 2003; Schouten et al., 2004; Hertog, 2002).
Modeling: GRNN model GRNN model was developed as an alternative to radial basis function (RBF) neural network, which is a kind of feed-forward neural network based on nonlinear regression theory. The principal advantages of the GRNN model are quick learning and fast convergence to optimal regression surface especially for smaller sample groups (Heddam, 2017). The basic structure of the GRNN model is shown in Fig. 3. A GRNN model consists of exactly four layers: (I) input layer, (II) pattern layer, (III) summing layer, and (IV) output layer.

Basic structure of the GRNN model.
The GRNN model was established with the assistance of existing experimental data. The harvest maturity and storage time were used as input parameters, whereas the main storage quality indices were considered as output parameters. A total of 45 data sets were randomly divided into two groups, including 32 sets for training and the remaining 13 sets for prediction. Then, cross-verification algorithm was used to determine the most important parameters for the model, namely, the smooth factors (σ). The successful prediction by the GRNN model largely depends on the smooth factors (Leung et al., 2000), and the optimum smoothing factors can be determined after several runs according to the mean squared error of the estimated values, which must be kept at the minimum. If a number of iterations pass without improvement in the mean squared error, the smoothing factor is determined as the optimum one for that data set.
ANFIS model ANFIS is a fuzzy-logic based model that focuses on learning capability of ANN to enhance the smart system's efficiency by using previous data (Buyukbingol et al., 2007). The basic structure of the ANFIS model has two inputs x and one output y, as shown in Fig. 4 for a Takagi-Sugeno fuzzy model. Fundamentally, five different layers are used to create this inference system, including (I) fuzzification layer, (II) rule layer, (III) normalization layer, (IV) defuzzification layer, and (V) output layer.

General ANFIS architecture.
It takes two steps to obtain the main quality indices by operating ANFIS, including training and prediction. This study was mainly based on the ANFIS toolbox in MATLAB. According to the measured data of the quality indices of 45 fragrant pears, 32 training set samples and 13 prediction set samples were obtained by dividing the training set and the prediction set at a ratio of 7:3. In this work, the ANFIS model was constructed using grid partition method. The ‘multiple input and single output models’ consisting of two inputs (harvest maturity and storage time) were developed to predict the main storage quality indices, as shown in Fig. 5.

Developed ANFIS structure.
For the training models, we use eight different types of input membership functions (MFs): ‘trimf’, ‘trapmf’, ‘gbellmf’, ‘gaussmf’, ‘gauss2mf’, ‘pimf’, ‘dsigmf’, and ‘psigmf’, which are shown in Fig. 6. A linear function was used as the output MFs. Due to the MFs in the model, it is possible to achieve the best output with the lowest possible error, which is of great significance for predicting the change of fruit firmness (Motahari-Nezhad et al., 2016).

Membership functions of the ANFIS model.
Selection of optimal prediction model During the modeling process, the GRNN model and the ANFIS model were built respectively by using the training set. Afterwards, the main quality indices of the prediction set were predicted by utilizing the trained models. In order to compare the predictive ability of the two different models, the RMSE and the R2 were calculated for judging the prediction performance.
 |
Where N is the number of the data. Kp is the predicted value, and KE is the real value.
A good model should have low values of RMSE while high values of R2. Specifically, the values of R2 in the range of 0.82– 0.90 indicate a good performance of the calibration model, while the values of R2 above 0.90 are considered sufficient for a particular prediction purpose.
Data analysis The SPSS program version 16.0 (SPSS Inc., Chicago, IL, USA) was used to process the original data of the storage test and test the significance and correlation. Then, the software of Matlab (R2017b, the MathWorks Inc., USA) was adopted for data modeling of this storage test.
Correlation analysis of harvest maturity, storage time and quality indices The data of correlation analysis on four quality indices (fruit firmness, and chlorophyll, SSC and VC contents) with harvest maturity and storage time are shown in Table 2 and Table 3, respectively. Harvest maturity showed significant negative correlations (P < 0.01) with fruit firmness and chlorophyll content, while significant positive correlations (P < 0.01) with SSC and VC contents. The storage time was positively correlated (P < 0.05) with SSC, but significantly negatively correlated (P < 0.01) with fruit firmness and chlorophyll and VC contents. Fruit firmness showed the highest correlation with harvest maturity and storage time, indicating that it is the main index of storage quality. Similar observation was also reported in previous studies (Lu et al., 2012).
| Storage time (d) | Firmness | SSC | Chlorophyll | VC content |
|---|---|---|---|---|
| 0 | −0.95** | 0.941** | −0.927** | 0.927** |
| 30 | −0.973** | 0.981** | −0.981** | 0.978** |
| 60 | −0.987** | 0.972** | −0.977** | 0.976** |
| 90 | −0.997** | 0.944** | −0.969** | 0.983** |
| 120 | −0.989** | 0.96** | −0.956** | 0.972** |
Note: **P < 0.01.
| Harvest maturity (%) | Firmness | SSC | Chlorophyll | VC content |
|---|---|---|---|---|
| 10 | −0.961** | 0.878* | −0.931* | −0.929* |
| 20 | −0.976** | 0.914* | −0.937* | −0.942* |
| 30 | −0.985** | 0.901* | −0.964** | −0.935* |
| 40 | −0.983** | 0.837 | −0.972** | −0.967** |
| 50 | −0.993** | 0.895* | −0.928* | −0.944** |
| 60 | −0.981** | 0.891* | −0.976** | −0.97** |
| 70 | −0.998** | 0.905* | −0.982** | −0.973** |
| 80 | −0.998** | −0.472 | −0.975** | −0.978** |
| 90 | −0.985** | −0.877 | −0.967** | −0.976** |
Note: **P < 0.01, *P < 0.05.
Effects of harvest maturity and storage time on fruit firmness during storage The variations of fruit firmness with varying storage time and harvest maturity of Korla fragrant pear under ice-temperature storage are shown in Fig. 7A. The fruit firmness decreased with the storage time during ice-temperature storage. In general, a lower harvest maturity would result in faster decreases in fruit firmness of Korla fragrant pear in the same storage time.
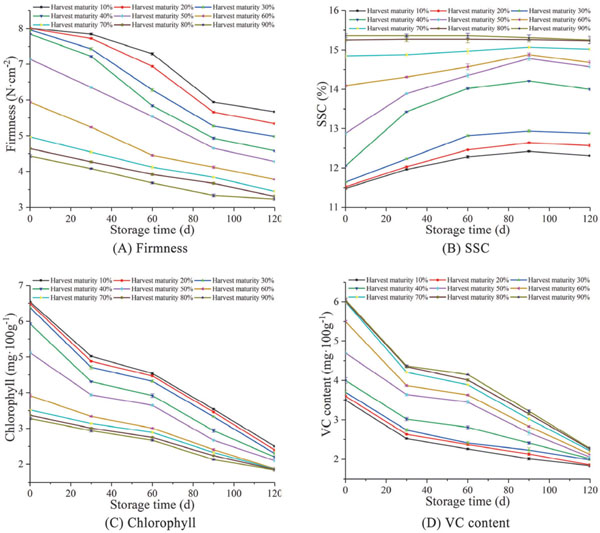
Broken line graph of storage time and storage quality indices of Korla fragrant pear during ice-temperature storage.
Evidently, the fruit firmness of Korla fragrant pear is mainly determined by the integrity of cell wall structure. The cell wall is mainly composed of insoluble protopectin before fruit ripening. At this time, the fruit texture is hard with complete structure of cells. With the gradual degradation of protopectin into soluble pectin and the corresponding damage of the cell structure, the fruit firmness would decrease rapidly after the ripening of fruit. The increased cell membrane permeability and rate of electrolyte leakage eventually lead to cell disintegration (Guan et al., 2001). Therefore, during the ripening period of Korla fragrant pear, the fruit firmness decreases gradually with the increase of harvest maturity. Fruit still have physiological activity after harvest, and the life activity of Korla fragrant pear itself would accelerate cell disintegration since the fruit has been removed from the tree and the nutrient supply has been terminated.
Analysis of the fruit firmness prediction model: GRNN model for the prediction of fruit firmness as a function of harvest maturity and storage time The GRNN model was trained with 70% of the experimental data as the training sample set. The value of optimal smooth factor obtained by analysis of the training results was 0.41. At this time, the prediction performance was better and the prediction error was also the minimum. Then, the prediction values were obtained after loading the remaining 30% experimental data into the well-trained model. The RMSE was 0.26 and the R2 between the predicted and measured values was 0.97. The fitting results are shown in Fig. 8. It was found that the GRNN model can make accurate prediction of the relationship of fruit firmness with storage time and harvest maturity.

Relationship between predicted and measured firmness of Korla fragrant pear.
ANFIS model for the prediction of fruit firmness as a function of harvest maturity and storage time Thirty-two samples were used as the training set and thirteen samples formed the prediction set. During the training phase, the initial ANFIS model was generated by grid partition method. The training set data were fuzzed by using eight different types of input MFs based on the 70% experimental data as the training set. Hybrid learning can perfect ANFIS model parameters at each stage and minimize errors to the most extent (Jang et al., 1993).
In the testing process, the ANFIS model was tested against an independent data set. The agreement between the measured values and the ANFIS model predicted values is shown in Fig. 9. In addition, the values of RMSE and R2 for the training and prediction sets are presented in Table 4. The R2 between the measured and predicted values was greater than 0.97 in all cases. According to Fig. 9, the predicted fruit firmness values are in close agreement with measured fruit firmness values, demonstrating a successful prediction of the ANFIS model on the fruit firmness of fragrant pear during storage. Further, the comparison revealed that the performance of the ANFIS model with ‘gbellmf’ is better than that of ANFIS model with other MFs. Therefore, it is recommended to use the ANFIS model with ‘gbellmf’ to predict the fruit firmness of fragrant pear.

Correlation between measured and predicted fruit firmness during storage using the ANFIS model with different membership functions at training (■) and prediction (●) phases.
| Membership functions | Training phase | Prediction phase | ||
|---|---|---|---|---|
| RMSE | R2 | RMSE | R2 | |
| trimf | 0.043 | 0.99 | 0.202 | 0.97 |
| trapmf | 0.087 | 0.99 | 0.205 | 0.97 |
| gbellmf | 0.067 | 0.99 | 0.161 | 0.98 |
| gaussmf | 0.065 | 0.99 | 0.165 | 0.98 |
| gasuss2mf | 0.080 | 0.99 | 0.188 | 0.97 |
| pimf | 0.086 | 0.98 | 0.203 | 0.97 |
| dsigmf | 0.042 | 0.99 | 0.177 | 0.97 |
| psigmf | 0.043 | 0.98 | 0.201 | 0.97 |
Determination of the optimum prediction model The R2 value of the GRNN model in the prediction set was 0.97, and the R2 values of the ANFIS model with all MFs in the training and prediction sets were greater than 0.97. Therefore, the GRNN and ANFIS model can be reliably used to predict the fruit firmness of Korla fragrant pear as a function of harvest maturity and storage time. In addition, the ANFIS model with ‘gbellmf’ is the optimum model for its better prediction performance (RMSE = 0.161; R2 = 0.98).
The results show that the fruit firmness of Korla fragrant pear has high correlations with harvest maturity and storage time. The prolonging of storage time would result in the reduction of fruit firmness of postharvest Korla fragrant pear. Korla fragrant pear fruits with a low harvest maturity show much faster decreases in firmness than those with a high harvest maturity. Based on the comparison of the prediction performances, the ANFIS model with ‘gbellmf’ is identified as the optimum model for its better prediction performance (RMSE = 0.161; R2 = 0.98). The results may provide reference for the accurate prediction of storage quality of Korla fragrant pear.
Acknowledgments The authors express their acknowledgment to the Chinese Natural Science Foundation (31201364 and 31660475) and Innovation and Entrepreneurship Project of the Xinjiang Production and Construction Corps Special Commissioner for Science and Technology (2019CB037) for financial support and all of the persons who assisted this writing.