Technical papers
Predicting Sugar Caking Using Dynamic Vapor Sorption Isotherms
2020 Volume 26 Issue 3 Pages 435-443
Details
2020 Volume 26 Issue 3 Pages 435-443
The caking of sugar is generally due to the mutual adhesion of crystals by dissolution and recrystallization of the crystal surface, and involves diverse and complex factors. Therefore, it is generally difficult to predict the cause of caking. This study aimed to establish a method to evaluate the extent of caking using dynamic vapor sorption isotherms to predict the caking of sugar. Grain size, powder characteristics, dynamic vapor sorption/desorption, and breaking measurement values for 29 different granulated sugars from different companies and regions throughout Japan were measured and then analyzed for correlations. Correlations were observed between caking and grain size for all samples as well as between caking and moisture sorption/desorption, verifying the utility of the dynamic vapor sorption measurement as a potential method to predict caking.
The caking of sugar is generally due to the mutual adhesion of crystals by dissolution and recrystallization of the crystal surface, involving diverse and complex factors. Therefore, it is generally difficult to predict the cause of caking.
Modeling of the caking process was attempted, based on the growth of liquid bridges, their hardening and the subsequent creation of solid bridges. The predicted caking strengths agreed well with some available experimental data on granulated sugar under storage conditions (Christakis, 2006).
The tendency for sugar caking was studied in different sizes of crystals under various conditions of temperature, humidity and added fine particles (Roge, 2003). Using water vapor adsorption isotherms, the Jenike shear stress cell and microphotography, samples with the smallest crystal size (<0.5 mm) or with the highest proportion of added fine particles (>10%) were found to be the easiest to cake. Flow function or flowability was useful to predict mass flow in silo or caking index of granulated sugar.
Some of these proposed models might be time-intensive and require optimization to predict the cause of caking on-site, e.g., daily routine analysis in the factory. In other words, there are few reports that propose a simplified model or method for predicting the cause of caking of sugar. As one of the factors causing caking, the powder characteristics of granulated sugar in Japan were investigated (Sakazaki, 2019). Granulated sugar showed a larger Carr's flowability index (Carr index) than fine granulated sugar. The Carr index was proposed as a simple and time-saving method to evaluate the flowability of a powder, which is reduced during caking. However, the correlation between the Carr index and caking has not been clarified. As an alternative approach, this study aimed to establish a method to evaluate the extent of caking through numerical information by using dynamic vapor sorption isotherms to predict caking of sugar.
Materials Twenty-nine types of granulated sugar were collected from 10 different companies and different regions throughout Japan. The granulated sugars were classified according to grain size into the following 3 groups:
Group 1 (553–616 µm [D50])
Group 2 (213–415 µm [D50])
Group 3 (30–49 µm [D50])
Regarding the shape of the sugars, Groups 1 and 2 were crystalline in form, while Group 3 comprised non-crystalline powdered sugars.
Grain size The average grain size, grain size distribution and uniformity were measured by a Mastersizer 3000 (Malvern Panalytical, Malvern, UK), a laser diffraction scattering type grain size measuring device. The average grain size is expressed as the mass median diameter, the value of the grain diameter at 50% in the cumulative distribution (D50). Uniformity, which is one of the indicators of grain size distribution, is calculated by the diameter at 60% (D60) divided by the diameter at 10% (D10). Generally, when the D60 and D10 are close in value, the powder is not flocculated.
Powder characteristics Powder flow characteristics were measured by the same method as Sakazaki (2019). The repose angle, compression degree, spatula angle and flowability were measured by a Multi tester MT-02 (Seishin Enterprise, Tokyo, Japan). The repose angle is the three-dimensional angle formed by the flowing powder that remained in place without sliding. The compression degree is defined by the freely settled density (ρA) of the powder poured into a cylinder and the tapped bulk density (ρT) of the powder after tapping the powder until no further volume changes occur, according to the following formula: (ρT-ρA)×100/ρT. The spatula angle is the angle of the mountain that forms when a spatula is embedded horizontally in the piled powder with the measurement surface facing up and the spatula is lifted vertically. The Carr index is used as a comprehensive index for the flowability of a powder. It is calculated as the sum of the four measured values (repose angle, compression degree, spatula angle, and uniformity). Each value was converted to 25 points according to their measurement result, and summed for a total of 100 points. A Carr index greater than 90 points is considered to be an indicator of good flowability, while that below 20 points is considered to have poor flowability.
Dynamic vapor sorption Water vapor sorption isotherms are known as an informative tool to determine the critical relative humidity for a given sugar at a given temperature (Mathlouthi, 2003). Critical relative humidity (CRH) is the relative humidity where the moisture absorption increases rapidly above a certain relative humidity. Sorption and desorption isotherms for the granulated sugar were measured by a DVS Adventure (Surface Measurement Systems Ltd., Middlesex, UK). Twenty milligrams of the granulated sugar sample was placed in a sample holder and hung in the thermostatically controlled cabin, in which the pre-set relative humidity (RH) was increased from 0 to 90% RH in 19 steps, 5% ramp per step, in a pre-programmed sequence, and then back to 0% RH in reverse order. The sorption processes were run at a constant temperature of 25 °C over the full RH range. The instrument maintained a constant target RH until the rate of sample moisture content change in mass per time unit (dm/dt) was less than 0.02%/min over a 10-minute period, or otherwise would go on to the next step after 30 minutes even if it did not attain 0.02%/min. The measured factors such as running time, temperature, RH and sample weight were recorded. This procedure was conducted 1 time for each sample, after confirming reproducibility in advance.
Breaking measurement The agglomeration degree (caking degree) was evaluated by the breaking measurement of the caked sugar. Twenty grams of granulated sugar was filled in a paper cup, stored in a stability test chamber CSH-122 (ESPEC CORP., Osaka, Japan) at 40 °C with 90% RH for 8 hours, followed by 20 °C and 40% RH for 16 hours for caking. The breaking strength, breaking strain, and breaking energy of the caked sugar were measured using a RHEONER II RE2-33005C (YAMADEN Co., Ltd., Tokyo, Japan). The cup with the caked sugar inside was loaded onto the holder and pressed down by a flat plunger with a diameter of 1.5 mm. Assay conditions were as follows: load cell, 200 N; distortion factor, 30%; and plunger speed, 1 mm/s. Ten cups were measured for each sample and the average value was recorded.
Statistical processing The measured values of the granulated sugar were analyzed statistically to clarify differences among the parameters assessed. All statistical analyses of the measured values were performed using the Excel statistical software package (BellCurve for Excel; Social Survey Research Information, Tokyo, Japan).
Powder characteristics, sorption and desorption, and breaking measurement All measured values for powder characteristics, DVS measurement and breaking measurement are presented in Tables 1, 2 and 3, respectively. For the DVS measurement values, sorption, desorption and hysteresis values were numerized as sums, by adding the change in mass value of each 5% step from 0% RH to 90% RH and back to 0% RH for each sample (Fig. 1). Breaking measurement values such as breaking strength and breaking strain conducted using the breaking curve were used to indicate the degree of caking (Fig. 2). Breaking energy was calculated by integrating the area between the breaking curve and the x-axis. Specifically, breaking strength (N) was divided by the bottom area of the plunger to obtain breaking stress (N/m2), and breaking strain (%) was divided by 100 to obtain breaking strain degree (m/m). The area surrounded by breaking stress and breaking strain degree was integrated to obtain the value of breaking energy (N/m2×m/m = Nm/m3 = J/m3). Computer software was used for calculation.
| Sample | Powder characteristics | ||
|---|---|---|---|
| Group | No. | Grain size D50[µm] | Carr index |
| Group 1 | 1 | 616 | 92 |
| 2 | 555 | 90 | |
| 3 | 599 | 92 | |
| 4 | 553 | 89 | |
| Group 2 | 5 | 313 | 89 |
| 6 | 213 | 80 | |
| 7 | 326 | 86 | |
| 8 | 298 | 86 | |
| 9 | 305 | 82 | |
| 10 | 328 | 82 | |
| 11 | 224 | 78 | |
| 12 | 373 | 85 | |
| 13 | 298 | 86 | |
| 14 | 378 | 81 | |
| 15 | 282 | 88 | |
| 16 | 335 | 89 | |
| 17 | 304 | 93 | |
| 18 | 236 | 78 | |
| 19 | 305 | 83 | |
| 20 | 254 | 80 | |
| 21 | 308 | 86 | |
| 22 | 352 | 86 | |
| 23 | 348 | 78 | |
| 24 | 314 | 78 | |
| 25 | 416 | 79 | |
| 26 | 346 | 80 | |
| 27 | 282 | 80 | |
| Group 3 | 28 | 30 | 62 |
| 29 | 49 | 52 | |
| Sample | DVS measurement value | ||||
|---|---|---|---|---|---|
| Group | No. | Sorption SUM[%] | Desorption SUM[%] | Hysteresis SUM[%] | Sorption+Desorption SUM[%] |
| Group 1 | 1 | 1.74 | 4.86 | 3.11 | 6.60 |
| 2 | 1.51 | 4.44 | 2.92 | 5.95 | |
| 3 | 1.36 | 4.22 | 2.87 | 5,58 | |
| 4 | 1.43 | 4.55 | 3.12 | 5.98 | |
| Group 2 | 5 | 1.76 | 5.13 | 3.40 | 6.90 |
| 6 | 1.79 | 4.84 | 3.04 | 6.64 | |
| 7 | 1.70 | 4.81 | 3.09 | 6.52 | |
| 8 | 1.21 | 4.13 | 2.94 | 5.34 | |
| 9 | 2.00 | 5.06 | 3.06 | 7.06 | |
| 10 | 2.05 | 5.14 | 3.11 | 7.18 | |
| 11 | 1.77 | 4.80 | 3.05 | 6.57 | |
| 12 | 1.61 | 4.82 | 3.23 | 6.43 | |
| 13 | 1.47 | 4.18 | 2.73 | 5.65 | |
| 14 | 1.61 | 4.21 | 2.61 | 5.83 | |
| 15 | 1.65 | 5.12 | 3.45 | 6.77 | |
| 16 | 1.87 | 5.04 | 3.16 | 6.91 | |
| 17 | 1.78 | 4.95 | 3.17 | 6.73 | |
| 18 | 1.83 | 5.03 | 3.20 | 6.86 | |
| 19 | 1.62 | 4.60 | 3.00 | 6.22 | |
| 20 | 2.11 | 5.11 | 2.99 | 7.22 | |
| 21 | 1.30 | 4.00 | 2.74 | 5.30 | |
| 22 | 1.60 | 4.68 | 3.08 | 6.28 | |
| 23 | 1.91 | 4.73 | 2.86 | 6.64 | |
| 24 | 1.48 | 3.77 | 2.32 | 5.26 | |
| 25 | 1.46 | 4.47 | 3.02 | 5.94 | |
| 26 | 1.74 | 4.99 | 3.25 | 6/74 | |
| 27 | 1.51 | 4.36 | 2.86 | 5.88 | |
| Group 3 | 28 | 2.26 | 5.60 | 3.34 | 7.86 |
| 29 | 2.50 | 5.99 | 3.49 | 8.49 | |
| Sample | Breaking measurement value | ||||||
|---|---|---|---|---|---|---|---|
| Group | No. | Breaking strength[N] | Breaking strain[%] | Breaking energy[kJ/m3] | |||
| Mean | SE | Mean | SE | Mean | SE | ||
| Group 1 | 1 | 35 | 5 | 3 | 1 | 309 | 74 |
| 2 | 13 | 2 | 3 | 2 | 181 | 91 | |
| 3 | 21 | 5 | 3 | 1 | 267 | 124 | |
| 4 | 44 | 6 | 8 | 1 | 934 | 203 | |
| Group 2 | 5 | 76 | 7 | 6 | 1 | 1442 | 314 |
| 6 | 71 | 8 | 8 | 1 | 1907 | 93 | |
| 7 | 36 | 6 | 4 | 2 | 402 | 196 | |
| 8 | 57 | 5 | 3 | 0 | 646 | 92 | |
| 9 | 79 | 5 | 6 | 1 | 1454 | 156 | |
| 10 | 68 | 6 | 5 | 1 | 1172 | 182 | |
| 11 | 67 | 5 | 8 | 1 | 1826 | 264 | |
| 12 | 49 | 8 | 5 | 1 | 764 | 113 | |
| 13 | 38 | 6 | 5 | 2 | 439 | 88 | |
| 14 | 24 | 5 | 4 | 1 | 258 | 52 | |
| 15 | 77 | 3 | 8 | 1 | 2098 | 276 | |
| 16 | 82 | 12 | 8 | 1 | 2287 | 402 | |
| 17 | 43 | 6 | 4 | 1 | 511 | 99 | |
| 18 | 71 | 6 | 5 | 0 | 992 | 119 | |
| 19 | 72 | 5 | 5 | 1 | 1181 | 177 | |
| 20 | 86 | 4 | 6 | 1 | 1429 | 217 | |
| 21 | 70 | 3 | 4 | 0 | 855 | 95 | |
| 22 | 61 | 7 | 4 | 1 | 690 | 121 | |
| 23 | 93 | 9 | 7 | 1 | 2019 | 339 | |
| 24 | 31 | 4 | 2 | 1 | 233 | 44 | |
| 25 | 30 | 4 | 1 | 0 | 136 | 29 | |
| 26 | 54 | 6 | 3 | 0 | 629 | 119 | |
| 27 | 49 | 5 | 3 | 0 | 401 | 72 | |
| Group 3 | 28 | 56 | 5 | 15 | 1 | 2842 | 390 |
| 29 | 97 | 4 | 8 | 1 | 2348 | 270 | |
Values expressed as mean and standard error (SE)

Example of dynamic vapor sorption isotherm (Sample No. 1)
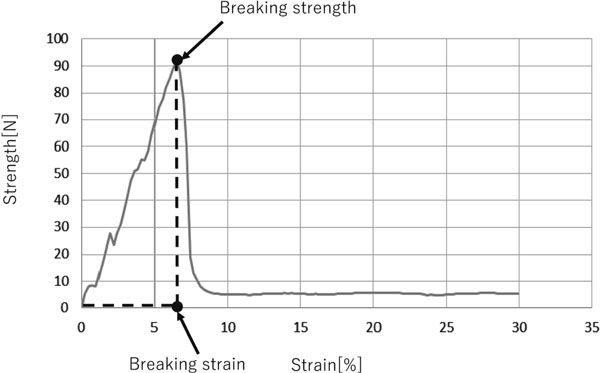
Example profile of a breaking curve (Sample No. 4-3)
Correlations in Groups 1, 2 and 3 The correlation matrix indicating relationships between Groups 1, 2 and 3 is shown in Table 4. Regarding the breaking measurement value (degree of caking), the following correlations were observed (r=±0.50–±0.75): i) grain size and breaking strength, strain, energy; ii) the Carr index and breaking energy; iii) sorption sum and breaking strength, strain, energy; iv) desorption sum and breaking strength, strain, energy; v) hysteresis sum and breaking strain, energy; vi) sorption + desorption sum and breaking strength, strain, energy. Also, the following weak correlations were observed (r=±0.25–±0.50): i) the Carr index and breaking strength, strain; ii) hysteresis sum and breaking strength.
;%0A%09%09%09newWindow.document.open();%0A%09%09%09newWindow.document.write('<img src=%22./Graphics/26_435_3.jpg%22>');%0A%09%09%09newWindow.document.close();%0A%09%09) |
Correlations in Groups 1 and 2 The correlation matrix indicating relationships in Groups 1 and 2 is shown in Table 5. Regarding the breaking measurement value (degree of caking), the following correlations were observed (r=±0.50–±0.75): i) grain size and breaking strength; ii) sorption sum and breaking strength, energy; iii) desorption sum and breaking strength, strain, energy; iv) sorption + desorption sum and breaking strength, strain, energy. Also, the following weak correlations were observed (r=±0.25–±0.50): i) grain size and breaking strain, energy; ii) the Carr index and breaking strength; iii) sorption sum and breaking strain; iv) hysteresis sum and breaking strength, strain, energy.
;%0A%09%09%09newWindow.document.open();%0A%09%09%09newWindow.document.write('<img src=%22./Graphics/26_435_4.jpg%22>');%0A%09%09%09newWindow.document.close();%0A%09%09) |
Correlations in Group 2 The correlation matrix indicating relationships in Group 2 is shown in Table 6. Regarding breaking measurement value (degree of caking), the following correlations were observed (r=±0.50–±0.75): i) sorption sum and breaking strength, strain, energy; ii) desorption sum and breaking strength, strain, energy; iii) sorption + desorption sum and breaking strength, strain, energy. Also, the following weak correlations were observed (r=±0.25–±0.50): i) grain size and breaking strength, strain, energy; ii) hysteresis sum and breaking strength, strain, energy.
;%0A%09%09%09newWindow.document.open();%0A%09%09%09newWindow.document.write('<img src=%22./Graphics/26_435_5.jpg%22>');%0A%09%09%09newWindow.document.close();%0A%09%09) |
With the DVS isotherms, a pathognomonic hysteresis appeared between 90% RH to 80% RH among all samples. The CRH of sucrose was previously reported to be 84% RH at 25 °C (Danjo, 1993). The moisture absorption of sugar rises sharply from this CRH, and when exposed to this humidity for some time, it will be in a state where it cannot be dehumidified to return to its initial state. Therefore, there was a need to set the operating conditions of the DVS measurement to not absorb too much moisture, but to exceed the CRH point.
As in our past study (Sakazaki, 2019), the Carr indexes of Group 1 tended to be larger than those of Group 2, and the Carr indexes of Group 3 tended to be smaller than those of Groups 1 and 2. The correlation between the Carr index and grain size was 0.75 for Groups 1, 2 and 3 (Table 4), 0.57 for Groups 1 and 2 (Table 5), and 0.15 for Group 2 (Table 6). This indicates that there was a correlation between the Carr index and grain size among different grain size samples; however, there was not a correlation among similar grain size samples.
The correlations between grain size, Carr index, DVS measurement value (sorption + desorption sum) and breaking measurement value (breaking energy) representing the degree of caking are shown in Table 7. The statistical population was sorted by population A (Groups 1, 2 and 3), population B (Groups 1 and 2) and population C (Group 2). For all populations A, B and C, the DVS measurement value had the highest correlation with the breaking measurement value. Among samples with different grain size (population A), grain size showed a correlation with the breaking measurement value (−0.65); however, there was a weak correlation between grain size and breaking measurement value among samples with a similar grain size (populations B and C, −0.48 and −0.43). Among population A, the Carr index was correlated with the breaking measurement value (−0.53); however, there was almost no correlation between the Carr index and breaking measurement value among populations B and C (−0.18 and 0.03).
| Statistical population | Grain size | Carr index | DVS measurement value (Sorption + Desorption SUM) |
|---|---|---|---|
| A (Group 1, Group 2 and Group 3) | −0.65 | −0.53 | 0.72 |
| B (Group 1 and Group 2) | −0.48 | −0.18 | 0.60 |
| C (Group 2) | −0.43 | 0.03 | 0.60 |
The purpose of this study was to predict the degree of caking of granulated sugars using dynamic vapor sorption isotherms. An evaluation method was established by converting breaking strength, strain and energy into numerical values to represent the degree of caking, and using sorption, desorption, hysteresis and sorption + desorption for the predictive values.
In all the cases where samples had similar and/or different grain size, the larger the DVS measurement value, i.e., the greater the moisture adsorption/desorption amount, the more readily the sugar caked. Although grain size is known to be correlated with caking, and which was verified in this study to be a useful value for predicting caking, the DVS measurement value had a stronger correlation with caking, meaning that the DVS measurement value is a more useful value for predicting caking. In the case where samples had a similar grain size, the Carr index was not a useful tool to predict the degree of caking. These results indicate that DVS measurement can be an effective tool for predicting the degree of caking, i.e., the ease of caking, with no limited usage conditions regarding grain size. In particular, this method is anticipated to effectively predict caking among granulated sugar where there is no difference in grain size.