Original paper
Simulation of Temperature Profile and Moisture Loss of Fresh Cucumber Fruit and Visualization of Commercial Storage Duration
2020 Volume 26 Issue 4 Pages 459-468
Details
2020 Volume 26 Issue 4 Pages 459-468
In cucumber (Cucumis sativus L.) fruit, transpiration is a significant factor that affects freshness and shelf-life. During storage, fresh cucumber requires careful management of moisture loss to delay quality deterioration. To assist with the determination of optimal storage conditions, this study was conducted to develop a simultaneous heat and mass transfer model for cucumber and to present a duration chart for cucumber storage. The simulation was performed using COMSOL software. The transpiration rate factor was determined as a regression equation on the vapor pressure deficit. The determination coefficient (R2) and root-mean-square error (RMSE) of temperature simulation ranged from 0.920 to 0.994 and 0.293 to 0.239 °C, respectively. The accuracy of the moisture loss simulation varied from 0.986 to 0.996 R2 and from 0.418 to 0.325 % RMSE. A temperature-humidity-dependent storage duration chart that ensures moisture loss of 5 % was developed by interpolation.
Cucumber (Cucumis sativus L.) is a plant species belonging to the gourd family Cucurbitaceae and is related to melon and squash. The fruit is regarded as one of the most popular horticultural products around the world, and it is widely consumed due to its unique flavor, crunchy texture, and numerous health benefits (Mohammadi and Omid, 2010). The fresh fruit is consumed raw in salads, sandwiches, or cold soups due to its plentiful dietary fiber and minerals (Liang et al., 2012). The storage of fresh cucumber should be managed by predicting the moisture loss in any storage condition to preserve freshness, as moisture content is a significant quality parameter (Eboibi et al., 2018).
Transpiration, which directly affects the moisture content, is an important factor in determining quality deterioration and shelf-life in horticultural commodities (Kader, 2002). Excessive moisture loss contributes to a significant reduction in fresh weight, resulting in a decrease in market value and substantial economic loss since such commodities are priced by weight (Nunes et al., 2011). The transpiration rate is proportional to the water vapor pressure deficit (VPD) between the skin of the commodity and the surrounding air, and is inversely proportional to the skin and boundary resistance (Yahia and Carrillo-Lopez, 2018). Improper climatic conditions, such as high temperature and low relative humidity (RH), induce serious moisture loss and occur mostly during storage or transportation (Yahia, 2019). Thus, knowledge of the optimal combination of temperature and RH for the storage of fresh horticultural commodities is necessary to preserve the freshness by minimizing the moisture loss.
Mathematical modeling provides a robust, practical engineering solution for predicting physical and physiological responses in commodities (Bovi et al., 2016). In terms of moisture loss, the gravimetric approach is considered as a simple approach to predict the moisture content (Karathanos and Belessiotis, 1999). However, this method provides limited detail on transpiration due to the complexity of modeling of skin resistance (Song et al., 2002). A simultaneous heat and mass transfer model is an attractive method because the moisture loss behavior, including transpiration, is considered to be driven by an interactive process of heat and mass movement (Castro et al., 2018). Song et al. (2002) developed respiration models for harvested blueberries using a simultaneous heat and mass transfer model. Several models have been proposed for estimating transpiration in various horticultural commodities; however, most were conducted without modeling of skin resistance.
Transpiration models are required to involve the effect of transpiration rate reduction because the transpiration rate of commodities reduces nonlinearly over time. For example, the transpiration rate in tomato fruit is significantly decreased by 50 % of its initial value after 14 d in storage (Díaz-Pérez and Araiza, 1997). The transpiration rate decline is due to increased resistance to moisture diffusion through the skin of the commodity as moisture loss continues (Yahia and Carrillo-Lopez, 2018). In this respect, the transpiration rate can be expressed as a function of the vapor pressure deficit, and its specific coefficients will differ between epidermal conditions as well as fruit varieties. In addition to transpiration rate reduction, it is also necessary to determine the optimal climatic conditions for postharvest storage. More than 90 % of weight loss occurs in perishable commodities during storage or transport due to improper climatic conditions (Shirazi and Cameron, 1993), and this results in serious economic losses. There are many established climatic conditions for various commodities, but the guidelines only offer fixed temperature and RH without considering the comprehensive situation in storage facilities.
Therefore, the objective of this study was to develop a simultaneous heat and mass transfer model to estimate transpiration in fresh cucumber fruit during storage. The coupled model includes evaporative heat removal by heat transfer and the skin and boundary layer resistance to mass transfer. Additionally, the moisture loss rate factor was determined as a function of vapor pressure deficit. Finally, the model was validated using experimental data, and a temperature-RH chart that displays the commercial maximum duration for cucumber storage is presented.
Sample preparation Fresh Japanese cucumbers (Cucumis sativus L.) harvested in the proper season were obtained from local agricultural markets (JA Itoshima and JA Asakura) in Fukuoka, Japan, and the fruits were transported promptly to the laboratory. Mechanically damaged fruits were excluded from the sample group, and cucumbers within the range of 100 to 110 g in weight and 20 to 22 cm in length were used. The intact cucumbers were kept in a 4 °C refrigerator for 10 min after sealing in a plastic bag and a cardboard box to minimize the cold shock and lower the physiological activity until the start of the experiment. The sorted samples were then used to determine the thermal-physical properties of cucumber and to collect experimental data, such as temperature profile and moisture loss.
Thermal-physical properties The density ρ (kg m−3) of cucumbers was calculated using the water displacement method with water at 22 °C, and the formula is given in Eq. 1:
 |
where m is the initial fresh weight of cucumber (kg) and V is the volume (m3) corresponding to the weight. In this study, all the gravitational parameters were measured using a precise digital balance with linearity of ± 0.02 g (FX-3000i, A&D Co., Ltd., Tokyo, Japan).
To determine the moisture content of cucumber, cucumbers with an average fresh weight of 104.5 g were dried in a forced convection drying oven (DK63, Yamato Scientific Co., Ltd., Tokyo, Japan) at 105 °C for 3 d (Özbek and Dadali, 2007). After measuring the dry weight, the wet-basis moisture content Xwb (kg kg−1, w.b.) and dry-basis moisture content Xdb (kg kg−1, d.b.) were evaluated using Eq. 2 and Eq. 3, respectively:
 |
 |
where Ww is the weight of water inside the cucumber (kg) and Wd is the dry weight of the cucumber (kg).
Geometric modeling The 3D geometry of cucumber was reconstructed using a series of X-ray computed tomography (CT) images of real cucumber fruits. The X-ray CT scanner (Latheta LCT-100, Hitachi Aloka Medical, Tokyo, Japan) obtained tomography images of a cucumber fruit with 3 mm pitches at 50 kV and 1 mA. The resolution of the CT image was 250 µm (480 × 480 pixels). These images were imported into Amira software (Amira 6.1, Thermo Fisher Scientific, Massachusetts, USA) and then assembled to develop a 3D geometry model. The cucumber geometry was then adjusted to the average size of the cucumber samples.
Modeling assumption it is assumed that cucumber fruit consist of homogeneous material and heat generation by respiration is negligible, the influence of surface shrinkage on transpiration is neglected, and the stomatal aperture is invariable.
Governing equations In heat transfer, the governing equation of conductive heat transfer in a steady state was defined in Eq. 4:
 |
where ρ is the density (kg m−3), T is the temperature at any location inside the cucumber at any time (K), Cp is the specific heat at constant pressure (J kg−1 K−1), and k is the thermal conductivity (W m−1 K−1). The specific heat and thermal conductivity are expressed in Eq. 5 (Siebel, 1982) and Eq. 6 (Sweat, 1974), respectively:
 |
 |
where Xwb is the wet-basis moisture content (kg kg−1, w.b.).
In mass transfer, the governing equation of mass diffusion was derived from Fick's law and is given by Eq. 7:
 |
where C is the mass concentration of moisture inside a cucumber at any internal location and any time (kg m−3), and D is the mass diffusivity of water inside a cucumber (m2 s−1), which was developed by AL-Hafidh and Ameen (2008) and is given in Eq. 8:
 |
Initial and boundary conditions For the initial condition, the distribution of the initial temperature and water concentration at time t = 0 was assumed to be uniform over the whole cucumber fruit, as in Eq. 9:
 |
where T0 and C0 are the initial temperature (K) and initial concentration (kg m−3), respectively.
In a simultaneous process of heat and mass transfer, the heat transition through the surface of a food material includes the heat removal by evaporation (Agrawal and Methekar, 2017). In this study, the heat flux (W m−2) through the cucumber skin is given by Eq. 10:
 |
where n is the normal vector, h is the convective heat transfer coefficient (W m−2 K−1), Ts is the temperature at any location on the skin at any time (K), T∞ is the temperature of ambient air (K), and λ is the latent heat of vaporization (J kg−1).
The mass flux at the boundary, which is the so-called transpiration rate or moisture loss rate, is given by Eq. 11:
 |
where hm is the mass transfer coefficient (m s−1), C∞ is the moisture concentration in the atmosphere (kg m−3), and Cs is the moisture concentration on the surface at any time (kg m−3), which was presented by Fasina et al. (2002) and is expressed in Eq. 12:
 |
where Ce is the equilibrium moisture concentration (kg m−3) and f is the transpiration rate factor (decimal). The boundary condition of mass flux at the surface is rearranged as Eq. 13:
 |
Finally, based on the ideal gas law, the boundary mass flux is transformed into Eq. 14:
 |
where Mw is the molecular weight (kg mol−1) of water, Ru is the universal gas constant (J mol−1 K−1), aw is the water activity of cucumber (decimal), RH is the relative humidity (decimal), and Psat is the saturated water vapor pressure (Pa) at the cucumber's surface, which was suggested by Buck (1996) and is given by Eq. 15:
 |
Heat and mass transfer coefficients To calculate the heat and mass transfer coefficients, the geometry of cucumber fruit was simplified into a cylindrical shape. For the storage with laminar state flow, Eq. 16 was used to determine the heat transfer coefficient (Agrawal and Methekar, 2017).
 |
where Nu is Nusselt's number, ka is the thermal conductivity of air (W m−1 K−1), L is the characteristic length (m), and Re and Pr are the Reynolds and Prandtl numbers, respectively.
Estimation of transpiration requires the combination of skin mass resistance and boundary resistance (Bovi et al., 2016). Thus, the total mass transfer coefficient hm (m s−1) can be divided into two terms as Eq. 17:
 |
where hb is the boundary mass transfer coefficient (m s−1) and hs is the skin mass transfer coefficient (m s−1). Based on Sastry and Buffington (1983), these coefficients are described as Eq. 18 and Eq. 19, respectively:
 |
 |
where Da is the diffusivity of water vapor in the air (m2 s−1), Sh, Re, Pr, and Sc are the Schmidt, Reynolds, Prandtl, and Schmidt number, respectively, φ is the fraction of pore area covering on the surface (decimal), and τ is the thickness of the skin (m).
Determination of transpiration rate factor The transpiration rate factor represents an empirical constant to regulate the dehydration rate of commodities (Perea-Flores et al., 2012). To determine this factor in Eq. 12, the actual moisture loss data were collected using 100 cucumbers (25 fruits for each condition). While storing the cucumbers in the environmental chambers (TPAV-120-20, Isuzu Seisakusho, Tokyo, Japan) with four different environmental conditions for 8 d, the weight of each fruit was recorded every 24 h. The climatic conditions are shown in Table 1 (no. 1 to 4). The changes in moisture ratio MR (decimal) at each condition were calculated using Eq. 20, which was proposed for high moisture foods by Özdemir et al. (2017) and the total moisture loss were estimated using Eq. 21:
 |
 |
| Use | Condition no. | Temperature (°C) | RH (%) |
|---|---|---|---|
| Model development | 1 | 20.0 | 80 |
| 2 | 20.0 | 40 | |
| 3 | 10.0 | 80 | |
| 4 | 10.0 | 40 | |
| Temperature estimation | 5 | 27.5 | 70 |
| 6 | 9.5 | 70 | |
| Moisture estimation | 7 | 20.0 | 70 |
| 8 | 7.0 | 70 |
where X is the moisture content at any time (kg kg−1, dry-basis), X0 is the initial moisture content (kg kg−1, dry-basis) of cucumbers, MLtotal is the total moisture loss (%), and X1 is the moisture content at the last measurement. The dry-basis moisture content was measured using the same method for measuring the thermal-physical properties.
Numerous studies have considered the transpiration rate factor f as a constant (Özbek and Dadali, 2007; Castro et al., 2018). However, the transpiration rate varies depending on the magnitude of the VPD. The transpiration rate factor was defined as a simple linear regression equation of the VPD. To develop the equation, the VPDs at four different conditions and the calculated f values that showed the lowest root-mean-square error (RMSE) were used. Regression analysis was performed with the assistance of the free statistical software R (version 3.2.2), developed by the R Foundation.
Simulation implementation The simultaneous heat and mass transfer model was solved using the finite element method in COMSOL Multiphysics (Version 5.3a, COMSOL Inc., Stockholm, Sweden). The 3D cucumber geometry model was imported into COMSOL, and the parameters for material properties and initial condition and the variables for boundary conditions were defined. To solve the coupled heat and mass transfer, the heat transfer in the solids module and the transport of diluted species module in COMSOL were adopted, and the simulation estimated the moisture transport process for 192 h and the heat transfer process for 100 min, starting from the specified initial conditions. Predefined normal meshing size (maximum element size: 0.0205; minimum element size: 0.0037; maximum element growth rate: 1.5; curvature factor: 0.6; and resolution of narrow regions: 0.5) was used for the mesh process. A sequence of simulations was iterated until the solution arrived at the result closest to the exact solution within the inherent error tolerance.
Model validation To validate the proposed model, actual temperature and moisture ratio data were obtained. The temperature profile was acquired by using K-type thermocouples with a diameter of 0.328 mm connected to a datalogger (midi LOGGER GL820, Graphtec Co., Yokohama, Japan). Figure 1 illustrates the configuration of the thermocouples in the cucumber. The tips of a pair of thermocouples were stuck directly underneath the skin and others were inserted from the surface to points on the center axis to detect the heat transfer. The fine cracks between the skin and the inserted thermocouples were sealed with silicon glue to reduce the acceleration of moisture loss. Finally, the six fruits with the thermocouples attached were transferred quickly into the two separated chambers (three fruits in each chamber), and measurement was started immediately. The climatic conditions for temperature validation were as No. 4 and 5 in Table 1. Additional moisture ratio data irrelevant to the transpiration rate factor were also obtained to evaluate the model validity using forty cucumbers. The storage conditions for moisture validation were as listed in Table 1 (no. 7 and 8).

The arrangement of thermocouples and the data acquisition points.
Finally, the determination coefficient (R2) and the RMSE, which are expressed as Eq. 22 and Eq. 23, were employed to evaluate the goodness-of-fit and residual between the simulated predictions and the experimental data:
 |
 |
where n is the number of data points, yexp,i is the experimental data, ypre,i is the predicted data, and ȳexp is the average of the entire experimental data. An R2 value closer to 1 and a lower RMSE value represent the higher accuracy
Cucumber storage duration chart For fresh commodities, it is generally known that the maximum level in moisture loss is considered to be 5 % of its initial weight (Kang and Lee, 1998). In other words, cucumber loses its marketability and become unsalable if the fruit loses more than 5 % of its moisture content after harvesting. Visualization facilitates the concise delivery of complicated numerical information derived from a mathematical model, transforming the numbers into imagery. In this study, a visualized chart was designed with several contour lines to indicate the maximum storage duration at a specific temperature and relative humidity, based on the 3D cucumber model that represents the average of the fruit samples. The values of the maximum storage duration at various environmental conditions were calculated from the simulation, inputting climatic factors (temp.: 5, 10, 15, 20, and 25 °C; RH: 20, 40, 60, 80, and 90 %) into the model. The duration at each condition was then vectorized with its climatic factors. Finally, the vectorized data were connected with contour lines by interpolation. The visualization process was implemented using MATLAB software (Ver. R2017a, MathWorks Inc., Massachusetts, USA). Note that the chart may be less appropriate for cucumber fruit that have different physical properties than those presented in this study.
Cucumber geometry and properties The 3D cucumber geometry was created using a series of X-ray CT images of real cucumber. Figure 2 shows the shape of the assembled 3D cucumber geometry. To ensure that the geometry represents the real cucumber, the volume and surface area of the geometry were adjusted for the actual shape. Table 2 summarizes the size of the geometry and other physical properties of cucumber fruit. The average density was similar to that obtained by Tanaka et al. (2018). The wet- and dry-basis moisture contents in the initial state were nearly equal to those investigated by Mousavizadeh et al. (2010). The initial specific heat and thermal conductivity were compatible with the data presented by ASHRAE (2006).

Three-dimensional cucumber geometry.
| Property | Symbol | Value | Unit |
|---|---|---|---|
| Volume | V | 1.005×10⁻⁴ | m3 |
| Surface area | A | 1.635×10⁻² | m2 |
| Density | ρ | 993.0 | kg m−3 |
| Moisture content | |||
| - Wet-basis | Xwb | 0.963 | kg kg−1 |
| - Dry-basis | Xdb | 25.9 | kg kg−1 |
| Specific heat | Cp | 4,078 | J kg−1 K−1 |
| Thermal conductivity | k | 0.623 | W m−1 K−1 |
| Fresh weight | 104.5 |
Heat and mass transfer simulation In order to compute the coefficients for heat and mass transfer, the airflow rate inside the cucumber container in the chamber was measured by means of an anemometer (Testo 425, Testo SE & Co., Germany), and the velocity was approximately 0.5 m s−1. The characteristic length was considered to be 0.027 m, corresponding to the average diameter at the middle of the length. The convective heat transfer coefficient (Eq. 16) was then calculated to be 16.63 W m−2 K−1. With respect to transpiration, the mass transfer coefficient in this study includes the skin resistance and the boundary resistance. The boundary mass transfer coefficient (Eq. 18) was calculated to be 1.477×10⁻² m s−1. To determine the skin mass transfer coefficient, the thickness of cucumber skin was measured using a micrometer (Series 102-707, Mitutoyo Co., Japan) after peeling off from the fruit with a sharp scalpel, and the value was approximately 1.0×10⁻⁴ m. According to Smith et al. (1979), the fraction of the pore area on the surface was assumed to be 0.007 including the area of the cut stem-end, by counting the number of pores and its area. The skin mass transfer coefficient (Eq. 19) was 4.020×10⁻⁴ m s−1, and finally the total mass transfer coefficient was estimated to be 3.922×10⁻⁴ m s−1. The coefficients for heat and mass transfer were similar to those investigated by Xanthopoulos et al. (2012). The constants and coefficients used for the simulation are summarized in Table 3.
| Coefficients and constants | Symbol | value | Unit | Source |
|---|---|---|---|---|
| Water activity | aw | 0.995 | decimal | (Barbosa-Cánovas et al., 2008) |
| Initial moisture concentration | C0 | 956.3 | kg m−3 | Measured |
| Diffusivity of water vapor in air | Da | 2.300×10⁻⁵ | m2 s−1 | (Cengel 2014) |
| Boundary mass transfer coefficient | hb | 1.477×10⁻² | m s−1 | Measured |
| Skin mass transfer coefficient | hs | 4.020×10⁻⁴ | m s−1 | Measured |
| Total mass transfer coefficient | hm | 3.922×10⁻⁴ | m s−1 | Measured |
| Heat conductivity of air | ka | 2.476×10⁻² | W m−1 K−1 | (Cengel 2014) |
| Molecular weight of water | Mw | 0.018 | kg mol−1 | (Cengel 2014) |
| Universal gas constant | Ru | 8.314 | J mol−1 K−1 | (NOAA 1976) |
| Heat transfer coefficient | h | 16.63 | W m−2 K−1 | Measured |
| Characteristic length | L | 0.027 | m | Measured |
| Nusselt's number | Nu | 18.14 | - | Measured |
| Prandtl's number | Pr | 0.732 | - | (Cengel 2014) |
| Reynolds's number | Re | 918.0 | - | Measured |
| Schmidt's number | Sc | 0.639 | - | Measured |
| Sherwood's number | Sh | 17.33 | - | Measured |
| Latent heat of water | λ | 2,256×103 | J kg−1 | (Cengel 2014) |
| Kinematic viscosity of air | ν | 1.470×10⁻⁵ | m2 s−1 | (Cengel 2014) |
| Skin thickness | τ | 4.0×10⁻⁴ | m | Measured |
| Velocity of air flow | u | 0.5 | m s−1 | Measured |
| Fraction of pore area | φ | 0.007 | decimal | (Smith et al., 1979) |
The transpiration rate factor was determined to fit the simulated moisture ratio curves to the experimental data. In this study, the transpiration rate factor was defined as a function of the VPD between the cucumber's skin and the surrounding air. The symbols in Figure 3 demonstrate the observed moisture ratio and the lines indicate the simulated curves that result in the lowest RMSE. Table 4 lists the VPD values in the four conditions and the corresponding transpiration rate constants as well as MLtotal at each condition; the regression equation is also shown. The R2 value was estimated as 0.976, which indicates a high accuracy and high goodness-of-fit. Figure 4 illustrates the statistical relationship graphically between the VPDs and the transpiration rate factors. The validity of the model for temperature and moisture ratio was further evaluated using additional experimental data that were not used in this section.

Comparison of observed and simulated moisture ratio for determining the transpiration rate factor.
| Conditions | Total moisture loss (%) | VPD (Pa) | Factor (1/s) | RMSE (%) |
|---|---|---|---|---|
| 20°C–80 %RH | 0.137 ± 0.028 | 455.98 | 0.100×10⁻⁵ | 0.3773 |
| 20°C–40 %RH | 0.227 ± 0.050 | 1391.3 | 0.260×10⁻⁵ | 0.3016 |
| 10°C–80 %RH | 0.085 ± 0.016 | 239.43 | 0.090×10⁻⁵ | 0.1979 |
| 10°C–40 %RH | 0.212 ± 0.039 | 730.58 | 0.170×10⁻⁵ | 0.2602 |
| Regression equation | Y = (1.551×10⁻⁹) X + (1.720×10⁻¹⁰) | |||
| R2 | 0.976*** | |||
| (X: VPD; Y: transpiration rate factor) | ||||

Simple linear regression analysis between the VPD and transpiration rate constant.
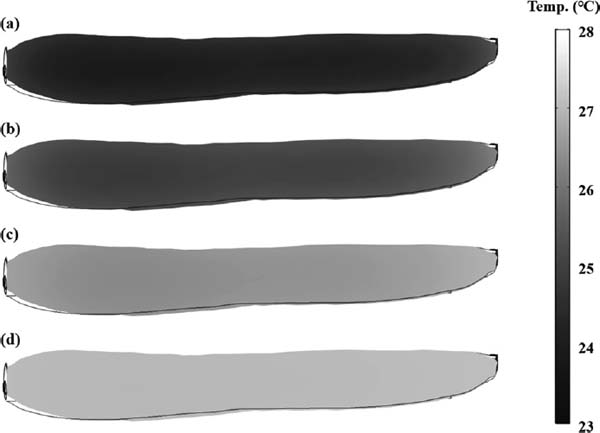
Validation of the temperature profile Using K-type thermocouples connected to a data-logger, the temperature profile inside cucumber fruit was recorded for only 100 minutes at 30-second intervals because it was observed that the temperature became constant after 100 min in the pre-experiment. The initial temperature of cucumber fruit for simulation was measured to be approximately 23 °C in 27.5 °C −70 %RH storage and 22 °C in 9.5 °C–70 %RH storage. Figure 5 shows the observed and predicted temperature profiles obtained from the center and surface in 27.5 °C storage. The temperature at both the center and surface reached around 27 °C in 100 min. It is known that the surface temperature of commodities is influenced by the evaporative heat removal caused by transpiration (Gottschalk et al., 2007). In this result, significant heat removal was not obviously observed but there was only a 0.5 °C difference at 100 min. A similar phenomenon was observed by Defraeye and Radu (2017). In the early part of the storage, the rate of temperature increase on the surface was higher than that at the center and the variation became smaller in the end. Similar behavior was also observed in simulation. The reason why the rate of temperature increase in the experiment was greater than that predicted in the simulation seemed due to the gap between the assumptions and actual conditions, such as airflow rate and/or object shape. As listed in Table 5, the R2 and RMSE at the center were estimated to be 0.955 and 0.239 °C, whereas they were 0.920 and 0.293 °C at the surface. Figure 6 displays the visualized temperature profiles in the vertically half-cut cross-section of the cucumber from the simulation in 27.5 °C storage. In addition, Figure 7 depicts the temperature profiles in 9.5 °C storage. As mentioned above, the rate of temperature decrease on the surface was higher than that at the center. However, unlike the storage at 27.5 °C, the realized temperature was about 9.7 °C. As investigated by Defraeye and Radu (2017), the lower temperature caused a decrease in the moisture loss rate, resulting in less effective evaporative heat removal. The R2 and RMSE at the center were estimated to be 0.994 and 0.273 °C, whereas they were 0.993 and 0.275 °C at the surface (Table 5). Figure 8 illustrates the visualized temperature profiles in the vertically half-cut cross-section of the cucumber at various times in 9.5 °C storage.

Comparison of observed and simulated temperature during storage at 27.5 °C–70 %RH.
| Validity | 27.5°C–70 %RH | 9.5°C–70 %RH | ||
|---|---|---|---|---|
| Center | Surface | Center | Surface | |
| R2 | 0.955 | 0.920 | 0.994 | 0.993 |
| RMSE(°C) | 0.239 | 0.293 | 0.273 | 0.275 |
Visualized temperature profile in longitudinal section in 27.5 °C–70 %RH storage: (a) after 10 min; (b) after 20 min; (c) after 50 min; and (d) after 100 min.

Comparison of observed and simulated temperature during storage at 9.5 °C–70 %RH.

Visualized temperature profile in longitudinal section in 9.5 °C–70 %RH storage: (a) after 10 min; (b) after 20 min; (c) after 50 min; and (d) after 100 min.
Validation of moisture ratio To prove the validity of the estimated moisture ratio from the simulation, actual moisture ratio data were obtained at 20 °C–70 %RH and 7 °C–70 %RH for 8 d. The observed MLtotal on average was 17.2 % at 20 °C and 11.3 % at 7 °C. The initial temperature in this simulation was considered to be 15 °C for both cases. Figure 9 shows the observed moisture ratio and the simulated moisture ratio in each condition. The simulated MLtotal was 17.5 % in 20 °C storage and 10.9 % in 7 °C storage, respectively. The validity was evaluated by R2 and RMSE of 0.996 and 0.325 % at 20 °C–70 %RH, whereas they were 0.986 and 0.418 % at 7 °C–70 %RH, respectively (Table 6).

Comparison of simulated and observed moisture ratio used for model validation.
| Validity | 20°C–70 %RH | 7°C–70 %RH |
|---|---|---|
| R2 | 0.996 | 0.986 |
| RMSE (%) | 0.325 | 0.418 |
Figures 10 and 11 display the visualization of the simulated moisture concentration profile in the vertically half-cut cross-section of the cucumber at 20 °C and 7 °C, respectively. Despite the high validity, the actual moisture loss phenomenon in cucumber was considerably different from the simulation. Tanaka et al. (2018) observed the actual moisture loss behavior by capturing X-ray CT images of cucumber during storage. The images showed that the mesocarp and endocarp have different thermal-physical properties, and the moisture loss near the stem-end was higher than that around the blossom-end. This behavior was already reported by Ree et al. (2012). Thus, it is expected that the model may be representative if these behaviors are included in the model.

Visualized moisture ratio profile in longitudinal section in the 20 °C–70 %RH storage: (a) after 24 h; (b) after 48 h; (c) after 96 h; and (d) 192 h.

Visualized moisture ratio profile in longitudinal section in the 7 °C–70 %RH storage: (a) after 24 h; (b) after 48 h; (c) after 96 h; and (d) 192 h.
Visualization of cucumber storage duration Figure 12 depicts a visualized contour chart that provides the maximum storage duration of cucumber, in which the interpolated contour lines indicate the time that cucumbers reach a 5 % loss of moisture content during storage. The chart shows that higher humidity and lower temperature can significantly preserve moisture during storage, otherwise moisture is lost very quickly. In addition, the moisture loss of cucumber in drought conditions becomes less sensitive to temperature compared to in humid conditions. Notably, it is not recommended that cucumbers be stored at temperatures below 5 °C. This is because cucumbers kept in refrigerated conditions can be damaged by chilling injury or other physiological disorders (Tatsumi and Murata, 1978). The duration chart may be utilized as a useful guideline to manage the storage facilities.

The maximum storage duration chart for cucumber fruit.
This study was carried out to develop a simultaneous heat and mass transfer model to predict the transpiration or moisture loss from cucumber fruit. The mathematical model was formulated based on two major transfer mechanisms: heat transfer based on Fourier's law and mass transfer based on Fick's law. The 3D geometry was created from X-ray CT images of a real cucumber and the moisture loss rate factor was determined as a function of the VPD. Finally, the simulation was performed using COMSOL software and showed high accuracy in both temperature profile and moisture ratio. The result proves that the presented model is appropriate for optimizing cucumber storage conditions and determining the maximum storage duration under various circumstances. However, the model did not consider extrinsic factors that affect the transpiration rate, such as the effect of ethylene gas and mechanical shock or vibration during transportation. This study may be helpful in designing optimal storage conditions and transportation plans to minimize moisture loss from fresh cucumber fruit during postharvest processing and increasing economic profits in the operation of storage facilities for fresh agricultural commodities.
Acknowledgements This work was supported by Cabinet Office, Government of Japan, Cross-ministerial Strategic Innovation Promotion Program (SIP).