Technical papers
Relationship between Evaluation of Taste Sensing System and Component Analysis in Sugar Products
2020 Volume 26 Issue 4 Pages 479-486
Details
2020 Volume 26 Issue 4 Pages 479-486
Brown sugar and black sugar (Kokuto) are increasingly popular ingredients of processed foods around the world. Classification of their taste quality through instrumental analysis can help us devise better food products. The feasibility of such statistical classification was assessed using 95 sugar products from Japan and elsewhere by evaluating their taste information values obtained with a taste sensor. Subsequent principal component analysis and cluster analysis divided the sugar products into three groups. The Kokuto taste index proposed previously and PC1 scores from the principal component analysis of taste information values matched almost perfectly. Strong correlations were noted with polyphenol content and color (an absolute coefficient of at least 0.74). Such instrumental analysis enables comparison of multiple sugar products at a time as well as comparison with products sold in the past, and thereby holds promise for further development of new brown sugar and syrup products.
Sugar is a plant-derived sweetener consisting mainly of sucrose. Granulated sugar, the most commonly used type of sugar worldwide, is white sugar composed of sucrose crystals with a purity of at least 99 % (Japan Sugar Refiners' Association, 2018). Globally, nearly 80 % of sugar is produced from sugarcane, and the remaining 20 % is mostly derived from sugar beets. Only a marginal proportion of sugar is produced from other plants, such as sugar palm (Arenga pinnata), coconut palm (Cocos nucifera), and sugar maple (Acer saccharum) (Cane Sugar Manufacturing Method, Yamane, 1963).
Sugar can be classified into non-centrifugal sugar and centrifugal sugar based on the production method. For both types of sugar, impurities are eliminated from the plant juice or sap, and the liquid is then concentrated by heating to allow the sucrose to crystallize. Up to this step, the production process is the same for both types of sugar. Non-centrifugal sugar is obtained after cooling the entire liquid, while centrifugal sugar is obtained by placing the liquid into a centrifugation apparatus to remove the molasses before crystallization (Science of Sugar, Hashimoto, 2006). Because of its high purity, centrifugal sugar does not contain plant-derived components other than sucrose. By contrast, non-centrifugal sugar contains 5–10 % plant-derived or production-process-derived non-sucrose components, imparting a characteristic taste and color to its sugar products (Science of Sugar, Hashimoto, 2006).
Every year, many Kokuto and brown sugar products are launched on the global market, keeping pace with their growing popularity in Japan, as mentioned in the introduction of the previous report (Fujii et al., 2019a) (Appendix). As shown in Table 1, sugar products called “brown sugar” are found in the categories of non-centrifugal sugars, centrifugal sugars, and processed sugars. Moreover, because palm sugar, maple sugar, and Kokuto, which are non-centrifugal sugars, appear to be brown or dark brown, it is difficult to identify the raw plant or taste quality based on the appearance.
 |
Kokuto is a non-centrifugal cane sugar that is unique to Japan (Akinaga et al., 1994). The taste (using sensory testing) and components of different types of Kokuto from Okinawa have been compared and reported in earlier studies. Similar comparisons have also been made among Kokuto from Kagoshima (Okura, 2000; Iwaya et al., 1996; Akinaga et al., 1996; Nakasone et al., 2000; Nakasone et al., 1989; Asikin et al., 2017). Sensory evaluation of Kokuto by direct tasting has also been carried out. However, the evaluations did not assess the taste quality of Kokuto as a food ingredient or involve any taste sensing system (Okura, 2002; Akinaga et al., 1994; Akinaga et al., 1996; Ujihara et al., 2009). Accordingly, we employed a taste sensing system (Kobayashi et al., 2010; Tahara et al., 2013; Toko, 2006; Toyota, 2011a; Toyota et al., 2011b; Akitomi et al., 2013) to assess the feasibility of objective taste quantification of Kokuto as a food ingredient. As the first step, the Kokuto taste index was obtained to indicate the taste intensity of cane sugar products (ranging from white sugar to Kokuto) (Fujii et al., 2019a). Subsequently, the Kokuto taste index described in the previous report was validated as an indicator of the intensity of Kokuto taste with respect to 13 kinds of Kokuto from Okinawa and Kagoshima (Fujii et al., 2019b).
This study targeted sugar derived from a wider range of plants produced in a greater number of countries to conduct the analysis of taste information values and components using a taste sensing system. Examples include sugar from sugar beets and palms, as well as Kokuto and brown sugar (non-centrifugal sugar) from China and South Korea. The study was intended to verify a similar relationship between the Kokuto taste index and PC1 scores from the principal component analysis as previously reported (Fujii et al., 2019a; Fujii et al., 2019b), so that the taste of any unknown sugar product can be associated with other known products with similar tastes.
Materials The following seven products were used as refined sugars (abbreviated as Ref): granulated sugar (standard sugar sample), crystal brown sugar, two san-onto products (soft brown sugar), wasanbon sugar, white sugar produced in South Korea, and zarame (coarse sugar) produced in Kagoshima. Three products produced in Kagoshima were used as raw sugars (abbreviated as Raw). The following products were used to represent Kokuto sugars: 19 products from Kagoshima (abbreviated as BKA), 23 products from Okinawa (abbreviated as BOK), 5 products from China (abbreviated as BCN), 3 products from South Korea (abbreviated as BKR), 1 product from Taiwan (abbreviated as BTW), and 6 products with unknown production areas (abbreviated as BUN). Products labeled as “black sugar,” “dark brown sugar,” or “red sugar” were referred to as “black sugar.” A total of 15 products were used as brown sugar; these were produced in Okinawa, Kagoshima, Thailand, the Philippines, Australia, South Korea, and unknown production areas. The two products used as maple sugars (abbreviated as Maple) were both produced in Quebec, Canada. A total of seven products were palm sugars (abbreviated as Palm); these were produced in Cambodia, Thailand, Indonesia, and the Philippines. Four products produced in Hokkaido were used as beet sugars (abbreviated as Beet).
Measurement using the taste sensing system For all sugar samples, 10 % (w/w) solutions containing 10 mM KCl were prepared and measurement was performed using the taste sensing system SA402B (Intelligent Sensor Technology, Inc., Kanagawa, Japan) The same measurement method was employed as previously reported (Fujii et al., 2019a).
Similarly to the previous report, the “Kokuto taste index” was obtained using the following equation (Fujii et al., 2019ab).
 |
Measurement of polyphenol content As the sugarcane-derived polyphenol content, catechin equivalents were measured using the Folin-Ciocalteu method.ii,iii) The concentration was adjusted for each sample to fit within the range of the calibration curve.
Measurement of sugar content The sugar content (sucrose, glucose, and fructose) was measured with 2.5 % (w/w) aqueous solutions of the respective samples by means of high-performance liquid chromatography (HPLC). The absolute calibration curve method was applied while employing a ligand exchange chromatography column (ligand exchange mode and size exclusion mode; Shodex KS-801 and KS-802; Showa Denko K.K., Tokyo, Japan), a refractive index (RI) detector (flow rate: 1.0 mL/min, column temperature: 60 °C, eluent: water, injection amount: 30 µL), and LC ChemStation (Agilent Technologies, Inc., California, United States).
Measurement of color difference For each sample, a 10 % (w/w) aqueous solution was prepared, which was then filtered with No. 2 filter paper (Advantec Co., Ltd., Tokyo, Japan) to control for the effects of cloudiness. Each filtrate was measured using an SE6000 spectrophotometer (Nippon Denshoku Industries Co., Ltd., Tokyo, Japan) based on the CIE L*a*b* system for transmittance with transmission cells, C/2°. To inspect color samples, L*a*b* was converted to RGB to create a color sample (Daichi et al., 2007; Yamashita, 2016).
Sensory testing A total of 12 panelists ranked Ref1, Raw3, Palm6, BKA4, BOK4, and BCN3 in terms of Kokuto taste intensity, with 1 being the weakest and 6 being the most intense. Evaluation was performed by panelists who had passed the sensory testing panelist selection screening (differentiation of the five tastes), a method developed by the Food Analysis Technology Center SUNATEC.
Statistical processing The measured values of the granulated sugar were analyzed statistically to clarify the differences among their parameters. All statistical analyses of the measured values were performed using the statistical software package BellCurve for Excel (ver. 3.00; Social Survey Research Information, Japan). The principal component analysis was carried out with a variance-covariance matrix. In the cluster analysis, conditions other than the Ward method were determined, and are shown in the results. The correlation coefficient of each pair of evaluation items was calculated using the Excel function. Friedman's nonparametric rank tests were conducted for sensory testing.
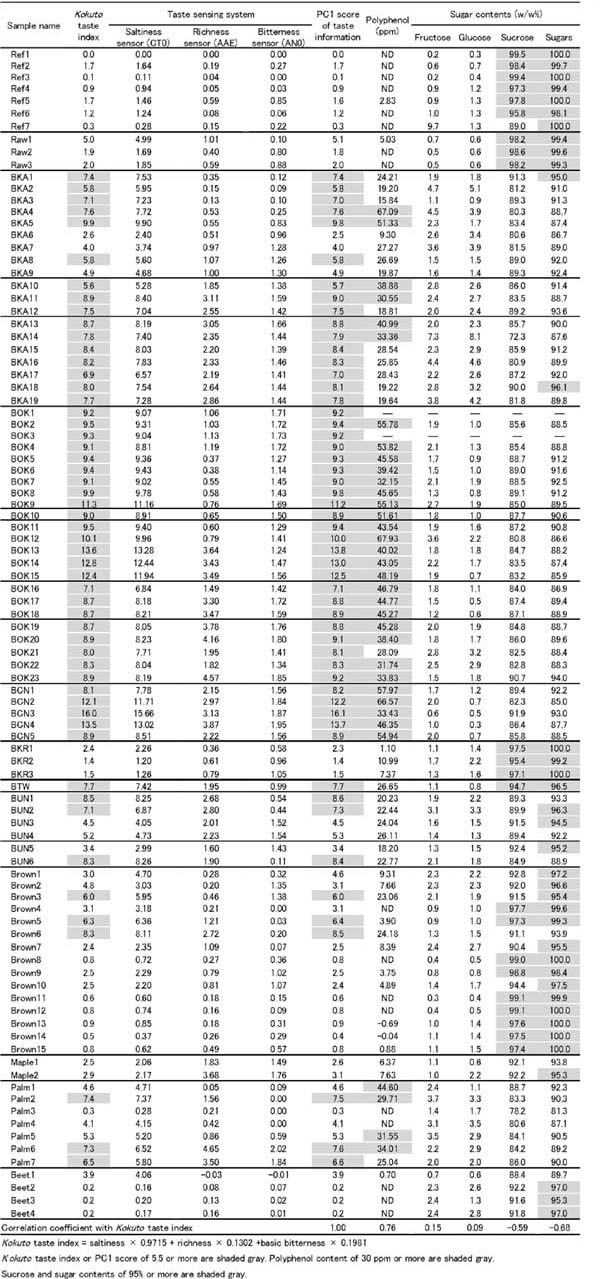
Evaluation with the taste sensing system Principal component analysis was performed on the taste information of saltiness (CT0), basic bitterness (AN0), and richness (Umami, AAE) of each sample. Table 2 shows the calculation results of the PC1 scores and the “Kokuto taste index.” In principal component analysis, the data were not standardized, and no constant terms were used to calculate the main component scores. The PC1 scores and the “Kokuto taste index” obtained in this study closely agreed with one another, having a correlation coefficient of 1.00. In Table 2, the cells with a Kokuto taste index or a PC1 score of 5.5 or more are shaded gray. The PC1 scores of Kokuto products produced in Okinawa, China, and Taiwan were all 5.5 or more, and of the 19 Kokuto products produced in Kagoshima, 16 had a score of 5.5 or more. The PC1 scores of Kokuto and maple sugar products produced in South Korea were 3 or less, indicating a weak Kokuto taste. Furthermore, the majority of scores for refined sugars and beet sugars were 1 or less, indicating a minimal Kokuto taste. The scores of the majority of brown sugar and raw sugar products ranged between 0.6 and 4.0.
 |
In Figure 1, the PC1 and PC2 scores are plotted along the two axes. The PC1 contribution rate was 91.6 %, while the PC2 contribution rate was 7.1 %; the cumulative contribution rate was 98.7 %, which indicates that these two components account for most of the data. According to the eigenvectors, the PC1 scores are positive for all three taste information values, suggesting the overall taste's intensity, while the PC2 scores have both positive and negative values, indicating taste balance (composition). According to the principal component loads, the PC1 scores are positive for all three taste information values, and the PC2 has a saltiness of −0.07 and richness of 0.77 and indicates taste balance (composition). The plotted data can be roughly divided into three groups: a group with high PC1, which includes Kokuto products with intense taste produced in Okinawa and China; a group with intermediate PC1, which includes Kokuto products with Kokuto taste produced in Kagoshima and unknown production areas; and a group with low PC1, which includes refined sugar products, raw sugars (centrifugal sugars), and beet sugars, all of which have no Kokuto taste. Moreover, the maple sugars had a PC1 score that is about the same as that of the group with a low PC1, but they also had a high PC2 score. The palm sugars had a PC2 score which was the same or higher than that of the group with intermediate PC1.

Principal component scores of each sugar product using PCA of taste information.
A cluster analysis of the taste information of saltiness, basic bitterness, and richness for each sample was performed using Ward's method with the squared Euclidean distance as a similarity coefficient; the number of clusters was six. The results are plotted in the form of a dendrogram (Figure 2). Clusters 1 and 2 include all refined sugars, raw sugars, beet sugars, and maple sugars, all of which have high sucrose purity with very little plant-derived taste. On the other hand, clusters 3 and 4 include Kokuto products produced in Kagoshima and Okinawa, while 18 of the 19 products in clusters 5 and 6 were Kokuto products produced in Okinawa or China.

Dendrogram of the result of cluster analysis of taste information.
The results of both principal component analysis and cluster analysis indicated that the results can be divided into a group consisting of Kokuto products from Okinawa and China with intense taste, and a group consisting of centrifugal sugars with high sucrose purity and maple sugars. Other Kokuto and brown sugars have similar taste information values, making it difficult to separate them based on the taste information values.
Polyphenol content, sugar content, and color difference Table 2 shows the results of measurement of polyphenol content, sugar content, and color difference. Cells with a polyphenol content of 30 ppm or more are shaded gray. In general, Kokuto products produced in Okinawa had high polyphenol contents, with all but one product having 30 ppm or more. Similarly, Kokuto products produced in China had relatively high polyphenol contents. By contrast, Kokuto products produced in Kagoshima, other Kokuto and brown sugars, and palm sugars had various results. Maple sugars, although there were only two samples, had polyphenol contents as low as 6 and 8 ppm. A very small amount of polyphenol was detected from beet sugars. The “Kokuto taste index” and polyphenol content had a positive correlation; the correlation coefficient was 0.76.
In the sugar content results, cells with sucrose and sugar contents of 95 % or more are shaded gray. The sugar contents of refined sugars and raw sugars were almost 100 %. These products do not contain non-sugar components because they are crystallized products obtained by separating out molasses (containing non-sucrose components) after crystallization. The other high sugar content samples were all of the Kokuto products from South Korea and Taiwan, 14 of the 15 brown sugar products, and 3 of the 4 beet sugar products, all of which contained 95 % or more sugar. While these sugar products appear to be brown, their polyphenol contents are low or not detectable, suggesting that these products are similar to or are blended with centrifugal sugars. In relation to the Kokuto taste index, the contents of fructose, glucose, sucrose, and sugar showed correlation coefficients of 0.15, 0.09, −0.59, and −0.68, respectively. While the difference in sugar content between refined sugar and non-centrifugal sugar is 10–15 %, it is considered that the contained non-sugar components, together with the content, have a greater impact on the taste compared to the impact of the difference in sugar content.
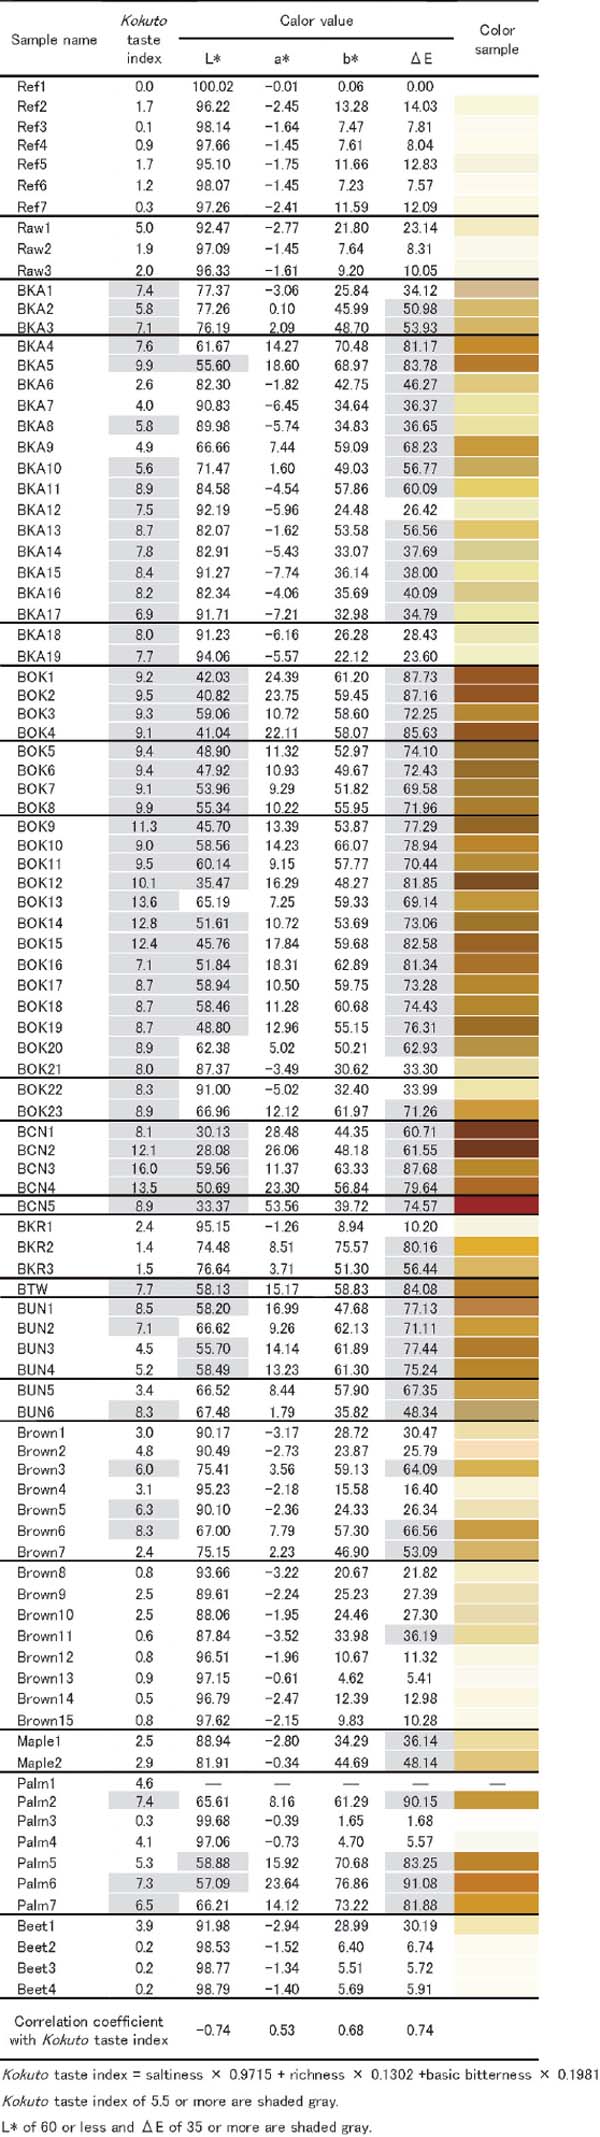
Table 3 shows the L*a*b* values of each sample as values to evaluate color difference, the ΔE values when the value for granulated sugar was used as the reference, and color indices. Cells with an L* of 60 or less and cells with a ΔE of 35 or more are shaded gray. Kokuto products produced in Okinawa and China tended to have a dark color, and the majority had an L*, a measure of brightness, of 60 or less, and a ΔE of 70 or more. Kokuto products from Kagoshima, brown sugar, and palm sugar showed higher L* values than Kokuto products from Okinawa and China, although most L* values were not less than 60 with varying levels of ΔE values. Refined sugars (granulated sugars, soft brown sugars, and crystal brown sugar “Cyu-zarato”), raw sugars, maple sugars, and beet sugars were white to pale yellow in color instead of brown, with high L* values and low ΔE values. In relation to the Kokuto taste index, L*, a*, b*, and ΔE showed correlation coefficients of −0.74, 0.53, 0.68, and 0.74, respectively. This fact points to the strong correlations with the color brightness (darkness) (L*), the intensity of yellow color (b*), and the color difference with granulated sugar (ΔE). The color index is easy to visualize, and it can easily be seen that types of Kokuto from Okinawa and China, which have high Kokuto taste indices, appear dark. On the other hand, generally speaking, the refined sugars, raw sugars, and beet sugars appear lighter, suggesting that color may correlate with a low Kokuto taste intensity.
 |
Sensory testing Table 4 shows the rankings of the refined sugars (Ref1), raw sugars (Raw3), palm sugars (Palm6), Kagoshima Kokuto (BKA4), Okinawan Kokuto (BOK4), and Chinese Kokuto (BCN3) in terms of Kokuto taste, taking into consideration the amount and quality of samples and the results of Friedman's test as well as of their descriptions. It was commented that the refined sugars have a pure sugar taste, are not Kokuto, or are granulated sugar. Other comments included that while palm sugar and the other three types of Kokuto products all appear to be brown, the intensity of Kokuto taste cannot be determined based on the color. Further, palm sugar has umami, along with a toasty taste and egumi (bitter and astringency taste), which was different from the taste quality of Kokuto. The assessment results of Okinawan Kokuto were similar to those of Chinese Kokuto. The ranking test results indicated that when comparing Kokuto with refined sugar, the p value was less than 1 %. In particular, there was a significant difference between Kokuto products from Okinawa or China and raw sugars, indicating that these products clearly have a strong Kokuto taste.
 |
The average rank for these products and the correlation coefficient with the “Kokuto taste index” was 0.90, suggesting that the sensory testing results may be explained by the “Kokuto taste index.”
This study evaluated whether the taste quality of non-centrifugal sugars can be evaluated using a taste sensing system, by examining the relationship between the assessment results for the taste sensing system and various component analysis results. The Kokuto taste index obtained with the taste sensing system exhibited a good match with PC1 scores from the primary content analysis carried out in this study. The fair match suggests that the index is an appropriate indicator of the intensity of Kokuto taste for the 95 products examined in this study, similar to the previously reported finding (Fujii et al., 2019a; Fujii et al., 2019b). The index demonstrated positive correlations with polyphenol content and color density compared to granulated sugar (ΔE), which implies a stronger Kokuto taste is carried by darker sugar. Meanwhile, the index demonstrated a negative correlation with sugar content. This indicates that products with high sugar content (e.g., 95 % or greater) do not necessarily have a strong Kokuto taste even if they appear brownish in color (e.g., ΔE of 35 or greater). The positive relation with the results of sensory testing demonstrates that the tastes of sugar products from different plants and regions (with varying degrees of purity) can be associated with known product groups or specific products by calculating their PC1 scores using a taste sensing system. Such instrumental analysis holds promise for further development of novel brown sugar products and brown sugar syrups.
We performed an evaluation and component analysis with the taste sensing system using 95 sugar products from Japan and other countries. The results of this study suggest that the “Kokuto taste index,” presented in the previous report, can serve as an indicator of Kokuto taste. The results of principal component analysis of the taste sensing system and cluster analysis suggest that the 95 sugar products may generally be divided into three groups. Furthermore, the correlation noted between instrumental analysis and sensory testing demonstrated a strong correlation between a higher intensity of Kokuto taste with a higher Kokuto taste index value, as well as with PC1 scores derived using a taste sensing system. The findings suggest that instrumental analysis of the reactions of taste sensors can predict the taste of a product by associating it with other products with similar tastes, without the need for sensory testing. This would enable comparison of large numbers of products at one time as well as comparison with past products, which would be useful in the development of new sugar products.