Abstract
Roasted stem tea, the product of roasting green tea stems, has a characteristic aroma and appearance. In this study, we evaluated the effects of different roasting conditions on the physical appearance, aroma, and taste of roasted stem tea. The real-time moving paths of color parameter L*a*b* were similarly changed from yellow-green to yellow-red with roasting at 180 °C, 200 °C, and 220 °C for each second, indicating that L*a*b* can be a measurement of roasting degree. Bulk density data and scanning electron microscope images revealed that tea stem swelling was optimal under high-temperature roasting conditions. Higher roasting temperatures provide heat that penetrates deeper within the tea stems. Regarding aroma, the higher the roasting temperatures, the more pyrazine and geraniol are produced. The higher internal heat promoted higher pyrazine and geraniol production, thereby improving the aroma of the roasted stem tea. Catechins and amino acids were rapidly decreased under high-temperature roasting.
Introduction
Roasted stem tea has a characteristic aroma (savory, roast, or sweet) that is obtained by roasting. Roasted stem tea has more aromatic compounds, such as pyrazines and terpenes, than roasted leaf tea that is well known to be manufactured from green tea leaves (Sasaki et al., 2017). Roasted tea, Houjicha, is mainly manufactured and consumed in Japan, and its sales have been increasing in recent years (i). Roasted stem tea (Fig. 1) is mainly produced and preferred to be drunk in Ishikawa Prefecture, Japan. Some roasted stem tea, produced from the stems of first flush tea, are considered to be of the best grade, making this tea popular in traditional Japanese cuisine. In a previous study, the aromatic compounds in roasted stem tea were evaluated using gas chromatography-mass spectrometry (GC-MS) and GC-olfactometry (GC-O) (Sasaki et al., 2017; Sasaki, 2017), and metabolomics profiling was conducted to reveal the relationship between chemical components and sensory analyses data in roasted stem tea (Sasaki et al., 2018). The effect of different roasting conditions on aroma generation in roasted stem tea has never been reported, although this is essential for improving the quality of roasted stem tea.

Roasted tea contains more than 100 volatile compounds, such as pyrazines, pyrroles, and furans (Yamanishi et al., 1973; Hara and Kubota, 1973; Kawakami and Yamanishi., 1999), with pyrazines being the major odorant that affects aroma (Mizukami et al., 2008). Roasting generates volatile compounds from the amino acids and sugars in the green tea, and the quality and quantity of these volatile compounds have been reportedly increased with roasting (Sasaki, 2017; Kawakami and Yamanishi, 1999). Roasted tea manufacturing processes vary widely. Similar to coffee, the characteristics of roasted tea depend on the degree of roasting, such as light, medium, or dark. Light-roasted tea has a fresh aroma, and dark-roasted tea has a deep aroma. Tea is generally roasted using a horizontal drum roaster that is heated by a gas burner. Several tea products are made using a far-infrared-type roaster, which roasts moving tea leaves using a far-infrared heater atop a roaster (Sasaki, 2017). The master tea artisan selects the roasting temperature, duration, and type and considers the quality of the tea ingredients and environment conducive for creating the best product. Few studies have reported the effects of roasting temperature on the aromatic components in roasted leaf tea. Mizukami et al. (2008) have reported changes in three nitrogenous compounds (potent odorants in roasted leaf tea) during roasting at 160 °C and 180 °C through a quantitative analysis using GC-MS; however, the number of monitored components was limited. Moreover, little has been reported on the effects of roasting temperature on the multiple components of roasted tea, including those in roasted stem tea. A comprehensive understanding of component changes obtained through roasting may be helpful to tea manufacturers in improving the quality of roasted tea. Understanding the many aroma and taste components of tea is difficult using conventional technology, because sensory properties are usually created by compounding many aroma and taste components.
Aromatic compounds in food and beverage have been studied by using gas chromatography. In the 1990s, stir bar sorptive extraction (SBSE), an extraction technique that uses a polydimethylsiloxane-coated stir bar, was combined with gas chromatography system for improving analysis by concentrating organic compounds via removal from the matrix substance (Baltussen et al., 1999). This miniaturized sampling technique led to improved sensitivity by easily concentrating organic compounds on the stir bar, and it can automatically analyze multiple samples by using dedicated autosamplers. SBSE is suitable for extracting aromatic compounds from an aqueous solution. Therefore, it is used for characterizing aromatic compounds in tea products (Magagna et al., 2017; Sasaki et al., 2017; Zeng et al., 2017). The analysis of taste compounds using liquid chromatography (LC) also has been advanced and used for evaluating tea products for quality improvement (Kaneko et al., 2006; Miyauchi et al., 2014; Shevchuk et al., 2018).
The physical traits of roasted stem tea are closely related to its quality. Artisans check the tea's color and form for quality management during roasting. Tea artisans, who manufacture roasted stem tea, relying on their experience, should obtain knowledge about the relationship of the changes in color and form with aroma and taste compounds. The importance of color and form is well known in coffee, making it a helpful reference for researching on tea roasting, because coffee is also roasted using a drum roaster at temperatures similar to those used in roasting tea. Coffee color has also been studied (Borrelli et al., 2002; Romani et al., 2003), and L* value is generally used as the roasting temperature parameter; however, few studies have reported on the color and form of roasted tea, including roasted stem tea. Evaluating these characteristics would help in understanding the changes in aroma and taste components that result from roasting.
This study aimed to evaluate the effects of different roasting conditions on the physical appearance, aroma, and taste components of roasted stem tea. We attempted to reveal the changes in these components in stem tea roasted at 180 °C, 200 °C, and 220 °C through profiling analyses using GC-MS and LC. Moreover, color and form were also evaluated, which are attributes that are closely related to tea quality. The obtained data led to several discussions on the process of roasting tea stems, such as the time-dependent changes in the tea's multiple components, effects of different roasting temperatures on generating aromatic components and changing taste components, influence of roasting time and temperature on the tea stems' color and form, and relationship between the changes in the tea stems' form and aromatic compound generation and changes in taste. This is the first study to provide knowledge on the changes in tea's multiple components and physical appearance during roasting.
Materials and Methods
Tea samples Green tea stems (Camellia sinensis var. sinensis cv. Yabukita), separated from the first flush tea, the best grade of green tea, and picked from a tea farm in Kagoshima Prefecture, Japan, in April 2018, was provided from a roasted stem tea manufacturing company, Maruhachi Seichajo Co. Ltd. (Ishikawa, Japan).
Chemicals Cyclohexanol and sodium chloride (NaCl) that were used to analyze the volatile compounds in the tea were purchased from Wako Pure Chemical Industries Ltd. (Tokyo, Japan), and N-alkanes (n = 6–25) were purchased from Tokyo Chemical Industry Co., Ltd. (Tokyo, Japan). Amino acids and tea catechins were bought from Wako Pure Chemical Industries Ltd. and Nagara Science Co., Ltd. (Gifu, Japan), respectively.
Sample preparation The green tea stems, with a moisture content of 6.2 wt.%, were roasted using a drum roaster (Ittaro, Fuji Coffee Co., Ltd., Osaka, Japan) in August 2018. Here, 150 g of green tea stems were divided into 50 g samples and roasted at 180 °C for 120, 180, 300, and 420 s; at 200 °C for 60, 90, 120, and 180 s; and at 220 °C for 40, 60, 90, and 120 s. The roasting conditions were implemented based on the advice of tea manufacturers. The temperature inside the drum surface was measured using an IT-545 infrared thermometer (Horiba, Ltd., Kyoto, Japan). The tea stems were immediately spread and cooled on an aluminum tray at room temperature after roasting. Each roasting experiment was conducted thrice, and the obtained samples were mixed, packaged in aluminum packs with nitrogen gas, and then stored in a freezer at −50 °C before analysis. They were then left to stand overnight at room temperature before extraction or analysis.
To evaluate aromatic compounds, extracts were taken from a 6 g tea sample after boiling in a teapot in 300 mL water for 30 s. The extract was then filtered through a stainless-steel tea strainer into another teapot and cooled in an Erlenmeyer flask through a cool water bath. The extract was subjected to aroma and taste analysis on the same day.
Color measurement The colors of the tea samples were evaluated using an SE6000 reflection spectrophotometer (Nippon Denshoku Industries Co., Ltd., Tokyo, Japan) based on the CIELAB color scale relative to the standard illuminant. The measuring surface of the instruments, with a 50 mm diameter, was filled with the samples for analysis. Experiments were conducted using five individual samples.
Analysis of bulk density A third of a glass weighing bottle (50 × 30 mm) was filled with one of the five tea samples and shaken to achieve a uniform surface, and then, more of the sample was added until two-thirds of the bottle's volume was reached, and the sample was shaken again. Finally, the bottle was filled with the sample to its full capacity, and then, it was shaken again and weighed (6–17 g). Bulk density (g/mL) was then calculated by dividing the weight of the filled bottle by its volume. The glass weighing bottle's volume was calculated by dividing the weight of the water used to fill the bottle by the water density. Experiments were conducted using five individual samples.
Observations with electron microscope Tea sample characteristics were observed using the JSM-6510LA scanning electron microscope (SEM; JEOL Ltd., Tokyo, Japan) at an acceleration voltage of 15 kV of a secondary electron image under a low vacuum pressure of ∼100 Pa.
Analysis of aromatic compounds using GC-MS Aromatic compounds in the tea extracts were analyzed using the SBSE method (Baltussen et al., 1999), as previously described (Sasaki et al., 2017). Tea extract (10 mL) was added to cyclohexanol as an internal standard, giving a final cyclohexanol concentration of 1 mg/L. Then, NaCl (3 g) was added to the tea brew and shaken until dissolved. A 15 mm stir bar with a 500 µm polydimethylsiloxane layer was added to the brew and equilibrated for 1 h at room temperature with constant stirring. Afterward, the stir bar was removed from the tea brew and dried using filter paper.
The stir bar was inserted into a thermal desorption unit (Gerstel Inc., Mülheim an der Ruhr, Germany) that was connected to a CIS cold trap injector (Gerstel Inc.) and a GC system for GC-MS analyses. The extracted compounds were desorbed from the stir bar at 230 °C using a thermal desorption system, cryofocused at −120 °C using liquid nitrogen, volatilized at 230 °C in the CIS, and injected into the Agilent 7890A GC system (Agilent Technologies Inc., Palo Alto, CA, USA) equipped with the Agilent 5975C mass spectrometer. The DB-WAX fused-silica capillary column used for analysis was 60 m high, with a 0.25 mm internal diameter (J&W Scientific Inc., Folsom, CA, USA) and a 0.25 µm film thickness. The oven temperature was programmed to increase from 40 °C (10 min hold) to 230 °C (12 min hold) at a rate of 5 °C/min. The split ratio was 1:10. Helium, at a linear flow rate of 1.2 mL/min, was used as the carrier gas. Mass spectra were obtained by electron impact ionization with an ionization voltage of 70 eV and an ion source temperature of 150 °C in the range of m/z 33–300. Analysis was conducted using the SCAN mode. The retention index (RI) was calculated using N-alkanes (n = 6–25), according to the method described by Kováts (1958). Analyses were done in triplicate.
Major aromatic compounds in roasted stem tea were identified from GC-MS data according to the method described by a previously published papersstudy (Sasaki et al., 2017), which stated that potent odorants in the roasted stem tea were identified using GC-MS and GC-O by analyzing the diluted aroma extract. These odorants were selected as major aromatic compounds in this study. The compounds were identified by referring toin accordance with the RIs in the published papers, the Wiley/NIST database mass spectra, and the authentic compounds in our database that was created while researching published papers. Relative concentrations were calculated by dividing the peak area of major aromatic compounds by that of cyclohexanol.
Analyses of free amino acids and catechins Free amino acid content in the tea extracts was analyzed using the L-8900 amino acid autoanalyzer (Hitachi High-Technologies Corp., Tokyo, Japan). Here, 20 µL of samples were separated using the ion exchange column 2622 SC PF 4.6 × 60 mm column (Hitachi High-Technologies Corp.) eluted at 0.35 mL/min with 31 step gradients for 120 min using the MCI BUFFER™ PF Kit Wako Pure Chemical Industries Ltd.). The elution was reacted with ninhydrin solution (Wako Pure Chemical Industries Ltd.) at 135 °C in a post-column, and absorbance was measured at 570 and 440 nm. Amino Acids Mixture Standard Solution (type AN-II and type B, Wako Pure Chemical Industries Ltd.) were used as external standard for free amino acid measurement.
Catechins were analyzed using the Agilent 1260 high-performance LC (HPLC) system with the Agilent 6530 MS system. The samples were separated using the Poroshell 120 EC-C18 100 × 2.1 mm column (2.7 µm particle size; Agilent) maintained at 35 °C and eluted at 0.4 mL/min with a linear gradient of solvent A (water:acetonitrile:tetrahydrofuran [18:1:1] containing 0.1 mL/100 mL formic acid) and solvent B (water:acetonitrile:tetrahydrofuran [10:9:1] containing 0.1 mL/100 mL formic acid) for 8 min, with the following linear gradient elution: 0 min, 0% B; 2 min, 0% B; 5 min, 60% B; 10 min, 60% B; 10.01 min, 0% B; and 15 min, 0% B. The total run time was 15 min. The calibration curve was created using the external standard method, specifically from preparing catechins' standard solutions ranging from 0.1 to 1.0 mg/100 mL and injecting 1 µL of each into the HPLC system. The electrospray ionization probe was operated in the negative mode at a rate of three scans per second across an m/z range of 100.500 under the following conditions: drying gas, 280 °C, 11 L/min; nebulizer, 360 kPa; VCap, 3 500 V; fragmentor, 150 V; and nitrogen gas flow, 1.5 L/min.
Statistical analyses Multivariate analyses were conducted using GC-MS, amino acid, and catechin data with principal component analysis (PCA) using the SIMCA v.14.0 software (Umetrics, Umeå, Sweden) after the data were mean-centered and unit variant-scaled.
Results and Discussion
Changes in color The main objective of this study was to determine the effects of various roasting conditions on the appearance and chemical components of roasted stem tea. Roasting progression differs with roasting temperature, making it difficult to compare tea samples roasted at various temperatures. We evaluated the color of tea samples roasted at 180 °C, 200 °C, and 220 °C to compare the roasting progression at each temperature. We also considered the possibility of L*a*b* color space as a parameter of roasting temperature, because the artisans check color as part of quality management during roasting.
The L*a*b* color space values of both roasted and green tea stem are shown in Fig. 2. Tea materials, but not the tea extracts, were used as test samples, because measuring the color of the material is easier than measuring the color of the extract, which changes with storage time. In Fig. 2, the L*a*b* value similarly changed at all tested temperatures. The a* value increased from −6 to approximately 4 with roasting time, whereas the b* value increased from 19 to approximately 22 and then decreased to 11–16. Changes in a* and b* means that the color changed from yellow-green to yellow-red due to roasting. This change may be due to decreased chlorophyll, the green-colored compound of green tea, and the generation of Maillard reaction products that are brown-colored (more detailedly explained below). The L* value increased from 35 to 37 and then decreased to 25–30, which indicated that brightness slightly increased first and then decreased. The cause of the slight increase in L* is not known; however, the decrease in L* may have been caused by increased Maillard reaction products. L* and b* values were strongly related (correlation coefficient: 0.992); therefore, the components in tea that caused the changes in L* and b* may be the same.

The L*a*b* moving path under all temperature conditions was the same (Fig. 2). Therefore, each L*a*b* value could be used as roasting degree parameters under specific temperature conditions. If the L*a*b* moving path differed depending on roasting temperature, then the L*a*b* values cannot be used in comparing roasting progression among different temperatures. The ranges of L*a*b* values were the same under all temperature conditions. This result indicated that roasting progression was at the same level under the roasting conditions of 180 °C for 0–420 s, 200 °C for 0–180 s, and 220 °C for 0–120 s. Hence, using these roasted samples to compare the aroma and taste component levels among different roasting temperatures was appropriate.
The results indicated that using L* and b* values as parameters of roasting degree was suitable, because their changes were larger than those of a*. The L* value is generally used as a parameter of roasting degree in coffee. Therefore, the better choice was to also use the L* value as the parameter for tea.
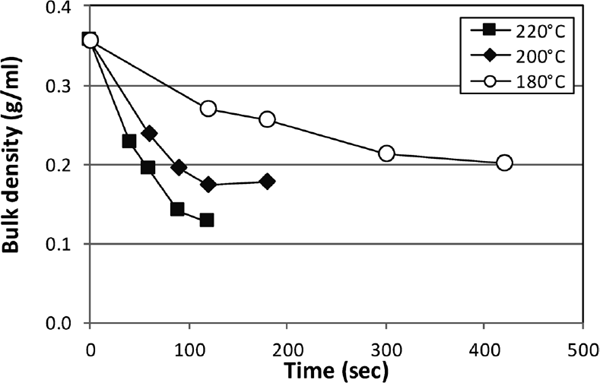
Bulk density and electron micrograph The tea stems swelled during roasting. Understanding any form change during roasting is necessary to determine how the changes in the aroma and taste components differed under different roasting conditions. Each sample's bulk density was measured to estimate the effects of different roasting temperatures on the changes in tea stem form (Fig. 3). Bulk density first rapidly and then slowly decreased during roasting at all temperatures, which was caused by the swelling of the roasted tea stems. Moreover, bulk density decreased with increasing temperatures, which indicated more swelling at higher temperatures.
Cross-section evaluation of stem surfaces was observed using SEM to understand the internal structure of the swelled tea stems (Fig. 4). Tea samples roasted at 180 °C for 180 s and 220 °C for 90 s were selected as the high and low bulk density samples, respectively. Figure 4A shows that green tea stem structure was crushed and shrunk. This green tea stem was obtained from the first flush tea, in which the tea is rolled during manufacture, thereby crushing its internal structure. In Figs. 4B and 4C, the tea stems swelled while being roasted. The sample roasted at 220 °C was specifically larger than that roasted at 180 °C. Roasting at high temperatures for a shorter time can effectively induce tea stem swelling. Such roasting conditions allow heat to penetrate deeply and rapidly vaporize the water in the tea stems.

Aroma and taste component profiling We evaluated the effects of roasting temperature on the aroma and taste components using component profiling. Figure 5 shows the results of PCA of these components, which comprised 22 aromatic compounds, seven amino acids, and eight catechins. Table 1 lists the 22 aroma components that were detected and selected based on potent odorants that were identified in a previous research (Sasaki et al., 2017). The seven amino acids that are the major components in roasted tea were glutamine (Gln), glutamic acid (Glu), arginine (Arg), asparagine (Asp), serine (Ser), alanine (Ala), and theanine. The eight catechins were epigallocatechin gallate (EGCg), epigallocatechin (EGC), epicatechin gallate (ECg), epicatechin (EC), gallocatechin gallate (GCg), gallocatechin (GC), catechin gallate (Cg), and catechin (C). Component changes in the components of the roasted stem tea are provided in the score plot shown in Fig. 5A. The PC1 score transferred from a positive area to a negative area with roasting under all tested conditions, which indicated that the PC1 axis is related with roasting degree. Moreover, samples roasted at higher temperatures had higher PC2 scores. This result indicates that different roasting temperatures influence the components of the roasted tea, which is related to the PC2 axis. Particularly, samples roasted at 220 °C (middle roasting period) were observably within the negative PC1 and positive PC2 areas. All dark-roasted samples were observed to be nearly within the negative PC1 and negative PC2 areas. The components in dark-roasted samples were the same even with different roasting temperatures.

Table 1.
The detected aromatic compounds in roasted stem tea.
| No. |
RIa |
Aromatic compoundsb |
Odor qualityc |
| 1 |
766 |
Dimethylsulfide |
Sulfury |
| 2 |
1178 |
1-ethylpyrrole |
Roast |
| 3 |
1198 |
Trimethyloxazole |
Roast |
| 4 |
1299 |
Acetol |
Roast |
| 5 |
1329 |
2,5-dimethylpyrazine |
Roast |
| 6 |
1339 |
Ethylpyrazine |
Roast |
| 7 |
1392 |
2-ethyl-6-methylpyrazine |
Roast |
| 8 |
1414 |
2,3,5-trimethylpyrazine |
Roast |
| 9 |
1443 |
2,6-diethylpyrazine |
Roast |
| 10 |
1451 |
(E)-linalool oxide (furanoid) |
Sweet |
| 11 |
1455 |
2-ethyl-3,6-dimethylpyrazine |
Roast |
| 12 |
1472 |
2-ethyl-3,5-dimethylpyrazine |
Roast |
| 13 |
1504 |
2,3-diethyl-5-methylpyrazine |
Roast, sweet |
| 14 |
1545 |
Linalool |
Floral |
| 15 |
1766 |
linalool oxide (pyranoid) d |
Sweet |
| 16 |
1795 |
methyl salicylate |
Sweet |
| 17 |
1836 |
1-(2-furanylmethyl)-1H-pyrrole |
Sweet |
| 18 |
1848 |
Geraniol |
Floral |
| 19 |
1962 |
b-ionone |
Sweet |
| 20 |
1970 |
(Z)-jasmone |
Sweet |
| 21 |
2462 |
Indole |
Metallic |
| 22 |
2494 |
Coumarin |
Sweet |
Notes:
a RI: retention index on DB-WAX column (60 m × 0.25 mm i.d.; coated with a film thickness of 0.25 µm) observed for gas chromatography.mass spectrometry (GC-MS).
b Aromatic compounds were detected and selected from the obtained GC-MS data based on previously published studies that identified potent odorants in roasted stem tea (
Sasaki et al., 2017). The compounds were identified according to the RIs of the published papers, Wiley/NIST database mass spectra, and authentic compounds in our database that was created in researching the published papers.
d Optical isomer is unclear.
The loading plot is shown in Fig. 5B. The taste components (i.e., amino acids and most catechins) were observed to be within the high positive PC1 area. Taste compounds decreased with roasting, because the PC1 axis is related with the degree of roasting. Non-epi-type catechins (GCg, Cg, GC, and C) had lower PC1 scores than epi-type catechins (EGCg, ECg, EGC, and EC), which indicates that epi-type catechins, being the major catechins in tea (Lin et al., 1998), changed to non-epitype catechins when heated (Seto et al., 1997). Pyrazines and other aromatic components are represented by gray and closed circles, respectively. Pyrazines had high negative PC1 scores, indicating that they increased with roasting. Maillard reaction produces pyrazines from the amino acids and reducing sugars (Amrani-Hemaimi et al., 1995) during heating. Therefore, pyrazines were at the opposite end of the amino acids along the PC1 axis. We then focused on the PC2 axis on the loading plot, which revealed the effects of roasting temperature on the components in the roasted tea, because PC2 is related with the differences in roasting temperatures along the score plot. More than four-fifths of the components on the loading plot were observed to be within the positive PC2 area. The teas roasted at higher temperatures resulted in higher PC2 score along the score plot, indicating more taste component content. The components with a high PC2 score comprised several characteristic aromatic compounds, such as terpenes (linalool and geraniol) and pyrazines. Therefore, roasting at a higher temperature may be suitable for improving the characteristics of roasted tea.
Changes in major compounds by roasting stem tea We focused on 2-ethyl-3,5-dimethylpyrazine and geraniol as the major odorants to evaluate the changes in the aromatic compounds during roasting. These compounds were used, because they showed a high FD factor in a previous research (Sasaki et al., 2017) and were located within the positive PC2 and negative PC1 area along the loading plot (Fig. 5). The difference in samples roasted at different temperatures was demonstrated within the positive PC2 and negative PC1 score plot areas, indicating that these odorants, which are located in the same loading plot areas, were influenced by roasting temperature.
As shown in Fig. 6, these components increased along with roasting time. Moreover, higher roasting temperatures produced higher amounts of these compounds. Changes in other pyrazines, such as 2-ethyl-3,6-dimethylpyrazine and 2,3,5-trimethylpyrazine, were the same as those in 2-ethyl-3,5-dimethylpyrazine (data not shown). As previously stated, this represents the Maillard reaction, and the increased temperature presumably promoted this reaction, because its reaction rate is temperature-dependent based on the Arrhenius equation (Maillard, 1912; Martins et al., 2001). However, heating also either decomposed the amino acids and reducing sugars or converted them into other compounds. Moreover, high-temperature roasting may have decomposed proteins and increased amino acids that stimulate the Maillard reaction. In any case, greatly increased pyrazine level was observed with increasing roasting temperatures. High-temperature roasting considerably promoted the Maillard reaction and led to pyrazine production in tea. It has been reported that three nitrogen compounds, namely, 2-ethyl-3,5-dimethylpyrazine, 2-ethyl-3,6-dimethylpyrazine, and pyrrole-2-carboxaldehyde, were greatly produced by roasting at 180 °C than at 160 °C (Mizukami et al., 2008). In this study, all of the eight pyrazines tagged as important odorants increased at a higher roasting temperature (i.e., within the range of 180 °C–220 °C). In a previous research on coffee, high-temperature roasting generated several aromatic compounds (Hashim and Chaveron, 1995; Schenker et al., 2006; Franca et al., 2009), and in the research on the model system, the xylose–peptide-derived products created from the Maillard reaction increased with increasing temperature (Lan et al., 2010). The results of these studies agreed with those of the current study, showing the effect of high roasting temperature on Maillard reaction. Moreover, higher roasting temperatures may provide deeper heat penetration within the tea stems, based on SEM images of the tea stems (Fig. 4), and this higher internal heat may promote the production of several more pyrazines.

As shown in Fig. 6, changes in geraniol levels also resulted from increased roasting temperature. The higher the roasting temperatures, the more geraniol is produced. Linalool is also an important terpenoid, because it has a high FD factor (Sasaki et al., 2017), resulting in a high PC2 score in this study (Fig. 5B). The change in linalool was similar to geraniol (data not shown). Higher amounts of both pyrazines and terpenes were produced due to roasting at higher temperatures. A previous research has shown that geraniol and linalool, existing as terpenoid glycosides in green tea, increased during heating through thermal decomposition (Wang et al., 2000; Kumazawa and Matsuda 2001), and these essential oils are present in the tea plant cells (Mulder-Krieger et al., 1988). Heating at high temperatures can promote terpenoid glycoside decomposition and break plant cells, generating more geraniol and linalool.
(Z)-Jasmone, (E)-linalool oxide (pyranoid), β-ionone, coumarin, and indole showed positive PC1 and PC2 scores on the loading plot. These aromatic compounds decreased with roasting time but were not changed by roasting temperature (data not shown); therefore, roasting can decompose these aromatic compounds. On another note, (E)-linalool oxide (furanoid), which was positioned opposite to (E)-linalool oxide (pyranoid) on the score plot, showed negative PC1 and PC2 scores on the loading plot, indicating that (E)-linalool oxide (furanoid) increased with roasting time. Both the furanoid and pyranoid from (E)-linalool oxide are aromatic compounds in tea (Wang et al., 1994). The pyranoid of (E)-linalool oxide increased during roasting, whereas the furanoid of (E)-linalool oxide decreased. The pyranoid of (E)-linalool oxide may be produced more easily from oxidation through heating, compared with furanoid.
We focused on the catechins and amino acids, the major taste components in tea, to evaluate the changes in the taste compounds due to roasting. Fig. 7 shows the changes in catechin levels. The total catechin content is shown as the sum of EGCg, EGC, ECg, EC, GCg, GC, Cg, and C, which was decreased with roasting time. The higher the roasting temperatures, the lower the catechin level. As mentioned, component profiling results indicated that epi-type catechins changed to non-epi-type catechins, and these changes are shown in Fig. 8. Epi-type catechin content is shown as the sum of EGCg, EGC, ECg, and EC, and non-epi-type catechin content is shown as the sum of GCg, GC, Cg, and C. Epi-type catechins accounted for 78% of the total catechins, but they were rapidly decreased with roasting time. The detailed description of its contents is shown in supplemental data (Table S1). On another note, non-epi-type catechins were more slowly decreased with roasting time than epi-type catechins. The slightly increasing non-epi-type catechin level was also observed in the middle of roasting time. Thermal isomerization (Seto et al., 1997), suppressed the decreasing level of non-epi-type catechins, because non-epi-type catechins were generated from epi-type catechins, the major catechins in tea. The changes in gallate- and non-gallate-type catechins are also shown in Fig. 8. Elimination of the gallate group from gallate-type catechins was thought to occur in the roasting process. Gallate-type catechins were rapidly decreased with roasting time, whereas non-gallate-type catechins were slowly decreased. Gallate group elimination through thermal decomposition generated non-gallate-type catechins from gallate-type catechins, which made the decreased non-gallate-type catechins lower than that in the gallate-type catechins. The astringency thresholds of gallate-type catechins were reportedly lower than that of non-gallate-type catechins (Nakagawa, 1970; Rossetti et al., 2009). The rapidly decreasing level of gallate-type catechins may cause to decrease tea astringency during roasting.

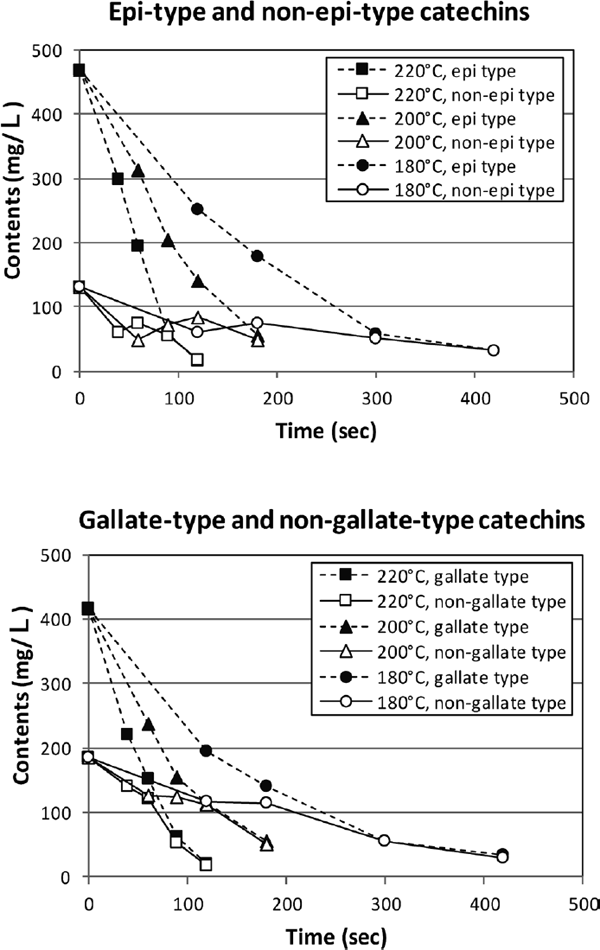
Table S1.
The contents in catechins in tea extracts.
|
|
Contents (mg/L) |
|
|
EGCg |
EGC |
ECg |
EC |
GCg |
GC |
Cg |
C |
| Unroasted |
140 ± 2 |
240 ± 4 |
13 ± 0.3 |
76 ± 2 |
92 ± 2 |
20 ± 0.5 |
11 ± 0.3 |
9 ± 0.2 |
| 220°C |
|
|
|
|
|
|
|
|
|
|
40 s |
86 ± 3 |
150 ± 4 |
8 ± 0.3 |
56 ± 6 |
5 ± 0.1 |
39 ± 2 |
7 ± 0.2 |
10 ± 0.3 |
|
60 s |
63 ± 1 |
94 ± 1 |
4 ± 2 |
35 ± 0.6 |
8 ± 0.4 |
53 ± 1 |
<1 |
14 ± 0.4 |
|
90 s |
18 ± 0.6 |
27 ± 0.8 |
2 ± 0.4 |
12 ± 0.3 |
9 ± 0.4 |
33 ± 1 |
<1 |
14 ± 3 |
|
120 s |
5 ± 0.2 |
7 ± 0.2 |
<1 |
4 ± 0.1 |
3 ± 0.2 |
10 ± 0.1 |
<1 |
6 ± 0.2 |
| 200°C |
|
|
|
|
|
|
|
|
|
|
60 s |
82 ± 1 |
170 ± 4 |
7 ± 0.2 |
54 ± 2 |
3 ± 0.1 |
30 ± 1 |
6 ± 0.2 |
9 ± 0.3 |
|
90 s |
67 ± 1 |
99 ± 2 |
4 ± 0.2 |
36 ± 1 |
7 ± 0.1 |
53 ± 1 |
<1 |
13 ± 0.6 |
|
120 s |
50 ± 1 |
63 ± 2 |
3 ± 1 |
26 ± 0.7 |
10 ± 0.4 |
57 ± 1 |
<1 |
16 ± 0.5 |
|
180 s |
19 ± 0.4 |
25 ± 0.8 |
2 ± 0.5 |
11 ± 0.4 |
7 ± 0.2 |
29 ± 1 |
<1 |
12 ± 0.2 |
| 180°C |
|
|
|
|
|
|
|
|
|
|
180 s |
65 ± 1 |
140 ± 5 |
5 ± 0.1 |
41 ± 0.7 |
3 ± 0.1 |
42 ± 2 |
5 ± 0.1 |
11 ± 0.2 |
|
300 s |
54 ± 1 |
91 ± 6 |
4 ± 0.2 |
31 ± 0.7 |
5 ± 0.1 |
54 ± 3 |
3 ± 1 |
14 ± 0.4 |
|
420 s |
20 ± 0.5 |
26 ± 2 |
2 ± 0.04 |
11 ± 0.4 |
6 ± 0.2 |
33 ± 1 |
<1 |
12 ± 0.6 |
|
540 s |
10 ± 0.5 |
15 ± 1 |
1 ± 0.04 |
6 ± 0.3 |
4 ± 0.1 |
19 ± 1 |
<1 |
9 ± 0.2 |
The mean values ± standard errors obtained from three independent samples are shown.
Fig. 9 shows the changes in amino acid levels. Total amino acid content is shown as the sum of Gln, Glu, Arg, Asp, Ser, Ala, and theanine. In the same manner with catechins, the higher the roasting temperatures, the lower the amino acid level, which rapidly decreased with roasting time. The decrease rate of each amino acid was almost the same in each roasting temperature, whereas Gln, a heat-sensitive compound, was decreased more rapidly than the other amino acids (Table S2). Theanine content, the main amino acid in green tea, was 125 mg/L in unroasted stem tea, which is lower than its taste threshold (1 500 mg/L). Moreover, the Glu content, a low-taste-threshold amino acid, was 31 mg/L in unroasted stem tea, which is lower than its taste threshold (200 mg/L). Furthermore, amino acids were reported to contribute less to the taste of Sencha green tea (Nakagawa et al., 1972; Horie et al., 2002). Amino acids in roasted stem tea contributed less to its taste, because the amino acid content in roasted stem tea was lower than that of unroasted stem tea. On the other hand, amino acids were converted into Maillard reaction products, such as pyrazines, by heating. Amino acids were thought to be more effectively converted into pyrazines by high-temperature roasting, because pyrazines were effectively generated by providing deeper heat penetration within the tea stems.

Table S2.
The amino acid content in tea extracts.
|
|
Contents (mg/L) |
|
|
Theanine |
GluNH2 |
Glu |
Arg |
Asp |
Ser |
Ala |
| Unroasted |
|
125 ± 2.6 |
66 ± 1.0 |
31 ± 0.8 |
27 ± 0.5 |
25 ± 0.7 |
11 ± 0.2 |
5 ± 0.04 |
| 220°C |
|
|
|
|
|
|
|
|
|
40 s |
84 ± 0.1 |
18 ± 0.1 |
20 ± 0.1 |
20 ± 0.2 |
21 ± 1.8 |
8 ± 0.1 |
5 ± 0.1 |
|
60 s |
37 ± 0.02 |
2 ± 0.03 |
8 ± 0.02 |
15 ± 0.1 |
15 ± 0.3 |
5 ± 0.1 |
3 ± 0.1 |
|
90 s |
1 ± 0.02 |
<1 |
<1 |
2 ± 0.04 |
2 ± 0.02 |
1 ± 0.01 |
1 ± 0.02 |
|
120 s |
<1 |
<1 |
<1 |
<1 |
1 ± 0.01 |
<1 |
<1 |
| 200°C |
|
|
|
|
|
|
|
|
|
60 s |
102 ± 0.4 |
31 ± 2 |
24 ± 0.04 |
22 ± 0.5 |
24 ± 0.03 |
10 ± 0.03 |
5 ± 0.1 |
|
90 s |
34 ± 0.1 |
1 ± 0.1 |
7 ± 0.03 |
15 ± 0.1 |
15 ± 0.1 |
5 ± 0.03 |
3 ± 0.1 |
|
120 s |
9 ± 0.05 |
<1 |
2 ± 0.01 |
9 ± 0.2 |
9 ± 0.01 |
2 ± 0.01 |
2 ± 0.01 |
|
180 s |
1 ± 0.04 |
<1 |
<1 |
2 ± 0.04 |
2 ± 0.02 |
<1 |
1 ± 0.01 |
| 180°C |
|
|
|
|
|
|
|
|
|
180 s |
57 ± 0.4 |
<1 |
13 ± 0.2 |
18 ± 0.1 |
19 ± 0.04 |
7 ± 0.2 |
5 ± 0.1 |
|
300 s |
17 ± 0.1 |
<1 |
3 ± 0.01 |
12 ± 0.06 |
12 ± 0.01 |
3 ± 0.01 |
3 ± 0.01 |
|
420 s |
1 ± 0.01 |
<1 |
<1 |
2 ± 0.02 |
2 ± 0.01 |
<1 |
<1 |
|
540 s |
<1 |
<1 |
<1 |
<1 |
1 ± 0.02 |
<1 |
<1 |
The mean values ± standard errors obtained from three independent samples are shown.
Conclusion
In this study, we evaluated the effects of different roasting conditions on the physical appearance, aroma, and taste components of roasted stem tea. The real-time moving paths of the L*a*b* color space values were similarly changed from yellow-green to yellow-red by roasting at 180 °C, 200 °C, and 220 °C for each second, indicating L*a*b* color space values as useful parameters for color change evaluation based on the degree of roasting. Bulk density decreased with increasing temperature, which indicated that the tea stems swelled more at higher temperatures. SEM images revealed that roasting at a higher temperature for a shorter time can effectively induce tea stem swelling. The flavor component profiling led to a more elaborate understanding of how compounds are increased or decreased by roasting. The profiling results revealed that some aromatic compounds, such as pyrazines and terpenes, were effectively generated by high-temperature roasting. Catechins and amino acids were more rapidly decreased with roasting time under higher temperatures. Regarding catechins, epi-type and gallate-type catechins were rapidly decreased with roasting time, whereas non-epi-type and non-gallate-type catechins were more decreased with roasting time, compared epi-type catechins. The rapid decrease in the level of low-astringency-threshold gallate-type catechins may have caused the decreased tea astringency during roasting.
This research first provided comprehensive data on the changes in the sensory components of roasted stem tea during roasting. Roasting has a strong influence on several compounds found in tea, including those that affect its appearance, and this knowledge helps improve the quality of roasted stem tea. These information and approaches can also be effective in improving the quality of roasted tea leaves.
Acknowledgments This work was partially supported by a grant from JSPS KAKENHI Grant-in-Aid for Early-Career Scientists (JP18K14430) to T. Sasaki.
Conflict of interest
None.
References
- Amrani-Hemaimi, M., Cerny, C., and Fay, L. B. (1995). Mechanisms of formation of alkylpyrazines in the Maillard reaction. J. Agric. Food Chem., 43, 2818-2822.
- Baltussen, E., Sandra, P., Frank, D., and Cramers, C. (1999). Stir bar sorptive extraction (SBSE), a novel extraction technique for aqueous samples: Theory and principles. J. High Resolut. Chromatogr., 11, 737-747.
- Borrelli, R. C., Visconti, A., Mennella, C., Anese, M., and Fogliano, V. (2002). Chemical characterization and antioxidant properties of coffee melanoidins. J. Agric. Food Chem., 50, 6527-6533.
- Franca, A. S., Oliveira, L. S., Oliveira, R. C. S., Agresti, P. C. M., and Augusti, R. (2009). A preliminary evaluation of the effect of processing temperature on coffee roasting degree assessment. J. Food Eng., 92, 345-352.
- Hara, T. and Kubota, E. (1973). Changes in aroma components during heating of green tea. J. Jpn. Soc. Food Sci. Technol. (Nippon Syokuhin Kogyo Gakkaiishi), 21, 465-498 (in Japanese).
- Hashim, L. and Chaveron, H. (1995). Use of methylpyrazine ratios to monitor the coffee roasting. Food Res. Int., 28, 619-623.
- Horie, H., Ujihara, T., and Kohata, T. (2002). Contents of organic acids in green teas and their contribution to tea quality. Tec. Res J. (Chagyo Kenkyu Houkoku), 93, 26-33 (in Japanese).
- Kaneko, S., Kumazawa, K., Masuda, H., Henze, A., and Hofmann, T. (2006). Molecular and sensory studies on the umami taste of Japanese green tea. J. Agric. Food Chem., 54, 2688-2694.
- Kawakami, M. and Yamanishi, T. (1999). Formation of aroma components in roasted or pan-fired green tea by roasting or pan-firing treatment. J. Agric. Chem. Soc. Jpn. (Nippon Nōgeikagaku Kaishi), 73, 893-906 (in Japanese).
- Kováts, E. (1958). Gas-chromatographische charakterisierung organischer verbindungen. teil 1: retentionsindices aliphatischer halogenide, alkohole, aldehyde und ketone. Helvetica, 41, 1915-1932.
- Kumazawa, K. and Matsuda, H. (2001). Change in the flavor of black tea drink during heat processing. J. Agric. Food Chem., 49, 3304-3309.
- Lan, X., Liu, P., Xia, S., Jia, C., Mukunzi, D., Zhang, X., Xia, W., Tian, H., and Xiao, Z. (2010). Temperature effect on the non-volatile compounds of Maillard reaction products derived from xylose-soybean peptide system: Further insights into thermal degradation and cross-linking. Food Chem., 120, 967-972.
- Lin, J.-K., Lin, C.-L., Liang, Y.-C., Lin-Shiau, S.-Y., and Juan, I.-M. (1998). Survey of catechins, gallic acid, and methylxanthines in green, oolong, pu-erh, and black teas. J. Agric. Food Chem., 46, 3635-3642.
- Magagna, F., Cordero, C., Cagliero, C., Liberto, E., Rubiolo, P., Sgorbini, B., and Bicchi, C. (2017). Black tea volatiles fingerprinting by comprehensive two-dimensional gas chromatography - Mass spectrometry combined with high concentration capacity sample preparation techniques: Toward a fully automated sensomic assessment. Food Chem., 225, 276-287.
- Maillard, L. C. (1912). Action des acides amines sur les sucres. Formation des melanoidins par voie methodique. Comptes Rendus Hebdomadaires des Séances de l'Académie des Sciences, 154, 66-68.
- Martins, S. I. F. S., Jongen, W. M. F., and Boekel, M. A. J. S. (2001). A review of Maillard reaction in food and implications to kinetic modelling. Trends Food Sci. Technol., 11, 364-373.
- Miyauchi, S., Yuki, T., Fuji, H., Kojima, K., Yonetani, T., Tomio, A., Bamba, T., and Fukusaki, E. (2014). High-quality green tea leaf production by artificial cultivation under growth chamber conditions considering amino acids profile. J. Biosci. Bioen., 118, 710-715.
- Mizukami, Y., Sawai, Y., and Yamaguchi, Y. (2008). Changes in the concentrations of acrylamide, selected odorants, and catechins caused by roasting of green tea. J. Agric. Food Chem., 56, 2154-2159.
- Mulder-Krieger, T. H., Verpoorte, R., Baerheim Svendsen, A., and Scheffer, J. J. C. (1988). Production of essential oils and flavours in plant cell and tissue cultures. A review. Plant Cell. Tiss. Org., 13, 85-154.
- Nakagawa, M. (1970). Relation of catechins with the qualities of green and black tea. Bull. Tea Res. Stat., 6, 65-166 (in Japanese).
- Nakagawa, U., Tamura, S., and Ishima, N. (1972). Studies on the relation of the taste pattern of green tea with its palatability. J. Jpn. Soc. Food Sci. Technol. (Nippon Shokuhin Kogyo Gakkaishi), 19, 475-480 (in Japanese).
- Romani, S., Pinnavaia, G. G., and Dalla Rosa, M. (2003). Influence of roasting levels on ochratoxin A content in coffee. J. Agric. Food Chem., 51, 5168-5171.
- Rossetti, D., Bongaerts, J. H. H., Wantling, E., Stokes, J. R., and Williamson, A.-M. (2009). Astringency of tea catechins: More than an oral lubrication tactile percept. Food Hydrocoll., 23, 1984-1992.
- Sasaki, T. (2017). Odor characteristics of roasted tea. Aroma Research, 69, 9-14. (in Japanese)
- Sasaki, T., Koshi, E., Take, H., Michihata, T., Maruya, M., and Enomoto, T. (2017). Characterisation of odorants in roasted stem tea using gas chromatography–mass spectrometry and gas chromatography–olfactometry analysis. Food Chem., 220, 177-183.
- Sasaki, T., Tanase, Y., Yonezawa, T., Michihata, T., and Kawamura-Konishi, Y. (2018). Metabolomics profiling of roasted stem tea using gas chromatography-mass spectrometry and a sensory test. Food Sci. Technol. Res., 24, 1059-1067.
- Schenker, S., Heinemann, C., Huber, M., Pompizzi, R., Perren, R., and Escher, R. (2006). Impact of roasting conditions on the formation of aroma compounds in coffee beans. J. Food Sci., 67, 60-66.
- Seto, R., Nakamura, H., Nanjo, F., and Hara, Y. (1997). Preparation of epimers of tea catechins by heat treatment. Biosci. Biotechnol. Biochem., 61, 1434-1439.
- Shevchuk, A., Jayasinghe, L., and Kuhnert, N. (2018). Differentiation of black tea infusions according to origin, processing and botanical varieties using multivariate statistical analysis of LC-MS data. Food Res. Int., 109, 387-402.
- Wang, D., Ando, K., Morita, K., Kubota, K., and Kobayashi, A. (1994). Optical isomers of linalool and linalool oxides in tea aroma. Biosci. Biotechnol. Biochem., 58, 2050-2053.
- Wang, D., Yoshimura, T., Kubota, K., and Kobayashi, A. (2000). Analysis of glycosidically bound aroma precursors in tea leaves. 1. Qualitative and quantitative analyses of glycosides with aglycons as aroma compounds. J. Agric. Food Chem., 48, 5411-5418.
- Yamanishi, T., Shimoji, S., Ukita, M., Kawanishima, K., and Nakatani, Y. (1973). Aroma of roasted green tea (Hoji-cha). Agric. Biol. Chem., 37, 2147-2153.
- Zeng, L., Zhou, Y., Fu, X., Mei, X., Cheng, S., Gui, J., Dong, F., Tang, J., Ma, S., and Yang, Z. (2017). Does oolong tea (Camellia sinensis) made from a combination of leaf and stem smell more aromatic than leaf-only tea? Contribution of the stem to oolong tea aroma. Food Chem., 237, 488-498.
- i) https://www.ssnp.co.jp/news/beverage/2018/11/2018-1107-1624-14.html (Apr. 7, 2020)