Review
A review of the radioactive cesium behavior in Japanese agricultural, livestock, fishery products and their foods in the decade following the Fukushima nuclear accident
2021 年 27 巻 1 号 p. 1-23
詳細
2021 年 27 巻 1 号 p. 1-23
A decade has passed since the nuclear power plant accident, caused by the Great East Japan Earthquake, occurred on March 11, 2011. The major radionuclides that were released as a result of the nuclear accident and that contaminated the domestic agricultural, livestock, and fishery products were radioactive iodine (131I) and radioactive cesium (134Cs and 137Cs). The contamination by 131I with a short half-life of 8 days subsided within months of the nuclear accident. On the contrary, radioactive cesium, especially 137Cs, which has a long half-life of 30 years, persists as a long-term contaminant. The level of radioactive substances in domestically produced food, including agricultural, livestock, and fishery products, are monitored using the inspection based on guidelines established by the Nuclear Emergency Response Headquarters and controlled rigorously. In addition, understanding the behavior of radioactive cesium during the processing/cooking of domestic food products will aid in risk management for food safety and risk communication to consumers. Several such studies have been conducted since the nuclear accident. Here, we review the radioactive cesium levels in domestic agricultural, livestock, and fishery products and outline the observations on its behavior in processed/cooked products after the nuclear accident in 2011.
The Great East Japan Earthquake of magnitude 9.0, which was the largest earthquake on record in the history of Japan, occurred on March 11, 2011. It led to extremely destructive tsunami waves, and consequently destroyed the reactor cooling systems of the Fukushima Daiichi Nuclear Power Plant (FDNPP) run by the Tokyo Electric Power Company (TEPCO), which led to the leakage of radioactive vapor and particles in the external environment. Radioactive materials (primarily radioactive iodine 131I, and radioactive cesium 134Cs and 137Cs) diffused into the environment and polluted the ground, mountains, and oceans across the region. A governmental survey reported that, even though the reactors released radiation at significant levels into the atmosphere, the harmful contamination was restricted to a narrow band within 40 km of the power plant, which stretched to the northwest in Fukushima Prefecture (Hirose, 2011).
On March 17, 2011, immediately after the TEPCO-FDNPP accident, the Ministry of Health, Labour and Welfare (MHLW) announced that the “indices relating to limits on food and drink ingestion” established by the Nuclear Safety Commission of Japan would be adopted temporarily as provisional regulation values under the Food Sanitation Act (For more details, see the section “Provisional regulation value, standard limits, and radioactive substance inspection in food”). The Ministry of Agriculture, Forestry and Fisheries (MAFF) announced that radioactive iodine (131I) and radioactive cesium (134Cs + 137Cs) were detected in milk and leafy vegetables such as spinach in Fukushima and the adjacent prefectures between March 19 and 21, 2011 at levels exceeding the provisional regulation values. On March 21, the Japanese government banned the shipment of milk from Fukushima Prefecture as well as of certain other products from Fukushima and three neighboring prefectures.
One year later, the new standard limits for radioactive cesium in foods were enforced on April 1, 2012, which were lower than the provisional regulation values (for more details, see “Provisional regulation value, standard limits, and radioactive substance inspection in food products”). If the contamination levels in any sample exceed the standard limit, all food products from the same lot are recalled and disposed of, under the Food Sanitation Act. Radioactive substances in domestically produced foods, including agricultural, livestock, and fishery products, are monitored using this process and controlled rigorously.
In the short term, the major concern was contamination by 131I, which can cause cancer in the thyroid gland. The environmental 131I levels subsided from the environment in a matter of months owing to its short half-life (8 days). Therefore, this nuclide does not pose an issue at present. The half-life of 134Cs is 2 years and currently it holds less than 5% of the initial radioactivity. On the contrary, radioactive cesium, especially 137Cs, has a long half-life of 30 years and will persist for a considerably longer period. Therefore, this nuclide poses a long-term contamination issue (Hachinohe et al., 2015).
Since the nuclear accident, agricultural lands have been decontaminated, and technology for suppressing the adsorption of radioactive cesium into agricultural products has been introduced at cultivation sites. With these efforts, the number of agricultural, livestock, and fishery products that contain contaminants at levels that exceed the standard limit has reduced drastically over the years, except for products derived from certain wild animals and wild edible plants. Moreover, the environmental pollution around the TEPCO-FDNPP has gradually reduced with help from the decontamination measures of the government (Fig. 1).

Temporal changes in the distribution map of air dose rate around the TEPOCO-FDNPP.
This figure is a partial modification of the source data obtained from the extension site of the distribution map of radiation dose published by the Geospatial Information Authority of Japan xi).
Understanding the behavior of radioactive cesium during the processing/cooking of domestic agricultural, livestock, and fishery products will aid risk management for food safety and risk communication to consumers. Several such studies have been performed since the nuclear accident (see “The data from the TEPCO-FDNPP accident on the radioactive cesium behavior in food processing/cooking of the domestic ALF products”). Here, we review the radioactive cesium levels in domestic products and the study of their behavior during the processing/cooking of these products during the decade following the nuclear accident in 2011.
The parameters referred to in this review are those defined in the International Atomic Energy Agency (IAEA) Technical document (IAEA, 2009), as follows. The processing factor, Pf, is the ratio between the radionuclide activity concentrations (Bq/kg) in a given food item when ready for consumption and the activity concentration before processing and preparation. The food processing retention factor, Fr, is the ratio between the total quantity of a radionuclide in a given food item when ready for consumption and the total quantity of the radionuclide in the raw food before processing and preparation. The processing efficiency, Pe, is the ratio between the fresh weight of the processed food and the weight of the original raw material.
In addition, the following abbreviations have been used in this review: the Fukushima Daiichi Nuclear Power Plant run by the Tokyo Electric Power Company, TEPCO-FDNPP; Ministry of Agriculture, Forestry and Fisheries, MAFF; Ministry of Health, Labour and Welfare, MHLW; Agricultural, livestock, and fishery products, ALF products; Market basket method, MB method; Duplicate diet method, DD method; Codex Alimentarius Commission, CODEX; Fiscal year, FY.
Provisional regulation value, standard limits, and radioactive substance inspection in food products On March 17, 2011, one week after the nuclear accident, based on the Food Sanitation Act, the MHLW announced that the “indices relating to limits on food and drink ingestion” published by the Nuclear Safety Commission of Japan would be adopted temporarily as provisional regulation values (Notice No. 0317 Article 3, MHLW).
Approximately one year later, to ensure further food safety and security, the new standard limits for radioactive cesium levels in food products were reestablished (Notice No. 0315 Article 1, MHLW, March 15, 2012; Enforcement from April 1, 2012). These new standard limits were set to ensure that the annual dose of radioactive cesium in food that can be tolerated did not exceed 1 mSv/year, which is the intervention exemption level of the CODEX. In addition, the standard limits were set based on discussions at the Pharmaceutical Affairs and Food Sanitation Council of MHLW, the Food Safety Commission, and the Radiation Council. The provisional regulation values and standard limits are outlined in Table 1. The Japanese standard limits are lower than those of CODEX (Infant foods and general foods, 1 000 Bq/kg; CODEX/STAN 193-1995) and the U.S.A. (All foods, 1 200 Bq/kg; Compliance Policy Guide Sec. 560.750) for radioactive cesium.
| Regulation | Nuclide | Category 1 | Limit (Bq/kg) |
|---|---|---|---|
| Provisional regulation values Date of enforcement: March 17, 2011 | Radioactive iodine (Representative radionuclides among mixed radionuclides: 131I) | Drinking water, milk, dairy products | 300 |
| Vegetables (Except root vegetables and tubers) | 2 000 | ||
| Radioactive cesium | Drinking water, milk, dairy products | 200 | |
| Vegetables, grains, meat, eggs, and fish among others | 500 | ||
| Standard limits Date of enforcement: April 1, 2012 | Radioactive cesium (Total concentration of 134Cs and 137Cs) | Drinking water | 10 |
| Milk, infant food | 50 | ||
| General food | 100 |
Following the establishment of the provisional regulation values (the standard limits from April 1, 2012), the inspection of radioactive substances in domestic food products commenced in municipalities from March 18, 2011. The Nuclear Emergency Response Headquarters was established, and guidelines for the inspection of radioactive substances in domestic food products were published based on the Act on Special Measures Concerning Nuclear Emergency Preparedness i). The guidelines include policies regarding the following items: target municipality and its areas, target items, inspection frequency, inspection plan formulation, inspection plan publication and report, measures based on inspection results, selection of items/areas subject to shipping restrictions/intake restrictions by the government, and cancellation of selected items/areas subject to shipping restrictions/intake restrictions by the government. Municipalities formulate inspection plans and carry out inspections in accordance with this guideline.
Under these guidelines, when the contamination in an item exceed the provisional regulation values (the standard limits established since April 1, 2012), all food products from the same lot are collected and discarded to prevent the distribution of such food items in the market. Moreover, shipping restrictions are imposed on the item in the production area based on the guideline when a regional spread is confirmed in the production areas of food with contamination exceeding the provisional regulation values (or the standard limits), and intake restriction are imposed on the item in the production area based on the guidelines when items with extremely high contamination are detected.
Inspection areas and inspection items On April 4, 2011, 11 prefectures (Fukushima, Ibaraki, Tochigi, Gunma, Miyagi, Yamagata, Niigata, Nagano, Saitama, Chiba, and Tokyo) were selected as the target municipalities for inspection. Afterwards, based on the radioactive contamination in food, six prefectures (Kanagawa, Yamanashi, Shizuoka, Iwate, Akita, and Aomori) were added to this list till August 4, 2011, and eventually, 17 prefectures located in eastern Japan were selected as the target municipalities for inspection (Fig. 2).
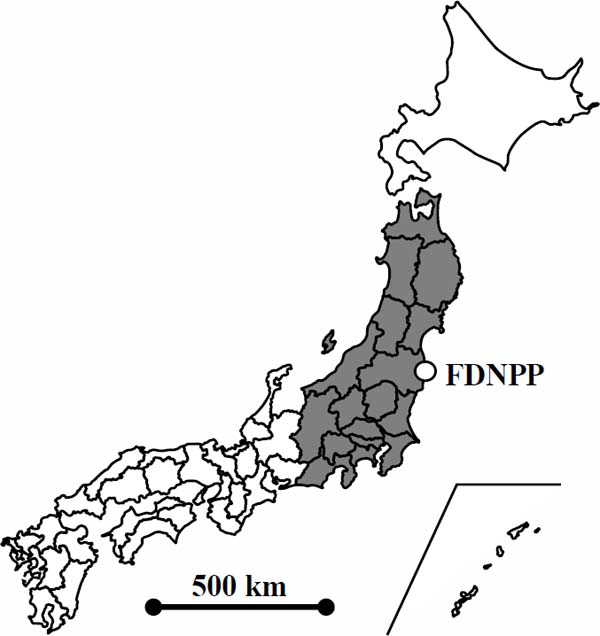
Prefectures selected for the inspection for radioactive materials in food.
The filled areas indicate 17 prefectures in which the government prescribed conducting the inspection; Aomori, Iwate, Miyagi, Akita, Yamagata, Fukushima, Ibaraki, Tochigi, Gunma, Saitama, Chiba, Tokyo, Kanagawa, Niigata, Yamanashi, Nagano, and Shizuoka.
Items with contamination levels that exceeded the provisional regulation values (or the standard limits), or exceeded half of the regulatory values in the inspection result of the previous year, and items with contamination levels that were likely to exceed the provisional regulation values (or the standard limits) were targeted during inspection. In addition, the production specificity of each municipality was considered while selecting the inspection items. According to the inspection results after FY2013, the percentage of items with contamination exceeding the standard limits was approximately 0% for most items (for more details, refer to the corresponding section below) ii), and items in which contamination exceeded the standard limits were almost limited to specific ones. The Japanese FY starts on April 1 and ends on March 31 of the following year. Therefore, in consideration of these observations, the inspection system was revised during the revision of the guidelines on March 25, 2017.
Since FY2017, the inspection items have been classified into three groups: Group 1, the items for which cultivation/feeding can be managed; Group 2, the items for which management of cultivation/feeding is difficult; and Group 3, log-grown mushrooms. In Group 1, continued inspection is required for the item only when an item with contaminant concentration exceeding half of the standard limit was detected in the inspection result from the previous 3 years. This revision facilitated the rationalization and streamlining of the inspection of Group 1 iii). Conversely, for Groups 2 and 3, as in the past, 17 prefectures were selected as the target municipalities for inspection, and intensive inspection has been continued iv). Food products that are classified under Group 1 include vegetables, potatoes, fruits, seeds, rice, wheat, beans, millet, meats, eggs, raw milk, tea (drinking state), mushrooms (cultivation, except log-grown mushrooms), and wild edible plants (cultivation). Food products that are classified under Group 2 include mushrooms (wild), wild edible plants (wild), wild meats, fishery products, and honey.
Effect of radioactive iodine contamination on food immediately after the accident Radioactive 131I released into the environment after the TEPCO-FDNPP accident was a specific problem during the early stages after the accident in terms of health and environmental effects. The quantity of radioactive iodine released in this accident is estimated to be less than 30% of the quantity released during the Chernobyl nuclear accident. Because radioactive iodine accumulates in the thyroid gland, the thyroid gland is exposed to beta and gamma radiation for a while, which increases the risk of thyroid cancer. As an after-effect of the Chernobyl nuclear accident in 1986, several children developed thyroid cancer after exposure to high levels of radioactive iodine in milk and from other sources owing to delays in the regulation of the levels of radioactive substances in food. Approximately 4,000 individuals under the age of 18 years at the time of the accident developed cancer. Fifteen of them died, whereas the rest were reported to have survived (Kaneko, 2007).
In the Chernobyl nuclear accident, early evacuation and restriction of food intake were not implemented properly. However, in the aftermath of the TEPCO-FDNPP accident, radiation protection measures were implemented immediately (early evacuation and restrictions on intake of food contaminated with radioactive materials among others), which reduced the possibility of exposure to radiation by a factor of 10, and consequently resulted in low or significantly low exposure among the Japanese population. Radioactive 131I, which has a short half-life of 8 days, was removed effectively from the environment within few months of the nuclear accident. Radioactive iodine was undetectable after half a year of the accident. Therefore, it is unlikely that there will be an increase in the incidence of cancer or other health problems caused by radioactive 131I v).
Annual change in radioactive cesium levels in ALF products Based on the results of the inspection of radioactivity levels in ALF products vi) by MAFF, Table 2 outlines the inspection results according to the category of products for 9 years from FY2011 to FY2019.
| Category | FY1 | Total number of samples inspected | Samples with contamination above the maximum limit (> 100 Bq/kg)2 | Violation | No. of items in which radioactive cesium above the maximum limit was detected or comment |
|---|---|---|---|---|---|
| Rice | 2011 | 26,464 | 592 (39) | 2.2% (0.15%) | No rice samples with contamination above the maximum limit for radioactive cesium has been detected since 2015. |
| 2012 | 10.4 million | 84 | 0.0008% | ||
| 2013 | 11 million | 28 | 0.0003% | ||
| 2014 | 11 million | 2 | 0.00002% | ||
| 2015 | 10.4 million | 0 | 0% | ||
| Wheat | 2011 | 557 | 27 (1) | 4.8% (0.18%) | No wheat and barley samples with contamination above the maximum limit for radioactive cesium has been detected since 2012. |
| 2012 | 1,818 | 0 | 0% | ||
| Buckwheat | 2011 | 330 | 3 (0) | 0.9% (0%) | No buckwheat samples with contamination above the maximum limit for radioactive cesium has been detected since 2013. |
| 2012 | 2,918 | 14 | 0.5% | ||
| 2013 | 1,001 | 0 | 0% | ||
| Soybean | 2011 | 534 | 16 (0) | 3.0% (0%) | No soybean samples with contamination above the maximum limit for radioactive cesium has been detected since 2015. |
| 2012 | 5,633 | 61 | 1.1% | ||
| 2013 | 4,639 | 21 | 0.5% | ||
| 2014 | 3,058 | 4 | 0.13% | ||
| 2015 | 1,371 | 0 | 0% | ||
| Other pulses | 2011 | 155 | 0 | 0% | |
| 2012 | 329 | 2 | 0.6% | Azuki bean | |
| 2013 | 443 | 0 | 0% | No other pulses samples with contamination above the maximum limit for radioactive cesium has been detected since 2012. | |
| Vegetables | 2011 | 12,671 | 385 (139) | 3.0% (1.1%) | 33 (Spinach, lettuce, broccoli, turnip, cabbage, green onion, and parsley among others) |
| 2012 | 18,570 | 5 | 0.03% | 5 (Spinach, lotus root, Angelica keiskei, arrowhead, and Japanese mustard spinach) | |
| 2013 | 19,657 | 0 | 0% | No vegetables samples with contamination above the maximum limit for radioactive cesium has been detected since 2013. | |
| Fruits | 2011 | 2,732 | 210 (28) | 7.7% (1.0%) | 20 (Fig, persimmon, Japanese chestnut, Ume (Japanese apricot), blueberry, peach, Yuzu (Japanese citron), and mandarin orange among others) |
| 2012 | 4,478 | 13 | 0.3% | 5 (Japanese chestnut, Ume (Japanese apricot), blueberry, Yuzu (Japanese citron), and mandarin orange) | |
| 2013 | 4,243 | 0 | 0% | No fruits samples with contamination above the maximum limit for radioactive cesium were detected between 2013 and 2016. | |
| 2017 | 1,579 | 1 | 0.06% | Japanese chestnut | |
| 2018 | 1,296 | 0 | 0% | No fruits samples with contamination above the maximum limit for radioactive cesium were detected in 2018 and 2019. | |
| Mushrooms and wild edible plants | 2011 | 3,856 | 779 (228) | 20% (5.9%) | 24 (Log-grown shiitake (outdoor cultivation), wild mushrooms, ostrich fern, bamboo shoot, butterbur sprout, bracken, walnuts, and dried shiitake among others) |
| 2012 | 6,588 | 605 | 9.2% | 25 (Log-grown shiitake (outdoor cultivation), wild mushrooms, ostrich fern, bamboo shoot, butterbur sprout, bracken, walnuts, and dried shiitake among others) | |
| 2013 | 7,581 | 194 | 2.6% | 15 (Log-grown shiitake (outdoor cultivation), wild mushrooms, ostrich fern, bracken, bamboo shoot, and dried shiitake among others) | |
| 2014 | 8,557 | 103 | 1.2% | 13 (Log-grown shiitake (outdoor cultivation), butterbur sprout, ostrich fern, bracken, osmund, bamboo shoot, and wild mushrooms among others) | |
| 2015 | 8,433 | 87 | 1.0% | 11 (Bamboo shoot, ostrich fern, osmund, dried shiitake, and wild mushrooms among others) | |
| 2016 | 9,241 | 69 | 0.75% | 9 (Bamboo shoot, ostrich fern, bracken, wild mushrooms, and dried bracken among others) | |
| 2017 | 7,885 | 54 | 0.68% | 7 (Log-grown shiitake (outdoor cultivation), wild mushrooms, bamboo shoot, and ostrich fern among others) | |
| 2018 | 7,571 | 133 | 1.8% | 21 (Bamboo shoot, bracken, yellow mushroom, jersey cow mushroom, matsutake mushroom, and deceiver among others) | |
| 2019 | 6,034 | 90 | 1.5% | 6 (Bamboo shoot, bracken, osmund, and wild mushrooms among others) | |
| Beef | 2011 | 78,095 | 1,052 (157) | 1.3% (0.2%) | No beef samples with contamination above the maximum limit for radioactive cesium were detected between 2013 and 2016. Inspection data not available after 2016 |
| 2012 | 153,238 | 6 | 0.004% | ||
| 2013 | 163,767 | 0 | 0% | ||
| Pork | 2011 | 485 | 6 (0) | 1.2% (0%) | No pork above samples with contamination the maximum limit for radioactive cesium were detected between 2013 and 2016. Inspection data unavailable after 2016 |
| 2012 | 863 | 1 | 0.12% | ||
| 2013 | 619 | 0 | 0% | ||
| Chicken meat | 2011 | 199 | 0 | 0% | No chicken meat samples with contamination above the maximum limit for radioactive cesium were detected between 2011 and 2016. Inspection data unavailable after 2016 |
| 2012 | 307 | 0 | 0% | ||
| 2013 | 263 | 0 | 0% | ||
| Egg | 2011 | 382 | 0 | 0% | No egg samples with contamination above the maximum limit for radioactive cesium were detected between 2011 and 2016. Inspection data unavailable after 2016 |
| 2012 | 425 | 0 | 0% | ||
| 2013 | 311 | 0 | 0% | ||
| Fishery products (Marine species) | 2011 | 7,730 | 1189 (196) | 15.4% (2.5%) | 25 (Sand eel, baby sardine, hizikia, flounder, and Japanese rockfish among others) |
| 2012 | 15,345 | 842 | 5.5% | 35 (Spotbelly rockfish, frog flounder, Pacific cod, sea bass, and greenling among others) | |
| 2013 | 17,387 | 193 | 1.1% | 22 (Pacific cod, sea bass, greenling, black seabream, common skete, and flounder among others) | |
| 2014 | 17,747 | 50 | 0.3% | 10 (stone flounder, black seabream, common skete, and Japanese stingfish among others) | |
| 2015 | 16,378 | 0 | 0% | No marine species with contamination above the maximum limit for radioactive cesium were detected between 2015 and 2017 and in 2019. | |
| 2018 | 11,808 | 1 | 0.008% | Common skete | |
| Fishery products (Freshwater species) | 2011 | 1,141 | 231 (56) | 20.3% (4.9%) | 21 (Carp, masu trout, pond smelt, Japanese char, and sweetfish among others) |
| 2012 | 3,378 | 251 | 7.4% | 18 (Masu trout, pond smelt, Japanese char, sweetfish, eel, and red salmon among others) | |
| 2013 | 3,308 | 109 | 3.3% | 12 (Masu trout, pond smelt, Japanese char, sweetfish, and eel among others) | |
| 2014 | 2,219 | 50 | 2.3% | 10 (Japanese char, carp, red salmon, and langsdorfii among others) | |
| 2015 | 1,052 | 14 | 1.3% | 6 (Japanese char, carp, and sweetfish among others) | |
| 2016 | 2,238 | 11 | 0.5% | 5 (Japanese char, carp, eel, brown trout) | |
| 2017 | 2,053 | 11 | 0.5% | 3 (Japanese char, brown trout) | |
| 2018 | 2,113 | 5 | 0.2% | 2 (Masu trout, Japanese char) | |
| 2019 | 2,184 | 6 | 0.3% | 2 (Masu trout, Japanese char) |
(1) Rice
Rice is the staple food for the Japanese population. In April 2011, in view of effects of the nuclear accident in March 2011, the MAFF announced the establishment of restricted areas for rice planting, taking into account that the rice plantation season would follow soon. This was based on the assumption that the transfer coefficient of radioactive cesium from soil to brown rice is 0.1 (fairly safe estimate), and the upper limit of radioactive cesium concentration in soil was set at 5 000 Bq/kg to ensure that the radioactive cesium concentration in brown rice was lower than the provisional regulation value (500 Bq/kg). As a result, the detection rate for product with contamination exceeding the provisional regulation value was kept quite low (0.15%). In Fukushima Prefecture and a part of Miyagi Prefecture, all bags containing 30 kg of brown rice were to be inspected prior to shipment starting from the harvest season in 2012, and the number of inspections increased significantly; however, the percentage of rice with contamination exceeding the standard limit of 100 Bq/kg was considerably lower than that in rice from 2011. Since FY2015, rice with contamination exceeding the standard limit has not been detected.
(2) Wheat
Immediately after the accident, radioactive cesium was deposited on or adhered to growing crops, which resulted in 27 cases of wheat harvested in 2011 having contamination above the standard limit, of which the provisional regulation value was exceed in only a single case. Since FY2012, wheat with contamination exceeding the standard limit has not been detected.
(3) Buckwheat
In FY2011 and FY2012, the percentages of buckwheat with contamination exceeding the standard limit were 0.9% and 0.5%, respectively. Since FY2013, buckwheat with contamination exceeding the standard limit has not been detected.
(4) Soybean and other pulses
In FY2011, the contamination in some soybeans (16/534) was found to exceed the standard limit value owing to the absorption of radioactive cesium from the roots.
A percentage of soybeans with contamination that exceeded the standard limit was detected till 2014 and decreased every year. Since FY2015, soybean with contamination exceeding the standard limit has not been detected.
Two cases of azuki bean with contamination exceeding the standard limit were reported in FY2012, whereas other pulses with contamination exceeding the standard limit have not been detected since FY2013.
(5) Vegetables
Immediately after the accident, radioactive materials were deposited on or adhered to the growing vegetables, which led to 385 cases with contamination exceeding the standard limit (3%) in FY2011, of which in 139 cases (1.1%), the levels exceeded the provisional regulation value. Ninety four percent of the cases in which the standard limit was exceeded were inspected between March and June 2011. In addition, after the accident, the percentage of vegetables in which contamination exceeded the standard limit was remarkably low for vegetables grown by tilling. The percentage of items in which contamination exceeded the standard limit was significantly lower in FY2012 than in FY2011. Since FY2013, vegetables with contamination exceeding the standard limit have not been detected.
(6) Fruits
In FY2011, in nearly 10% (210/2 732) of the cases, the standard limit was exceeded due to the effects of radioactive cesium fallout and deposition on trees immediately after the accident. In particular, relatively high levels of radioactive cesium were detected in fruits (e.g., plum, citrus, and loquat among others) present with flowers or had leaves or young fruits in mid- to late-March 2011, immediately after the nuclear accident. The contamination exceeded the standard limit in a considerably low number of fruits in FY2012 (13/4 478); the contamination in none of the fruits has exceeded the standard limit since FY2013, with the exception of one case of a chestnut sample in FY2017.
(7) Mushrooms and wild edible plants
In FY2011, the contamination in 20% of the samples exceeded the standard limit (that in 5.9% of the samples exceeded the provisional regulation value); however, the percentage of samples in which contamination exceeded the standard limit has been decreasing every year. Owing to the difficulty of forest decontamination, wild mushrooms and wild edible plants have accounted for the majority of species in which contamination exceeded the standard limit since FY2013, including bamboo shoots, cod sprouts, osmunds, and butterbur sprouts.
(8) Raw milk, meat, and eggs
The contamination in some samples of raw milk was found to exceed the provisional regulation value of 200 Bq/kg at the shortly after the TEPCO-FDNPP accident; however, since April 2011, contamination above the standard limit of 50 Bq/kg has not been reported in any milk sample.
Owing to a significant dependence on imported feed such as corn in the breeding of chickens, contamination in poultry meat or eggs exceeding the standard limit were not reported immediately after the accident.
Six cases of contamination in pork meat exceeding the standard limit were reported in FY2011 (1.2%), and one case was reported in FY2012 (0.12%); however, no such incident has been reported since FY2013.
In FY2011, the contamination exceeded the standard limit in 1052 (1.3%) beef products, of which the contamination in 157 (0.2%) were above the provisional regulation value. In July 2011, cases of radioactive cesium in food exceeding the provisional regulation values were reported in beef from cattle at various locations. This primarily resulted from the use of rice straw contaminated with radioactive cesium as feed. The MAFF reviewed the provisional tolerance values for radioactive cesium in feeds to ensure that meat and milk products did not contain radioactive cesium at levels exceeding the standard limit (100 Bq/kg of meat and 50 Bq/kg of milk), and established the new provisional tolerance values for radioactive cesium in feeds as 100 Bq/kg for cattle, 80 Bq/kg for pigs, 160 Bq/kg for poultry, and 40 Bq/kg for farmed fish. The effect of these measures was evident, and the percentage of beef with contamination that exceeded the standard limit reduced significantly in FY2012 (0.004%), and no such case with contamination exceeding standard limit has been reported since FY2013.
(9) Fishery products
Since the TEPCO-FDNPP accident occurred adjacent to the coast, radioactive materials were released into the ocean by fallout from the atmosphere and contaminated water, which were subsequently diffused and diluted by large quantities of seawater and gradually precipitated on the seafloor. In addition, the radioactive materials were gradually transferred to rivers, lakes, and marshes by rain and snowmelt, and eventually flowed into the sea or precipitated at the bottom of lakes.
Since the Japanese population consumes a large quantity of fish products as a major source of protein, radioactive contamination of marine and freshwater fish species has been a major concern for consumers.
In FY2011, the contamination in 15.4% of the marine species exceeded the standard limit and in 2.5% exceeded the provisional regulation value; however, the number of species with contamination exceeding the standard limit decreased with time. In terms of habitat and fish species, high values exceeding the provisional regulation value were observed immediately after the accident among surface fishes (e.g., squid, octopus, baby sardine, and sand eel); however, these values declined rapidly afterwards. The contamination in migratory fish, such as saury and salmon, did not exceed the standard limit when measured immediately after the accident. Since FY2015, marine species with contamination exceeding the standard limit have not been detected, with the exception of one case of common skete in FY 2017. In Fukushima Prefecture, coastal fishing and bottom trawling, except for test operations, continue to be restrained (at the time of manuscript preparation; September, 2020).
The contamination in approximately 20% of freshwater species exceeded the standard limit, and in approximately 5% exceeded the provisional standard value in FY2011. Since FY2012, the percentage of cases with contamination exceeding the standard limit has gradually reduced. The samples with contamination in excess of the standard limit in FY2018 and FY2019 were clear fish, Japanese char, and masu trout from Fukushima Prefecture.
Dietary intake of radioactive cesium in Japan after the TEPCO-FDNPP accident There are several research reports on the estimation of the committed effective dose of radioactive cesium in foods as a result of the TEPCO-FDNPP accident. In these studies, the MB method and DD method were used to investigate the committed effective dose in the diet. According to Takizawa et al. (2016), 25 surveys were conducted using the DD method and 14 using the MB method till June 2015.
Fig. 3 shows the annual change in the committed effective dose owing to dietary radioactive cesium contamination determined by the MB method, which was plotted based on the annual committed effective dose monitoring results by MHLW vii). The monitoring area comprised of 3 municipalities in 2011, which increased to 12 municipalities in Feb.–Mar., 2012; 15 municipalities have been considered since Sep.–Oct., 2012 (Fig. 4). The estimated annual committed effective doses for Miyagi and Fukushima-Nakadori in Sep.–Oct., 2011 were 0.017 mSv/year and 0.019 mSv/year, respectively. These were the highest values among those recorded across all monitoring periods; however, they were less than 2% of the upper limit of the annual additional individual dose of 1 mSv/year. The estimated annual committed effective doses in areas in eastern Japan (prefectures; Iwate, Miyagi, Fukushima, Tochigi, Ibaraki, Saitama, Tokyo, Kanagawa, and Niigata), which experienced the greatest impact of radioactive contamination, have been decreasing gradually. By 2016, the doses in all areas were below 0.002 mSv/year, and there was no obvious difference in the estimated annual committed effective doses for 15 areas. The MHLW reported that the committed effective dose from diet based on this monitoring method is significantly low compared to the intervention exemption level (1 mSv/year) that was the basis for establishing the standard limits as well as the committed effective dose determined using radioactive potassium naturally present in food (approximately 0.2 mSv/year) vii).

Annual committed effective dose of radioactive cesium (134Cs + 137Cs) by ingestion across 7 regions in Japan from 2011 to 2019.
Summary of results adopted from the monitoring results published by the Ministry of Health, Labor and Welfare vii). Monitoring was performed using the MB method, and the annual committed effective dose determined based on the level of radioactive cesium in food intake was estimated for food products that were distributed across the 15 regions (13 prefectures). This figure shows the monitoring results of only 7 regions. The lack of data implies that samples could not be obtained during the particular time period.

Regions selected for monitoring the annual committed effective dose of radioactive cesium by ingestion conducted by the Ministry of Health, Labour and Welfare.
Table 3 outlines the results of the monitoring of the committed effective dose based on radioactive cesium present in the diet using the DD method, which is being conducted at the Fukushima radiation monitoring room since FY2012 viii). From FY2012 to FY2016, samples were collected uniformly from seven areas in Fukushima Prefecture (Fig. 5). Since 2017, monitoring has been conducted primarily in areas where evacuation orders have been lifted. The sample is a mixture of all foods consumed for one day by one person. Table 3 shows the maximum daily dietary value for each monitoring fiscal year. The highest radioactive cesium concentration in diet sample recorded during the survey period was 150 Bq/kg in FY2012 (Kenhoku area). Fukushima Prefecture reported that wild mushrooms and self-cultivated ingredients were used for this diet, and that the use of these ingredients was the primary factor for detecting the high levels of radioactive cesium viii). Excluding this high concentration sample, the highest estimated dose among all monitoring periods was 0.12 mSv/year, which was almost one-tenth of 1 mSv/year. In addition, estimates of dietary committed effective doses of radioactive cesium have been shown to decrease every year. Although the value reported is marginally higher than the MHLW estimate determined by the MB method, it is also significantly low compared to 1 mSv/year.
| Fiscal year | Sample size | Maximum value | ||
|---|---|---|---|---|
| Radioactive cesium (134Cs + 137Cs) | ||||
| Bq/kg | Bq/day | mSv/year | ||
| 2012 | 309 | 150 (5.6) | 380 (22) | 2.1 (0.12) |
| 2013 | 398 | 3.2 | 5.2 | 0.028 |
| 2014 | 104 | 0.75 | 2 | 0.01 |
| 2015 | 104 | 5.4 | 6 | 0.023 |
| 2016 | 100 | 1.6 | 4.2 | 0.016 |
| 2017 | 19 | 0.37 | 1.1 | 0.0057 |
| 2018 | 20 | 0.52 | 1.7 | 0.0082 |
| 2019 | 21 | 0.17 | 0.44 | 0.0021 |
Adopted from the monitoring results summarized by the Fukushima radiation monitoring room viii). Monitoring was conducted using the DD method. The sample is a mixture of all foods consumed for one day by one person. The table shows the maximum daily dietary value for each monitoring fiscal year. The numbers in parentheses indicate the values excluding one case, in which a sample containing wild mushrooms and self-cultivated ingredients was considered.

The 7 districts selected for monitoring of the annual committed effective doses based on radioactive cesium concentration by ingestion in Fukushima. The 7 districts are classified into 3 regions, Hama-dori, Naka-dori, and Aizu, in Fukushima Prefecture. Sousou and Iwaki are Hama-dori, Kenhoku, Kenchu, and Kennan are Naka-dori, and Aizu and Minami-aizu are Aizu.
There are cases related to the use of wild edible plants, wild mushrooms, and homegrown produce that continue to demand attention. Fukushima Prefecture has established measuring stations for self-consumable food in municipalities for residents of the prefecture. The residents can check whether the radioactive cesium concentration in food exceeds the standard limits at the stations ix).
Data from the Chernobyl nuclear accident on the behavior of radioactive cesium during the processing/cooking of ALF products Several studies had been conducted on the behavior of radioactive cesium during the processing/cooking of ALF products prior to the TEPCO-FDNPP accident, and the reports of such studies related to the Chernobyl nuclear accident in 1986 could serve as an important source of information (Fesenko et al., 2007) for Japanese studies (Table 4).
| Countermeasure | Pf for 137Cs |
|---|---|
| Processing grain to flour | 0.3–0.9 |
| Processing grain to bran | 3 |
| Washing of vegetables, berry and fruits | 0.8–0.9 |
| Boiling of vegetables, berry, and fruits | 0.5–0.8 |
| Pickling of vegetables and fruits | 0.2–0.9 |
| Processing of vegetables, berry, and fruits to juice | 0.4–1 |
| Processing of beet to sugar | 0.01–0.08 |
| Processing of potatoes to starch | 0.12–0.17 |
| Washing of mushrooms | 0.4 |
| Boiling of mushrooms | 0.1–0.3 |
| Soaking of mushrooms | 0.1 |
| Pickling of mushrooms | 0.1–0.2 |
| Processing of milk to butter | 0.2–0.3 |
| Processing of milk to cream (10–30% fat) | 0.7–0.9 |
| Processing milk to condensed milk | 2.7 |
| Processing milk to powdered milk | 8 |
| Processing of milk to cheese (rennet) | 0.5–0.6 |
| Processing of milk to casein | 0.03 |
| Boiling of meat | 0.1–0.5 |
| Soaking of meat | 0.02–0.7 |
| Processing of rapeseed to oil | 0.004 |
| Brewing of the Turkish tea | 0.20–0.35 |
| Washing of mushrooms | 0.71–0.91 |
This table summarizes the data from the following references; Fesenko et al. (2007), Zehringer et al. (2018), and Steinhauser and Steinhauser (2016).
However, in March 2011, there were few reports regarding such studies conducted using domestic ALF products. In particular, there was limited research data on Japanese-specific methods for processing/cooking of indigenous ALF products used in the traditional Japanese cuisine called “Washoku.”
Data from the TEPCO-FDNPP accident on behavior of radioactive cesium during the processing/cooking of domestic ALF products With respect to domestic ALF products internally contaminated with radioactive cesium owing to the TEPCO-FDNPP accident, we studied reports on the behavior of radioactive cesium during food processing/cooking published from 2012 to 2020. Table 5 shows the reported Pf values of radioactive cesium during the processing/cooking processes of domestic ALF products. This chapter outlines, based on research examples, three factors that can alter the radioactive cesium concentration during processing/cooking processes commonly used in households and food manufacturing companies: (1) removal of inedible parts, (2) elution into an aqueous solution, and (3) total mass change.
| Category | Item 1 | Processing/cooking methods | Raw materials | Food product | Pf 2 | n |
|---|---|---|---|---|---|---|
| Grains | Wheat | Milling | Unpolished wheat | Flour | 0.4 | 6 |
| Bran | 2.1 | 5 | ||||
| Noodle making | Flour | Fresh Udon noodles (thick noodles: 2.5 mm × 3.0 mm) | 0.7 | 3 | ||
| Fresh Udon noodles (thin noodles: 1.5 mm × 1.5 mm) | 0.7 | 3 | ||||
| Dried Udon noodles (thick noodles: 1.8 mm × 3 mm) | 1.0 | 3 | ||||
| Dried Udon noodles (thin and round noodles: diameter 1.1 mm) | 1.0 | 3 | ||||
| Chinese noodles | 0.8 | 3 | ||||
| Boiling | Fresh Udon noodles (thick noodles) | Boiled noodles | 0.06 | 3 | ||
| Fresh Udon noodles (thin noodles) | 0.08 | 3 | ||||
| Dried Udon noodles (thick noodles) | 0.06 | 3 | ||||
| Dried Udon noodles (thin noodles) | 0.04 | 3 | ||||
| Chinese noodles | 0.3 | 3 | ||||
| Rice | Rice polishing | Brown rice | Polished rice (0.5%) | 1.0 | 3 | |
| Polished rice (1.2%) | 0.9 | 3 | ||||
| Polished rice (3%) | 0.8 | 6 | ||||
| Rice bran | 6.9 | 6 | ||||
| Polished rice (5%) | 0.7 | 6 | ||||
| Rice bran | 7.3 | 6 | ||||
| Polished rice (7%) | 0.6 | 8 | ||||
| Rice bran | 7.4 | 6 | ||||
| White rice | 0.5 | 9 | ||||
| Rice bran | 6.8 | 6 | ||||
| Rinsing | Brown rice | Rinsed rice | 0.9 | 4 | ||
| Polished rice (3%) | 0.6 | 3 | ||||
| Polished rice (5%) | 0.6 | 3 | ||||
| Polished rice (7%) | 0.6 | 4 | ||||
| White rice (10%) | 0.6 | 4 | ||||
| Rice cooking | Brown rice | Cooked Rice | 0.4 | 3 | ||
| Polished rice (0.5%) | 0.4 | 3 | ||||
| Polished rice (1.2%) | 0.4 | 3 | ||||
| Polished rice (3%) | 0.3 | 3 | ||||
| Polished rice (5%) | 0.3 | 3 | ||||
| Polished rice (7%) | 0.3 | 3 | ||||
| White rice (10%) | 0.3 | 3 | ||||
| Fermentation | Brown rice | Japanese sake | 0.04 | 1 | ||
| Sake lees | 0.2 | 1 | ||||
| White rice | Japanese sake | 0.2 | 1 | |||
| Sake lees | 0.9 | 1 | ||||
| Barley | Roasting | Husked barley | Roasted barley | 1.2 | 1 | |
| Extraction | Roasted barley | Barley tea | 0.005 | 3 | ||
| Extraction residue | 0.6 | 3 | ||||
| Barley tea | 0.01 | 3 | ||||
| Extraction residue | 0.4 | 3 | ||||
| Barley tea | 0.01 | 3 | ||||
| Extraction residue | 0.4 | 3 | ||||
| Buckwheat | Milling | Unpolished buckwheat | Husk | 1.5 | 6 | |
| Bran | 1.8 | 6 | ||||
| Flour | 0.7 | 6 | ||||
| Boiling | Fresh buckwheat noodles | Boiled buckwheat noodles (boiled for 0.5 min) | 0.5 | 6 | ||
| Boiled buckwheat noodles (boiled for 1 min) | 0.4 | 6 | ||||
| Boiled buckwheat noodles (boiled for 2 min) | 0.4 | 6 | ||||
| Tea | Tea leaves | Extraction | Manufactured tea | Green tea (60 °C) | 0.01 | |
| Green tea (90 °C) | 0.01 | 2 | ||||
| Pulse | Soybean | Tofu processing | Soybean | Soymilk | 0.2 | 4 |
| Okara (tofu refuse) | 0.2 | 4 | ||||
| Filling tofu | 0.1 | 3 | ||||
| Momen tofu (firm tofu) | 0.2 | 1 | ||||
| Kinugoshi tofu (fine textured tofu) | 0.2 | 1 | ||||
| Boiling | Cooked beans | 0.2 | 3 | |||
| Fermentation | Natto (fermented soybeans) | 0.4 | 3 | |||
| Miso (soybean paste) | 0.3 | 1 | ||||
| Vegetables | Spinach (Mainly surface contamination) | Washing | Spinach | Washed spinach | 0.4 | 13 |
| 0.3 | 1 | |||||
| Boiling | Boiled spinach | 0.3 | 1 | |||
| Mizuna | Washing | Mizuna | Washed mizuna | 0.3 | 1 | |
| Boiling | Boiled mizuna | 0.2 | 1 | |||
| Turnip | Washing | Turnip | Washed turnip | 0.5 | 1 | |
| Decorticating | Peeled turnip | 0.2 | 1 | |||
| Japanese radish | Decorticating | Washed Japanese radish | Peeled Japanese radish | 0.8 | 5 | |
| Seed plants | Rapeseed | Compressing | Rapeseed | Rapeseed oil | 0.005 | 1 |
| Extraction | 0.002 | 1 | ||||
| Perilla frutescens | Compressing | Roasted seeds of Perilla frutescens | Perilla oil | 0.08 | 2 | |
| Strained lees | 1.5 | 2 | ||||
| Mushrooms and wild edible plants | Bamboo shoot | Boiling | Bamboo shoot | Boiled bamboo shoot | 0.7 | 4 |
| Japanese butterbur petiole | Washing | Japanese butterbur petiole | Washed Japanese butterbur petiole | 1.0 | 5 | |
| Boiling | Boiled Japanese butterbur petiole | 0.7 | 5 | |||
| Japanese butterbur inflorescence | Boiling (with salt) | Japanese butterbur inflorescence | Boiled Japanese butterbur inflorescence | 1.2 * | 2 | |
| Tempura | Deep-fried Japanese butterbur inflorescence | 0.09 | 2 | |||
| Shiitake mushroom | Soaking | Dried shiitake mushroom | Soaked shiitake mushroom | 0.08 | 3 | |
| Grilling | Raw shiitake mushroom | Grilled shiitake mushroom | 1.2 | 3 | ||
| Japanese wormwood | Washing | Japanese wormwood leaves | Washed Japanese wormwood leaves | 0.9 | 2 | |
| Boiling | Boiled Japanese wormwood leaves | 0.4 | 2 | |||
| Field horsetail | Boiling | Field horsetail | Boiled field horsetail | 0.7 | 3 | |
| Bracken fern | Soaking | Bracken fern | Soaked bracken fern (0.3% backing soda) | 0.08, 0.1* | 3, 1 | |
| Soaked bracken fern (0.4% wheat flour) | 0.7 | 3 | ||||
| Salted, then desalted | Salted-desalted bracken fern | 0.02 * | 2 | |||
| Japanese royal fern | Soaking | Japanese royal fern | Soaked Japanese royal fern (0.3% backing soda) | 0.2, 0.4* | 3, 2 | |
| Soaked Japanese royal fern (0.4% wheat flour) | 0.9 | 3 | ||||
| Salted, then desalted | Salted-desalted Japanese royal fern | 0.02 * | 3 | |||
| Koshiabura (C. sciadophylloides) | Tempura | Koshiabura sprout | Deep-fried koshiabura sprout | 0.2*, 0.6 | 2, 2 | |
| Boiling | Boiling koshiabura sprout | 0.7 * | 2 | |||
| Salted, then desalted | Salted-desalted koshiabura sprout | 0.1 * | 2 | |||
| Japanese knotweed | Soaking in hot water | Japanese knotweed sprout | Soaked Japanese knotweed sprout | 0.2 * | 5 | |
| Japanese spikenard | Boiling | Japanese spikenard stem | Boiled Japanese spikenard stem | 0.9 * | 3 | |
| Momijigasa (P. delphiniifolius) | Boiling | Momijigasa sprout | Boiled momijigasa sprout | 0.4 * | 2 | |
| Hangonsou (S. cannabifolius) | Salted, then desalted | Hangonsou sprout | Salted-desalted hangonsou | 0.4 * | 2 | |
| Japanese angelica-tree | Boiling | Japanese angelica-tree spears | Boiled Japanese angelica-tree spears | 0.9 * | 4 | |
| Tempura | Deep-fried Japanese angelica-tree spears | 0.1*, 0.5 | 2, 3 | |||
| Fruits | Ume (Japanese apricot) | Washing | Ume | Washed ume | 0.9 | 3 |
| Soaking and drying | Small pickled ume (salted) | 1.0 | 6 | |||
| Pickled ume (salted) | 1.0 | 6 | ||||
| Pickled ume (salt water) | 0.8 | 6 | ||||
| Soaking | Ume liquor | 0.3 | 3 | |||
| Soaked ume | 0.4 | 3 | ||||
| Ume syrup | 0.5 | 3 | ||||
| Heating and concentration | Ume jam (90% concentrated) | 0.9 | 3 | |||
| Ume jam (70% concentrated) | 0.6 | 3 | ||||
| Fruit | Blueberry | Washing | Blueberry | Washed blueberry | 1.0 | 2 |
| Heating and concentration | Blueberry jam (normal) | 0.9 | 1 | |||
| Blueberry jam (low enrichment jam) | 0.7 | 1 | ||||
| Drying | Dried blueberry | 4.7 | 3 | |||
| Olfham blueberry | Heating and concentration | Olfham blueberry | Olfham blueberry jam | 0.7 | 3 | |
| Peach | Washing | Peach | Peach | 0.9 | 1 | |
| Decorticating | Peach plup | 0.9 | 11 | |||
| Juice extraction | Peach juice | 0.9 | 2 | |||
| Juice waste | 1.1 | 2 | ||||
| Apple | Washing | Apple | Apple | 1.0 | 4 | |
| Decorticating | Apple pulp | 1.0 | 5 | |||
| Juice extraction | Apple juice | 0.9 | 3 | |||
| Juice waste | 1.0 | 3 | ||||
| Heating | Apple compote | 1.0 | 1 | |||
| Fig | Washing | Fig | Fig | 1.0 | 3 | |
| Boiling | Sweetened boiled fig | 1.4 | 3 | |||
| Heating and soaking | Fig preserved in syrup | 0.5 | 3 | |||
| Grape | Washing | Grape | Grape | 1.0 | 3 | |
| Decorticating | Grape plup | 0.6 | 3 | |||
| Heating and centrifugation | Grape juice | 1.0 | 3 | |||
| Juice waste | 0.9 | 3 | ||||
| Drying | Raisin | 3.6 | 3 | |||
| Fermentation | Rosé wine | 0.9 | 6 | |||
| Red wine | 1.0 | 6 | ||||
| Persimmon | Drying | Persimmon | Dried persimmon | 6.0 | 4 | |
| Ampo persimmon (partially-dried Japanese persimmon) | 5.0 | 4 | ||||
| Yuzu (Japanese citron) | Washing | Yuzu | Yuzu | 1.0 | 3 | |
| Heating | Yuzu marmalade | 0.2 | 3 | |||
| Soaking | Yuzu liquor | 0.2 | 3 | |||
| Chestnut | Steaming | Chestnut | Steamed chestnut (with outer hard shell) | 1.0 | 3 | |
| Steamed chestnut (without outer hard shell and inner skin) | 0.9 | 3 | ||||
| Boiling | Boiled chestnut (with outer hard shell) | 0.9 | 3 | |||
| Boiled chestnut (without outer shell and inner skin) | 0.8 | 3 | ||||
| Heating | Sibukawani (Sweetened chestnut) | 0.6 | 3 | |||
| Meat | Beef | Grilling | Beef (semimembranosus, rump) | Grilled beef (thickness 10 mm, 2 min) | 1.1 | 6 |
| Frying | Beef (rump) | Fried beef (thickness 10 mm, 3 min) | 1.2 | 3 | ||
| Boiling | Beef (semimembranosus) | Boiled beef (thickness 1–2 mm, 1.5 min) | 0.6 | 3 | ||
| Cooking liquid | 0.1 | 3 | ||||
| Beef (rump) | Boiled beef (thickness 1–2 mm, 1.5 min) | 0.5 | 3 | |||
| Cooking liquid | 0.1 | 3 | ||||
| Beef (sirloin) | Boiled beef (thickness 1 mm, 0.1 min) | 0.7 * | 3 | |||
| Boiled beef (thickness 1 mm, 0.5 min) | 0.4 * | 3 | ||||
| Boiled beef (thickness 1 mm, 1 min) | 0.3 * | 3 | ||||
| Boiled beef (thickness 1 mm, 2 min) | 0.2 * | 3 | ||||
| Boiled beef (thickness 2 mm, 10 min) | 0.1 * | 3 | ||||
| Boiled beef (thickness 4 mm, 10 min) | 0.3 * | 3 | ||||
| Boiled beef (thickness 10 mm, 10 min) | 0.7 * | 3 | ||||
| Stewing | Beef (semimembranosus) | Stewed beef (thickness 10 mm, 20 min) | 0.4 | 3 | ||
| Cooking liquid | 0.2 | 3 | ||||
| Soaking in brine | Beef (semimembranosus) | Soaked beef (salt 10%, 24 h) | 0.7 | 3 | ||
| Soaked beef (salt 10%, 48 h) | 0.4 | 3 | ||||
| Soaked beef (salt 10%, 120 h) | 0.3 | 3 | ||||
| Soaked beef (salt 10%, 144 h) | 0.2 | 3 | ||||
| Soaked beef (salt 10%, 168 h) | 0.2 | 3 | ||||
| Beef (unknown part) | Soaked beef (Salt 20%, 24 h) | 0.3 | 3 | |||
| Soaking in running water | Beef (top round) | Soaked beef (thickness 2 mm, 10 min) | 0.3 * | 3 | ||
| Soaked beef (thickness 2 mm, 20 min) | 0.2 * | 3 | ||||
| Soaked beef (thickness 4 mm, 20 min) | 0.5 * | 3 | ||||
| Soaked beef (thickness 4 mm, 60 min) | 0.2 * | 3 | ||||
| Soaked beef (thickness 10 mm, 60 min) | 0.8 * | 3 | ||||
| Drying | Beef (unknown part) | Beef jerky | 2.6 | 3 | ||
| Wild boar | Grilling | Wild boar (thigh) | Grilled wild boar meat (thickness 10 mm, 2min) | 1.2 | 9 | |
| Wild boar (back loin) | Grilled wild boar meat (thickness 10 mm, 2min) | 1.3 | 9 | |||
| Boiling | Wild boar (thigh) | Boiled wild boar meat (thickness 10 mm, 1.5 min) | 0.9 | 9 | ||
| Wild boar (back loin) | Boiled wild boar meat (thickness 10 mm, 1.5 min) | 0.7 | 9 | |||
| Steaming | Wild boar (thigh) | Steamed wild boar meat (thickness 10 mm, 10 min) | 0.9 | 9 | ||
| Wild boar (back loin) | Steamed wild boar meat (thickness 10 mm, 10 min) | 0.8 | 9 | |||
| Sika deer | Grilling | Sika deer (thigh) | Grilled sika deer meat (thickness 10 mm, 2 min) | 1.4 | 9 | |
| Sika deer (back loin) | Grilled sika deer meat (thickness 10 mm, 2 min) | 1.3 | 9 | |||
| Sika deer | Boiling | Sika deer (thigh) | Boiled sika deer meat (thickness 10 mm, 1.5 min) | 0.9 | 9 | |
| Sika deer (back loin) | Boiled sika deer meat (thickness 10 mm, 1.5 min) | 0.9 | 9 | |||
| Steaming | Sika deer (thigh) | Steamed sika deer meat (thickness 10 mm, 10 min) | 0.9 | 9 | ||
| Sika deer (back loin) | Steamed sika deer meat (thickness 10 mm, 10 min) | 0.8 | 9 | |||
| Fishery products | Pond smelt | Frying | Pond smelt | Fried pond smelt (Karaage) | 1.2 | 3 |
| Frying and soaking | Fried and soaked pond smelt (Nannbannzuke) | 0.5 | 3 | |||
| Grilling | Grilled pond smelt (Suyaki) | 1.6 | 3 | |||
| Grilling and heating | Grilled and heated pond smelt (Kanroni) | 1.2 | 3 | |||
| Pacific cod | Washing | Pacific cod | Washed pacific cod (one time) | 0.4 | 3 | |
| Washed pacific cod (two times) | 0.3 | 3 | ||||
| Washed pacific cod (three times) | 0.2 | 3 |
(1) Effect of removal of inedible parts
Processing to remove non-edible parts of ALF products to render them suitable for eating is effective for removal of radioactive cesium. Wheat and buckwheat grains are usually separated by milling to isolate the edible parts, wheat flour and buckwheat flour, and the inedible parts, bran and husk, respectively. The Pf values of wheat flour and buckwheat flour were 0.4 and 0.7, respectively. This indicates that the concentration of radioactive cesium reduces in these flours after the milling process compared to that in the grains. Conversely, the Pf values of wheat bran, husk, and buckwheat bran were 2.1, 1.5, and 1.8, respectively, which indicates that the milling process led to higher concentrations of radioactive cesium in these products than in the original grains (Kimura et al., 2012, Tanji et al., 2012, Tanji et al., 2013). In Japan, brown rice is at times consumed without any modifications; however, it is usually processed into polished rice, with a part or the entire rice bran removed, and used as a staple food product. The Pf values of polished rice altered depending on the rice bran removal rate (0.5% to 10%), as shown in Table 5 (Tagami and Uchida., 2012a, Tanji et al., 2013, Hachinohe et al., 2015d, Yoshida et al., 2019). The Pf value of polished rice with the rice bran entirely removed (10%) decreased to 0.5; however, the Pf value of the removed rice bran increased to 6.8 (Hachinohe et al., 2015c). Since wheat bran and rice bran are used as feed for livestock, it is necessary to pay attention to the radioactive cesium concentration when these are used.
Heterogeneity in the spatial distribution of radioactive cesium in ALF products may cause changes in the concentration of processed products after the removal of the inedible parts. Fig. 6 shows the distribution of radioactive cesium in the grain structure of brown rice, wheat, soybeans, and buckwheat. When the mass and distribution ratios of radioactive cesium differ in the grain structure, it implies that the distribution of radioactive cesium in the grain is heterogeneous. Moreover, greater the difference between the mass ratio and the distribution ratio of radioactive cesium, greater is the difference in the radioactive cesium concentrations before and after processing. The greatest difference between these ratios is observed in rice bran (Fig. 6), which causes the Pf value of rice bran to be higher than those of bran from other grains.

Mass ratio and radioactive cesium distribution ratio in grains.
This figure and table summarize data from the following references: Kimura et al. (2012), Hachinohe et al. (2013), Hachinohe et al. (2015b), and Hachinohe et al. (2018).
Although the distribution ratio of radioactive cesium in all ALF products has not been determined, the Pf values after the removal of inedible parts from vegetables and fruits have been reported x) (Table 5). The Pf values in the peelings of turnip and Japanese radish were 0.2 and 0.8, respectively. The Pf values for apple pulp with skin and core removed, peach pulp with skin and seeds removed, and grape pulp with skin removed were 1.0, 0.9, and 0.6, respectively. When the radioactive cesium concentration in the inedible part to be removed is higher than that in the edible part, the reduction in radioactive cesium concentration in the edible part is expected to be higher, although the Pf values differ depending on food processing.
Seed oil and oil cake are fractionated during the oilseed pressing process. The Pf values of oil from rapeseed and perilla seeds are 0.005 and 0.08, respectively. Such low Pf values indicate that the majority of radioactive cesium in the raw seed is removed along with the oil cake x). This is because radioactive cesium is water-soluble and has an extremely low transfer rate to oil. The oil pressing process is one of the most effective processes for reducing the radioactive cesium concentration in products.
(2) Effect of elution into an aqueous solution
Cesium is a monovalent alkali metal and is considered to exist in foods as cesium compounds bonded with a variety of anions or a cesium ion. Therefore, radioactive cesium in food is considered to be water-soluble and would be expected to be eluted relatively easily in aqueous solutions used for cooking (boiling water, broth, and liquid seasoning among others).
Boiling is one of the most common cooking methods used in domestic settings. Typical Japanese noodles, such as Udon and Soba, are cooked in boiling water and rinsed with water to make them edible. Udon is made from wheat flour, and Soba is made from buckwheat flour. It has been confirmed that a part of radioactive cesium in these noodles present before cooking can be transferred into the boiling water and rinsing water. For Udon noodles, the Pf value after boiling is less than 0.1, regardless of the thickness of the noodles (Hachinohe et al., 2014, Hachinohe et al., 2015b). The Pf value of boiled Soba noodles is less than 0.5 if the boiling time is more than 0.5 min. Moreover, it has been reported that extending the boiling time of Udon noodles beyond the requisite boiling time does not significantly reduce the Pf and Fr values of the noodles. Conversely, increasing the quantity of water used for boiling Udon noodles decreases the Fr value (along with the Pf value) of the noodles, as shown in Fig. 7 (Hachinohe et al., 2015b). Chinese noodles are also made from wheat flour, similar to Udon noodles. However, they are harder and more elastic than Udon noodles, as brine water is added to the dough and the noodles do not require a rinsing process after boiling. The Pf value of Chinese boiled noodles was found to be 0.3 (Hachinohe et al., 2013). Even when the same raw materials are used, it is considered that differences in the methods for making and cooking noodles could influence the Pf value.

Effect of boiled water volume on the food processing retention factor (Fr) of radioactive cesium in boiled Udon noodles.
This figure was constructed based on data from the following references: Hachinohe et al. (2015b). Udon noodles (thin noodles, 1.1 mm in diameter, 50 g) were boiled for 3 min. The exact volume of boiling water was 500 mL for 50 g of raw noodles. The dotted line indicates Fr when the radioactive cesium concentration (134Cs + 137Cs) in Udon noodles becomes equal to that in water by free diffusion.
The effect of the removal of radioactive cesium from beef upon boiling in water was reported to be influenced by the boiling time and the thickness of beef (Nabeshi et al., 2013a, Sato et al., 2019). When the boiling time of 1-mm thick beef was increased from 0.1 min to 2 min, the Pf value of boiled beef decreased from 0.7 to 0.2. The Pf values of beef boiled for 10 min were 0.1, 0.3, or 0.7 for 2 -, 4 -, or 10-mm thick beef, respectively. In the range of conditions used in the study, a shorter boiling time and thicker meat strip were shown to lead to a lower reduction rate of radioactive cesium concentration in beef.
The Pf values of boiled vegetables, soybean, and wild edible plants have been reported. In most cases, the concentration of radioactive cesium is lower in boiled food than in the raw material (Kiyono and Akama, 2019, Nabeshi et al., 2013a, Nabeshi et al., 2016, Tagami and Uchida, 2012b, Tagami and Uchida, 2012c, Tagami and Uchida, 2013). The only exception to the increase in the concentration of radioactive cesium upon boiling is boiled Japanese butterbur, which has a Pf value of 1.2 (Kiyono and Akama, 2019).
Radioactive cesium concentration can be reduced by soaking in water or seasoning liquid, even if the food product is not boiled. Soaking of beef in brine water has been reported to reduce radioactive cesium concentration. The Pf values of beef were 0.7 and 0.2 after 24 h and 144 h of soaking, respectively. Moreover, it has been shown that the removal of radioactive cesium from beef can be further enhanced by replacing the seasoning liquid and soaking (Nabeshi et al., 2013b).
Tofu, which is a food product made from processed soybean and is one of the most popular traditional foods in Japan, is generally stored in water at home. The Fr values of tofu when stored in water under different temperature conditions have been reported to depend on water temperature, soaking time, and water volume. For the same quantity of water, the elution ratio of radioactive cesium into water is higher at 37 °C than at 4 °C, as shown in Fig. 8 (Yoshida et al., 2020).

Effect of water mass on the food processing retention factor (Fr) of tofu.
The dotted line indicates Fr when the 137Cs concentration in tofu is equal to that in water owing to free diffusion. This figure refers to Yoshida et al. (2020).
The effects of cooking methods (grilling, boiling, and steaming) on the reduction of radioactive cesium concentrations were compared using samples of wild animal meat (sika deer, and wild boar). The Pf and Fr values observed after boiling and steaming were lower than those after grilling; hence, boiling and steaming were more effective than grilling for removing radioactive cesium and reducing its concentration in wild animal meat (Hachinohe et al., 2020).
(3) Effect of mass change on radioactive cesium concentration
Even if radioactive cesium is not removed during food processing/cooking, the concentration of radioactive cesium changes when the total mass of the food changes. An increase in total mass leads to a reduction in radioactive cesium concentration, whereas a reduction in total mass leads to an increase in radioactive cesium concentration.
In Japan, rice is generally cooked in an electronic rice cooker by adding water (approximately 1.5 times the weight of rice) to polished rice. Since the temperature during cooking is lower than the volatilization temperature of radioactive cesium, radioactive cesium in rice is not removed during the rice cooking process. However, the Pf value of cooked rice with an overall mass 2.5 times (Pe = 2.5) that of polished rice (polishing ratio 0.5%–10%) is 0.3–0.4, which corresponds to a lower radioactive cesium concentration than that in polished rice before cooking (Hachinohe et al., 2015c, Hachinohe et al., 2015d, Yoshida et al., 2019). When the Pe value is 2.5, Pf is theoretically calculated to be 0.4 (1/2.5 = 0.4), which is similar to the reported Pf value.
Udon noodles are made by mixing water and salt with wheat flour, and there is no process to remove radioactive cesium. The Pe value of fresh Udon noodles prepared by adding water and salt to wheat flour was 1.36. The Pf value of fresh Udon noodles was 0.7, indicating that the radioactive cesium concentration in fresh Udon noodles was lower than that in wheat flour. When the Pe value is 1.36, the Pf value is theoretically calculated to be 0.74 (1/1.36 = 0.74), which is similar to the reported value of Pf (Kimura et al., 2012, Hachinohe et al., 2015b).
Tempura is a traditional Japanese preparation, in which ingredients are wrapped in a flour-based batter and deep-fried in oil. Since radioactive cesium is not transferred to the frying oil, the level of radioactive cesium removal by Tempura cooking is expected to be considerably low. However, it has been reported that for wild edible plants, the radioactive cesium concentration decreases with Tempura cooking owing to the increase in the total mass of the food products upon coating with the batter (Kiyono and Akama, 2019, Nabeshi et al., 2016). The Pf values of Koshiabura after Tempura cooking have been reported to be 0.2 (Kiyono and Akama, 2019) and 0.6 (Nabeshi et al., 2016). The Pf values of Japanese angelica-tree after Tempura cooking have been reported to be 0.1 (Kiyono and Akama, 2019) and 0.5 (Nabeshi et al., 2016). The difference in the reported Pf values are considered to result from the difference in the mass of butter used for Tempura cooking.
Conversely, it should be noted that a reduction in total mass increases the radioactive cesium concentration in food. Drying processes remove water from food, which leads to a reduction in the total mass. The Pf values of dried blueberries, grapes, and persimmons have been reported to be 4.7, 3.6, and 6.0, respectively x) (Nabeshi et al., 2016). Mass loss owing to drying also occurs during roasting; for example, the Pf value of barley after roasting for barley tea has been reported to be 1.2 (Todoriki et al., 2013). The radioactive cesium concentration has been reported to increase after grilling as water and/or gravy are lost during grilling. The Pf values of grilled beef, grilled sika deer, and grilled wild boar were found to range from 1.1 to 1.4 (Nabeshi et al., 2013a, Hachinohe et al., 2020). The Pf values of grilled and fried fish were found to be 1.6 and 1.2, respectively (Nabeshi et al., 2013c). Although a decrease in the total food mass increases the radioactive cesium concentration, the radioactive cesium concentration after processing/cooking can be roughly estimated using the mass change ratio owing to processing/cooking and the radioactive cesium concentration of food before processing/cooking.
A decade has passed since the TEPCO-FDNPP accident, and the risk of radioactive cesium contamination in domestic ALF products is extremely low at present owing to the establishment of a rapid post-accident inspection system and implementation of risk management measures.
Prior to the nuclear accident, almost no study had been conducted on the behavior of radioactive cesium in the processing/cooking process of domestic ALF products. Several such studies commenced immediately after the nuclear accident, which were primarily conducted by Japanese researchers, and a significant body of relevant scientific literature has formed to date.
This review discussed the changes in radioactive cesium levels in domestic ALF products over a decade since the nuclear accident and reviewed extensive scientific data obtained thus far on the behavior of radioactive cesium during the processing/cooking of these food products.
We hope that this review will aid risk management by food producers and help consumers develop an adequate understanding of the behavior of radioactive materials in food.
Acknowledgements Part of this research was funded by a grant from the Skylark Food Science Institute FY2012. In addition, we would like to express our gratitude to all members of the Radioactive Material Effects Working Group at the Food Research Institute (former National Food Research Institute) and our collaborators.