Original papers
Kinetic analysis of the oxidation of partially oxidized linoleic acid
2021 年 27 巻 3 号 p. 351-357
詳細
2021 年 27 巻 3 号 p. 351-357
This study performed a kinetic analysis of the oxidation of partially oxidized linoleic acids to understand the oxidation process under practical conditions. In these experiments, lipid was spotted on the bottoms of test tubes, which were then held in a water bath at 50 °C for 0, 1, or 2 h to obtain controlled partially oxidized lipid. The test tubes were then stored at 5 °C for 6 days in the dark. The conjugated diene structure of the primary oxidation products was measured to evaluate the progress of autoxidation of the lipid by spectrophotometry. The oxidation processes of linoleic acid at 5 °C after the storage period at 50 °C differed among samples and could not be explained without the effect of accumulated primary oxidation products at the start of oxidation at 5 °C. These oxidation processes were described by a square root autoxidation model.
Linoleic acid is one of the major polyunsaturated fatty acids (PUFAs) that constitute food lipids. PUFAs are prone to oxidation under atmospheric air, and the deteriorated lipids have an unpleasant odor and are harmful to human health (Frankel, 1983, Oarada et al., 1992, Niki, 2001). Therefore, preventing lipid oxidation is important concern in the food industry and health sciences.
Lipid oxidation at normal temperature in air is known as autoxidation. To control autoxidation, a detailed understanding of the underlying kinetics is required. Consequently, many studies have been conducted on this subject (Adachi et al., 1995, Maillard et al., 1983, Minemoto et al., 1999, Yamamoto et al., 1982). Frankel (1983) investigated volatile lipid oxidation products and Porter (2013) examined the oxidation kinetics of PUFAs in detail. The oxidation of a purified lipid produces several primary oxidation products (Park et al., 1981), which also contain geometric isomers (Porter, 2013), and these products further produce various secondary oxidation products. The variety of these oxidation products makes it difficult to investigate the lipid oxidation process.
Yamamoto et al. (1982) showed that oxygen uptake, substrate disappearance, and formation of a conjugated diene agree well with each other stoichiometrically in the early stage of the autoxidation of methyl linoleate. Therefore, the concentration of the conjugated diene structure was used as an indicator of lipid oxidation in this study, and was quantified by absorbance at 234 nm. Shima and Sakashita (2016) reported a kinetic model to describe the time course of the concentration of the conjugated diene structure in the early stage of the oxidation of glyceryl trilinoleate, as measured by spectrophotometry, which well describes the experimental results. The model was developed assuming an absence of primary oxidation products at the beginning. Under practical conditions, estimation of the oxidation process of partially oxidized lipids is important because food processing produces partially oxidized products, and these food products have to be stored, transported, and displayed until they are delivered to the consumers. In this study, to investigate the oxidation of partially oxidized lipids using UV spectrophotometry, the intrinsic absorbance of lipids other than the conjugated diene structure at 234 nm had to be distinguished from that of the conjugated diene structure.
This study investigated the effect of several initial oxidation levels on the time course of the subsequent autoxidation, and proposed a lipid oxidation model to describe the oxidation process of partially oxidized lipid at the start of oxidation. The initial oxidation process was sustained at a high temperature in air and for a short time (up to 2 h), followed by a somewhat longer process in which a low temperature was maintained for 1 week.
As described below, the oxidation process of linoleic acid was affected by the concentration of hydroperoxide that existed in the lipid at the beginning of storage at 5 °C. Therefore, the effect of the concentration of hydroperoxide should be considered. Although an autocatalytic equation has been used to describe the oxidation processes of unsaturated fatty acids and their acylglycerols in the way that considers the effect of the oxidized products (Adachi et al., 1995, Minemoto et al., 1999), preliminary application on the experimental results of this study showed that this model could not be applicable to the time course of the concentration of the conjugated diene structure in this study (data not shown).
Allen and Kummerow (1951) expressed oxygen consumption during the oxidation of methyl eleostearate using Eq. 1.
 |
where [O2], [Ester], and [Product] are the concentrations of oxygen, ester, and oxidation products, respectively, t is time, and kA is the rate constant.
In the early stage of lipid oxidation, the formation of hydroperoxide stoichiometrically agrees with the consumption of oxygen (Yamamoto et al., 1982). Therefore, assuming that Ester and Product in Eq. 1 correspond to the unoxidized lipid and hydroperoxide, respectively, the time course of the concentration of hydroperoxide would be expressed by the following equation:
 |
where CCOOH is the concentration of hydroperoxide in the lipid, which is regarded as the concentration of the functional group of the conjugated diene structure in this study, since only the early stage of lipid autoxidation is observed; CCH,O is the concentration of hydrocarbon at the bis-allylic position of the unoxidized lipid, and k′ is the rate constant. This equation was designated as the “square root autocatalytic equation” to distinguish it from the ordinal autocatalytic equation.
Integrating Eq. 2 at the initial condition of CCOOH = 0 at t = tv as follows:
 |
 |
The actual lipid exhibits absorbance at 234 nm because of the existence of functional groups other than the conjugated diene. In the spectrophotometric method (Nihon Yukagaku Kyôkai, 1966), a certain value originating from other functional groups is subtracted from the absorbance at 234 nm to determine the intrinsic concentration of the conjugated diene structure. The concentration corresponding to the overall absorbance at 234 nm was represented as C234 nm, which was estimated from the absorbance at 234 nm using a calibration curve obtained from the standard solution of conjugated linoleic acid. A value represented by the concentration calculated from the absorbance at 234 nm originating from functional groups other than the conjugated diene was designated as CCOOH,v. Therefore, C234 nm is given by Eq. 5 as follows:
 |
Conclusively, C234 nm is given by Eq.6 as a function of time t.
 |
Materials Linoleic acid and conjugated linoleic acid were obtained from Sigma-Aldrich (St. Louis, MI, USA), and their purity was 99 % (GC), according to the supplier's information. The conjugated linoleic acid was a mixture of cis- and trans- isomers of 9,11- and 10,12-octadecadienoic acid. Stearic acid was obtained from Nacalai Tesque (Kyoto, Japan), with a purity of 99.4 % (GC) according to the supplier's information. n-Hexane was also obtained from Nacalai Tesque, which was a specially prepared reagent grade for high performance liquid chromatography.
Density of linoleic acid The specific gravity of linoleic acid was measured to determine its density. Linoleic acid used for the measurement of specific gravity was obtained from Tokyo Kasei Kogyo (Tokyo, Japan), with a purity of 99.2% (GC) according to the supplier's information. The pycnometer method was used at 5, 30, 40, and 50 °C. A refrigerator and a water bath were used to control temperature, and distilled water was used as the reference substance at the same temperature. The oxidation of linoleic acid during the measurement of specific gravities was assessed by C234 nm.
Calibration curve to determine the concentration of the conjugated diene structure The concentration of the conjugated diene structure as the primary oxidation product was calculated using a calibration curve, which was prepared using conjugated linoleic acid. An aliquot of conjugated linoleic acid was weighed precisely in a test tube using an analytical balance, and diluted in n-hexane. The absorbance of the test solution at 234 nm was measured using a UV spectrophotometer (UVmini-1240; Shimadzu, Kyoto, Japan). n-Hexane was used as the reference solution. This process was repeated with varying concentrations of conjugated linoleic acid in n-hexane and a calibration curve was obtained from their absorbance. To obtain the absorbance of conjugated linoleic acid other than the conjugated diene structure, stearic acid was also dissolved in n-hexane and the absorbance at 234 nm was measured.
Time course of the concentration of the conjugated diene structure Linoleic acid (approximately 10 mg) was spotted on the bottom of each test tube (18 mm outer diameter and 165 mm in length) and weighed precisely using an analytical balance. The test tubes were then covered with aluminum foil and samples B and C were placed in a temperature-controlled water bath at 50 °C in the dark for 1 and 2 h, respectively. After this period, the test tubes were cooled with cold water and stored in an aluminum block in a refrigerator in the dark at 5 °C (5.2 °C ∓ 5.4 °C) for 6 days. Untreated linoleic acid at 50 °C was also stored at 5 °C as a control and designated as sample A.
At first, the C234 nm of each sample was measured just before storage at 5 °C. After that, a test tube was removed at 24 h intervals for each sample, and the oxidized lipid was diluted with n-hexane to an appropriate concentration, and then poured into a quartz cell (1 cm light path length). The absorbance at 234 nm was measured using a UV spectrophotometer, with n-hexane as a reference solution.
Estimation of parameters Equation 6 contains three parameters to be determined: k′, tv, and CCOOH,v. These parameters were estimated by optimizing the theoretical C234 nm value to the experimental value using adaptability as the criterion. Adaptability was estimated by a criterion function that calculated the absolute values of the relative error between the theoretical C234 nm value and the experimental value. The sum of the adaptability of each data point in the time course of a sample was minimized by the direct search method (Sannomiya, 1983) with some modifications. These procedures were processed using Microsoft Excel® 2016 and Microsoft Visual C++® 2019 (Microsoft, Redmond, WA, USA).
Density of linoleic acid and the calibration curve for the conjugated diene structure The specific gravity of linoleic acid to distilled water at the same temperature was measured and converted to the density of linoleic acid using water density at the same temperature (Kuga and Nishihara, 2018). Fig. 1 shows the density of linoleic acid at different temperatures; the density decreased linearly with an increase in temperature. To confirm the validity of the measured values, the reported values at 20 °C are also shown in Fig. 1. No significant oxidation during the measurement was confirmed by the C234 nm values of 8.1 and 7.9 mmol/L before and after the measurement. The density was used to calculate the concentration of the conjugated diene structure in linoleic acid.

Density of linoleic acid. Symbol ● represents experimental values. Symbols □, ×, and △ are the reference values from Abe (1964), Minami and Iwahashi (2012), and Speight (2017), respectively.
A calibration curve for the conjugated diene structure was also prepared (Fig. 2). The absorbance other than the conjugated diene structure was estimated using a 74 µmol/L stearic acid solution in n-hexane, and the absorbance was −0.000. Therefore, the absorbance of other functional groups compared to the conjugated diene structure was ignored to obtain the calibration curve. The molar absorption coefficient of the conjugated linoleic acid in n-hexane was 2.5 × 10⁴ L/(mol cm) at 234 nm and at 30 °C.

Calibration curve of the conjugated diene structure using conjugated linoleic acid.
Origin of the CCOOH, v Other than a bis-allyl group, the functional groups of linoleic acid also exist in stearic acid, and the n-hexane solution of stearic acid showed little absorption at 234 nm in the concentration range used in this study. Since the two double bonds in the bis-allyl group are not conjugated, they are considered to be two single double bonds, which have λmax in the far ultraviolet range and a large εmax hydrogen atom on each carbon atom at both ends of the bisallyl group is replaced by an allyl group, λmax shifts toward longer wavelengths, and εmax decreases to some degree (Hesse et al., 2010). Although λmax would not reach 234 nm, the foot of the peak might influence the absorbance at 234 nm.
Impurities were another possible reason for the origin of the CCOOH,v. According to the product information, the source of the linoleic acid was safflower oil; and high-linoleic safflower oil commonly contains linoleic acid (700 mg / 1 g lipid) and α-linolenic acid (2 mg / 1 g lipid) as PUFAsi). Therefore, conjugated fatty acids originating from the source material seemed to be less likely. Another possibility was the occurrence of compounds with conjugated diene structures that are produced by chemical reactions from linoleic acid during storage, and these compounds were independent of the oxidation process under consideration.
Although the contribution of these possibilities could not be clarified, the origin of CCOOH,v could be attributed to a combination of these possibilities.
Time course of C234 nm Figure 3 shows the time course of the C234 nm for all samples during storage at 5 °C. The solid symbols represent the C234 nm values for samples B and C immediately after treatment at 50 °C for 1 and 2 h, respectively. During treatment at 50 °C, the C234 nm steeply increased. The C234 nm also increased during storage at 5 °C. The increase at 5 °C depended on the length of treatment at 50 °C: the longer the treatment at 50 °C, the faster the rise of C234 nm at 5 °C. The solid curves in Fig. 3 were plotted using the estimated values of k′, CCOOH,v and tv, and coincide with the experimental values. The parameters tv and CCOOH,v represent the time at which the primary oxidation products theoretically become 0 mol/L, and the C234 nm value at tv, respectively. The sample oil at tv is assumed to be the theoretically unoxidized linoleic acid.
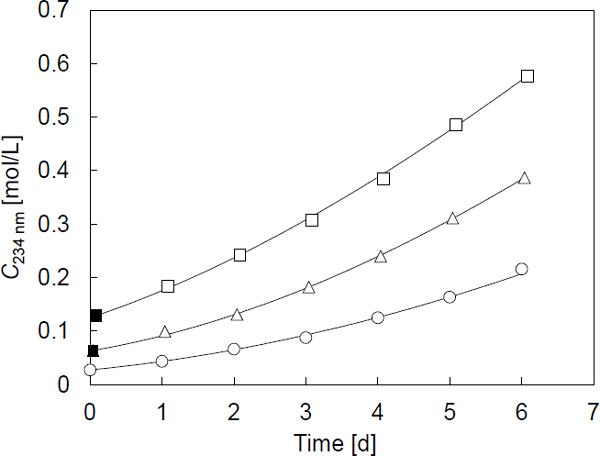
Time courses of C234 nm. Symbols ○, △, and □ represent sample A, B, and C, respectively. Symbol ■ represents the high-temperature treatment, which is identical to the first point of the samples. Solid lines are drawn using Eq.6.
The k′ values estimated for samples A, B, and C were 0.034, 0.047, and 0.049 L1/2/(mol1/2 d), respectively. These values resemble each other, but were somewhat different, although all values were obtained from the oxidation process at the same temperature at 5 °C. The differences were slightly large between sample A and the other two samples, and small between samples B and C. This result suggested that the high-temperature treatment affected the difference, rather than the length of the process. To confirm this hypothesis, a more detailed examination is required.
The CCOOH,v values of samples A, B, and C were 0.014, 0.040, and 0.040 mol/L, respectively. The difference in the CCOOH,v value was remarkable between sample A and samples B and C. Although the values obtained for samples B and C were similar, the value of sample A was approximately one-third of that of samples B and C. A conjugated diene structure is usually formed during the oxidation of linoleic acid and its ester as a constituent of the primary oxidation product, but increases in absorbance at approximately 234 nm without oxidation have also been reported. Privett and Blank (1962) described the formation of substances that exhibited absorbance at 233 nm before the absorption of oxygen during the oxidation of methyl linoleate. Okada and Fujii (1992) also reported an increase in the absorbance at 235 nm for linoleic acid stored at 70 °C under conditions in which oxygen had been removed. They observed absorbance for 30 days and found that the increase of the absorbance during the first 5 days was relatively large compared to that of the following incubation period. In this study, the CCOOH,v values of samples B and C were similar, indicating that the duration of the treatment at 50 °C did not significantly affect the CCOOH,v value. Although the complete removal of oxygen would be difficult, these studies suggest that the possibility of chemical changes that increased the absorbance at 234 nm, depending on the temperature other than the length of the oxidation process at high temperature in this study.
The tv values of samples A, B, and C were estimated to be −2.1, −2.0, and −3.7 d, respectively. Since the tV value corresponds to the time required to accumulate the primary oxidation products at the beginning of oxidation at 5 °C, it was suggested that sample C produced more primary oxidation products than the other samples during the treatment at 50 °C. Among the three samples, the k′ values of samples B and C were relatively larger than that of sample A, which was not stored at 50 °C. Large k′ values had the effect of steepening the slope of the time course of C234 nm, resulting in a shorter time span until C234 nm became equal to CCOOH, v. Therefore, the tv values of samples A and B came near. However, the tv value of sample C was lower than that of sample B as expected. As a result, the three parameters of sample A were different from those of samples B and C as the set of parameters, and the expected trend was observed among those of samples B and C. This result also suggested that there seemed to be an unexpected effect of the high-temperature process other than the accumulation of primary oxidative products of linoleic acid.
Relationship between the present and previous models A kinetic model has previously been proposed by Shima and Sakashita (2016) to describe the time course of the concentration of lipid hydroperoxide, which does not deal with the effect of pre-formed hydroperoxide. However, the model could not describe the time course observed in this study because the time courses of C234 nm are different from each other despite they are stored at the same 5 °C. That is, the samples had different amounts of hydroperoxide at the beginning of oxidation at 5 °C. The time course of the C234 nm depended on the duration of the treatment at 50 °C, suggesting that the amount of hydroperoxide that had been produced during the treatment should be considered when expressing the time course.
To describe the oxidation process of PUFAs or their acylglycerols, the autocatalytic equation model has also been proposed by Adachi et al. (1995) and Minemoto et al. (1999). Although the square root autocatalytic equation model is also an autocatalytic equation, the index number for the product term in Eq. 2 is different from that of the others. One of the possible differences was the oxidation periods of interest. The square root autocatalytic equation model focused on the early stage of oxidation, but the other autocatalytic model aimed to describe the entire process of autoxidation. Thus, the difference in the index number of the product term may be due to differences in the stage being focused on.
Approximation using an inverse hyperbolic function The approximation formula of Eq. 6 is introduced below. Considering the experimental condition, the following inequalities hold:
 |
Therefore, Eq.6 is rewritten into the following form:
 |
This result is expressed using the inverse hyperbolic tangent as follows:
 |
Expanding the inverse hyperbolic tangent to a power series and approximating it with its first term results in the following approximation:
 |
By transforming Eq.10, C234 nm is expressed by Eq.11 as a function of time t.
 |
When tv = 0 and CCOOH,v = 0, the replacement of k′2/2 in Eq. 11 with a rate constant k results in Eq. 12, which has been proposed in the previous study (Shima and Sakashita, 2016):
 |
CCH is the concentration of the hydrocarbon at the bisallylic position.
Eq. 11 is equivalent to Eq. 12, except that the vertex of the curve moves from the origin to the point t = tv and C = CCOOH,v. To compare the two equations, the rate constants k and k′ were estimated independently using the experimental results. The resultant k and k′2/2 values are listed in Table 1 and resemble each other for each sample. The solid curves in Fig. 4 were plotted using Eq. 11, and express the experimental results well. Eq. 11 was a practically applicable approximation equation for the oxidation process in this study. In detail, there were some differences between k and k′2/2, which gradually became larger as the concentration of the primary oxidation product increased (Table 1). Therefore, the quadratic equation model appeared to be more applicable within the earlier periods of oxidation than the square root autocatalytic equation model. Furthermore, because the optimization process of the parameters of the square root autocatalytic equation model required appropriate initial values, the parameters obtained from the optimization using the quadratic equation model were good candidates.
| Sample | k [L/mol h2] for Eq. 12 | k′2/2 [L/mol h2] |
|---|---|---|
| A | 1.1 × 10⁻⁶ | 0.99 × 10⁻⁶ |
| B | 1.6 × 10⁻⁶ | 1.9 × 10⁻⁶ |
| C | 1.6 × 10⁻⁶ | 2.1 × 10⁻⁶ |
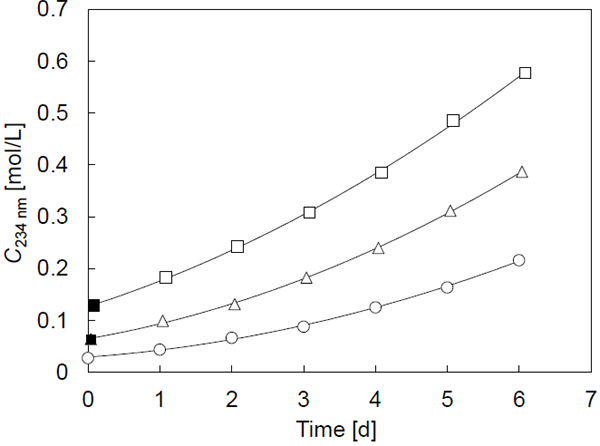
Time courses of C234 nm. Symbols are the same as Fig. 3. Solid lines are drawn using Eq.22.
Therefore, the model proposed in this study would reflect the phenomena occurring in the early stage of lipid oxidation and would be applicable to analyze the oxidation processes of pre-treated and hydroperoxide-containing lipids.
The oxidation processes of linoleic acid at 5 °C after a high-temperature treatment at 50 °C differed from each other and could not be explained without the contribution of accumulated primary oxidation products at the start of oxidation at 5 °C. This oxidation process is well described by the square root autocatalytic equation for lipid oxidation and its approximation expression. Thus, the square root autocatalytic model is applicable for estimating the rate constant in the initial oxidation process of partially oxidized lipids.
Acknowledgements The author thanks Dr. Shuji Adachi at Kyoto University of Advanced Science for his thoughtful and detailed discussions, and Dr. Yayoi Miyagawa at the same university for useful information.