Materials and Methods
Materials Commercially available konjac (Co-op Kobe, Kobe, Japan) and soy sauce (Kikkoman, Chiba, Japan) were purchased from a local supermarket in Kobe. Dried egg white powder (type K, No. 10) was obtained from Kewpie Egg (Tokyo, Japan). D(+)-glucose, sodium chloride, liquid paraffin, and a glucose CII-test kit were purchased from FUJIFILM Wako Pure Chemical Corporation (Osaka, Japan).
Preparation of egg white gel Dried egg white powder (type K, No. 10) was dissolved in seven times its weight of ion-exchanged water. The solution was centrifuged using a centrifugal separator (himac CR 21GII; Koki Holdings, Tokyo, Japan) at 12 000 rpm (approximately 18 800 × g) for 15 min at 4 °C to obtain the supernatant. The absorbance of the supernatant diluted 500 times and measured at 280 nm using a U-2000 spectrophotometer (Hitachi, Tokyo, Japan) or a Cary 3500 UV-Vis spectrophotometer (Agilent Technologies Japan, Tokyo, Japan) was approximately 0.23, and this value did not change remarkably in repeated experiments.
The obtained supernatant was poured into a plastic cup (LS115-200T, 114.5 mm in width × 114.5 mm in depth × 25.7 mm in height; Tokan Kogyo, Tokyo, Japan) to a depth of approximately 15 mm, and heated in a steam bath for 20 min. A T-fal steam cooker (Groupe SEB Japan, Tokyo, Japan) or a hand-made steamer was used for heating. When the egg white solution was directly poured into the plastic cup, the obtained heat-set gel adhered to the plastic cup, and it was difficult to separate the gel from the cup without causing a collapse. To avoid this problem, a light coating of liquid paraffin was applied to the cup before the pouring of the egg white solution to improve the mold-releasability of the egg white gel after heating. The procedure of coating paraffin onto the mold when preparing the egg white gel was adopted from a previous report (Nakagawa et al., 1994). After the egg white gel was separated from the cup, the five sides of the gel that were in contact with the walls and bottom of the cup were trimmed by 5 mm; the trimmings were not used for any of the experiments. The obtained gel is hereafter referred to as the egg white gel.
Moisture content of konjac and egg white gel The moisture contents of konjac and egg white gel were measured by drying them at 135 °C for 5 h using a DV600 constant-temperature oven (Yamato Scientific Co., Ltd., Tokyo, Japan). The weight change after drying was calculated and regarded as the moisture content.
Measurement of the distribution coefficient Model food samples (konjac and egg white gel) were cut into cubes of approximately 10 mm. Five grams of these samples were precisely weighed and soaked in glucose and sodium chloride solutions, the concentrations of which ranged from 10 to 100 kg/m3 and from 3 to 150 kg/m3, respectively. The volume of the solution was approximately 80 mL, and it was replaced several times at appropriate time intervals. After soaking for more than 20 h, the konjac or egg white gel was removed from the solution. The glucose and sodium chloride that had sorbed onto the model foods were extracted and analyzed using the methods described below. To measure the distribution coefficients, a CSH-110 thermostat chamber (Espec, Osaka, Japan) was used to maintain the experimental temperature at 25 °C, 40 °C, 50 °C, or 60 °C, and a URD-50MRF refrigerator (Fukushima Galilei, Osaka, Japan) and an NTB-221 programmable precision bath (Tokyo Rikakikai, Tokyo, Japan) were used to maintain the temperature at 4 °C and 80 °C, respectively.
Determination of the effective diffusion coefficient The effective diffusion coefficients of glucose and sodium chloride in konjac and egg white gel were determined by estimating the temporal increase in the sorbed amounts. Briefly, 5 g of sample cubes were soaked in a solution containing 10 kg/m3 of glucose or sodium chloride, as described above. The sorbed amounts were estimated after an appropriate time interval using the procedure mentioned in the previous section. To determine the maximum sorption amounts of glucose and sodium chloride, we analyzed the sorbed amounts after 6 h.
To measure the effective diffusion coefficients, the experimental temperature was maintained at 25 °C and 60 °C using the CSH-110 thermostat chamber along with an MLR-350H plant growth chamber (PHC Holdings, Tokyo, Japan) at 5 °C and a Viscomate VM-150F bath (Toki Sangyo, Tokyo) at 80 °C.
Measurement of the distribution coefficient in multicomponent systems Three different methods were adopted to investigate the sequence of the sorption of seasoning compounds. Model foods were soaked in either a glucose and sodium chloride solution, glucose and sodium chloride solution after equilibration in glucose solution, or glucose and sodium chloride solution after equilibration in sodium chloride solution. In this experiment, the concentrations of both glucose and sodium chloride were fixed at 10 kg/m3. To achieve sorption equilibrium, the model foods were soaked in the respective solutions for more than 20 h during each soaking process. The other conditions were the same as those described in the previous sections.
Extraction of glucose and sodium chloride from the model foods The model foods (konjac or egg white gel) were ground using a mortar and pestle, and 50 mL of ion-exchanged water was added to the mortar. After 30 min, the mixture was filtered using No. 2 filter paper (Toyo Roshi Kaisha, Tokyo, Japan). The obtained filtrate was diluted to a volume of 50 mL, and used for the analysis of the glucose and sodium chloride contents.
Analysis of glucose and sodium chloride Glucose and sodium chloride concentrations were estimated using the glucose CII-test kit and a SAT-500 salt analyzer (DKK-Toa, Tokyo, Japan), respectively. For the glucose assay, the absorbance of the reaction mixture was measured at 505 nm using the U-2000 spectrophotometer or the Cary 3500 UV-Vis spectrophotometer. When using the SAT-500 salt analyzer, the injection volume of each sample was 200 µL.
Results and Discussion
Heating conditions during the preparation of the egg white gel The temperature of the center of the egg white solution during heating was above 75 °C for the last 5 min, and it was heated until it finally reached 85 °C. The atmospheric temperature in the steam bath was above 95 °C during heating. It has been reported that coagulation and precipitation of the proteins occur in egg white when the egg white solution is heated at 74 °C for 5 min (Akkouche et al., 2012). We supposed that heating in a steam bath above 95 °C for 20 min was sufficient to complete the gelation of the egg white solution.
It is well-known that the heating conditions of egg white solution, such as the temperature and duration, affect the obtained heat-set egg white gel (Doi and Kitabatake, 1989). In this experiment, instead of studying the effects of heating conditions on the properties of egg white gel, we employed a method of egg white gel preparation that repeatedly yielded gels with constant properties. Thereafter, we analyzed the experimental data assuming that all of the experiments were performed using egg white gels with the same properties.
Moisture content of the konjac and egg white gel The moisture contents of the konjac and egg white gel, measured using the drying method, were 96.1% ± 0.1% and 89.6% ± 0.2% (w. b.), respectively (n = 5). The solid contents of the konjac and egg white gel were 3.9% and 10.4% (w. b.), respectively. Although the solid content of the egg white gel was twice that of konjac, the concentration used was deemed necessary because of the poor gelation properties of egg white at lower concentrations.
Temperature dependence of the distribution coefficients In preliminary experiments, we investigated the temporal changes in the amounts of glucose sorbed onto konjac at 25 °C for 1, 2, 4, 6, and 20 h (data not shown). We found that the amount of sorbed glucose did not change between 6 and 20 h. To ensure equilibrium, we employed a soaking time of 20 h to measure the distribution coefficients.
The sorption isotherms of glucose and sodium chloride onto konjac and egg white gel were measured over a temperature range of 4 °C to 80 °C, and some representative isotherms are shown in Fig. 1. The selection criterion for egg white gel and konjac as model foods was the presence and absence of an electrical charge on their skeleton molecules, respectively, as mentioned in the Introduction section. All of the sorption isotherms, including those shown in Fig. 1, were linear. Assuming that Henry's law could be applied to the sorption of glucose and sodium chloride onto konjac and egg white gel, Eq. 1 was employed to define the distribution coefficient of the seasoning compounds onto the model foods, KD [m3/kg].
where C [kg/m3] is the concentration in the liquid phase, and q [kg/kg] is the amount of sorbed seasoning compound. The initial concentrations of both glucose and sodium chloride in konjac and egg white gel were 0 kg/kg.
Fig. 2 shows the temperature dependence of the distribution coefficient. As shown in the figure, the distribution coefficients decreased with increasing temperature. The distribution coefficients of glucose and sodium chloride on konjac were similar at a given temperature, but the distribution coefficients of sodium chloride on egg white gel were lower than those of glucose. This difference in the distribution coefficients on egg white gel at certain temperatures may be attributable to the electrostatic repulsion between egg white protein and sodium chloride, which does not occur between egg white gel and glucose.
The enthalpy change of the distribution, ΔH [J/mol], and the entropy change, ΔS [J/(mol·K)], were calculated from the temperature dependence of the distribution coefficients by applying the Van 't Hoff equation (Eq. 2).
where R [J/(mol·K)] is the gas constant, and T [K] is the absolute temperature.
The calculated values of ΔH and ΔS are listed in Table 1. The values of ΔH were independent of the combination of the model food and seasoning compound, and ranged from −2.5 to −1.6 kJ/mol. The values of ΔS ranged from −10.6 to −9.3 J/(mol·K). The changes in Gibbs free energy calculated at each experimental temperature from the values of ΔH and ΔS in Table 1 were all positive irrespective of the experimental temperature. These positive changes in Gibbs free energy were inconsistent with the sorption occurring spontaneously; this might have resulted from the fact that the ΔH values obtained in our study were relatively low when compared to that representing an ion exchange interaction between crystalline antimonic (V) acid and alkali metal ions, such as sodium and potassium ions, which has been reported to be about −25 kJ/mol (Abe, 2001). The relatively weak temperature dependence of the distribution coefficients might have caused the low values of the estimated ΔH, which could not offset the negative values of ΔS. The low values of ΔH also suggest that when glucose and sodium chloride permeate into konjac and egg white gel, they do not interact strongly with the gel skeleton, but simply penetrate the porous regions in the gel.
Table 1.
Enthalpy change and entropy change of sorption
|
Konjac |
Egg white gel |
|
Glucose |
Sodium chloride |
Glucose |
Sodium chloride |
| Enthalpy change [kJ/mol] |
−2.4 |
−2.5 |
−2.2 |
−1.6 |
| Entropy change [J/(mol·K)] |
−10.5 |
−10.6 |
−9.3 |
−9.6 |
Temperature dependence of the effective diffusion coefficients The temporal changes in the amounts of glucose and sodium chloride sorbed onto konjac and egg white gel were measured to estimate the effective diffusion coefficients. The temporal changes in the amounts of glucose sorbed onto konjac and egg white gel at 25 °C and 60 °C are shown in Fig. 3. By applying Eq. 3 and the calculation methods described in previous reports (Crank, 1975; Nakanishi et al., 1977; Odake et al., 1990; Sakai, 1991) to the experimental data, the effective diffusion coefficient, Deff [m2/s], was calculated for each experiment. The solid curves in Fig. 3 show the lines calculated using Eq. 3 and the estimated Deff values, which were in good agreement with the experimental values.

where l [m] (5 × 10⁻³ m) is the characteristic length of konjac or egg white gel, t [s] is time, q0 and qt [kg/kg] are the sorbed amounts at time 0 and t, respectively, and q∞ [kg/kg] is the maximum sorbed amount. Letters m,n, and p express all integers larger than 0 used in the sigma calculation.
The temperature dependence of the calculated Deff values is shown in Fig. 4. The Deff values ranged from 10−10 to 10−8 m2/s, with the same order of magnitude as those reported based on previous studies on other foods (Morris et al., 1985; Turhan and Kaletunç, 1992). In the same model food, the Deff values of sodium chloride tended to be higher than those of glucose, which reflects its smaller molecular size and faster diffusion in food, as shown by the Stokes–Einstein equation (Edward, 1970; Young et al., 1980).
As shown in Fig. 4, the Deff values increased with the temperature. By applying the Arrhenius equation (Eq. 4) to the temperature dependence of Deff, the activation energy, Ea [J/mol], was calculated.
where A [m2/s] is the frequency factor. The calculated Ea values are presented in Table 2. The Ea values of glucose and sodium chloride did not differ greatly in the same model food, but those of both glucose and sodium chloride in konjac were larger than those in egg white gel. In other words, diffusion in konjac is more sensitive to temperature changes than diffusion in egg white gel. The diffusion temperature dependence of seasoning compounds in model foods may be influenced by the type of food rather than by the type of seasoning compound.
Table 2.
Activation energy of diffusion
|
Activation energy [kJ/mol] |
|
Glucose |
Sodium chloride |
| Konjac |
16.2 |
17.5 |
| Egg white gel |
8.1 |
9.8 |
A comparison of Fig. 2 and Fig. 4 showed that the equilibrium sorbed amounts of seasoning compounds became lower at higher temperatures, whereas the diffusion rate was higher at higher temperatures. We employed distribution coefficients as representative values of the sorption equilibrium, and analyzed them using the Van 't Hoff equation (Eq. 2). The lower values of the distribution coefficients at higher temperatures resulted in negative values of enthalpy change, as shown in Table 1. In contrast, the temperature dependence of the diffusion coefficients was considered to obey the Arrhenius equation (Eq. 4). The diffusion coefficient increases with the temperature, because the value of activation energy in Eq. 4 is always positive. The results shown in Fig. 4 are consistent with this rule.
The Ea values for several seasoning compounds have been reported. For example, the Ea values of sodium chloride in potatoes are approximately 20 to 24 kJ/mol (Liu, 1992), whereas those in white cheese are approximately 23 to 30 kJ/mol (Turhan and Kaletunç, 1992). Although the Ea values obtained in this study for konjac and egg white gel were lower than previously reported values, this could be attributed to the structural and compositional complexity of the sample foods, such as the presence of cell walls in potatoes or emulsion-containing milk fat in cheese. Changes in the value of Deff at high temperatures are considered to be due to both an increase in the molecular diffusion coefficient of glucose or sodium chloride and a change in the pore size of the model food. Compared to potatoes (Liu, 1992) and white cheese (Turhan and Kaletunç, 1992), the microstructure of konjac and egg white gel may not be complex. Hence, the temporal changes in the microstructure of the model foods in our research might not have been as drastic as those of complex foods, although some intermolecular bonds might have formed between egg white proteins, as will be discussed below. This could be the reason why the activation energy of diffusion was smaller than that in previous reports, because the change in the value of Deff was mainly due to a change in the molecular diffusion coefficient.
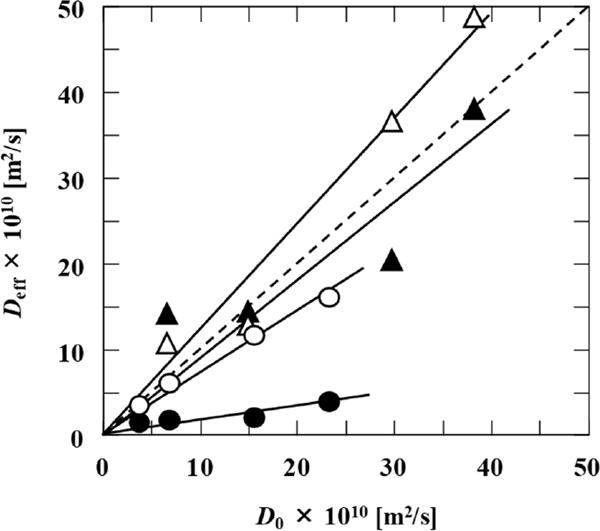
Relationship between the effective diffusion and molecular diffusion coefficients Fig. 5 shows the relationship between the molecular diffusion coefficients in the dilute solution (D0 [m2/s]) and the effective diffusion coefficients (Deff [m2/s]) of glucose and sodium chloride in each model food. The values of the molecular diffusion coefficients of glucose were calculated using Eq. 5, which was derived from reported data (Ribeiro et al., 2006) by applying the Arrhenius equation. The molecular diffusion coefficients of sodium chloride at each temperature were calculated from the temperature dependence represented by Eq. 6, as reported elsewhere (Caldwell, 1973).
where D0, Glucose and D0, NaCl [m2/s] are the molecular diffusion coefficients in dilute solutions of glucose and sodium chloride, respectively.
In Fig. 5, four points with the same symbols represent the results at 5 °C, 25 °C, 60 °C, and 80 °C from the left of the horizontal axis. As shown in Fig. 5, the effective diffusion coefficients (Deff) of glucose in konjac and egg white gel (empty and filled circles, respectively) and sodium chloride in egg white gel (filled triangles) are lower than the molecular diffusion coefficients (D0). Furthermore, the Deff values of sodium chloride in konjac (empty triangles) are slightly higher than the D0 values. The apparent inconsistency between the estimated Deff of sodium chloride in konjac and the cited D0 may be because the precise measurement of D0 is much more difficult than that of Deff.
Although there is a good correlation between the experimental Deff values of glucose and sodium chloride in konjac and the cited D0 values (R2 > 0.95), the Deff and D0 for egg white gel exhibit a weak correlation (R2 < 0.70). The slope of the straight line in Fig. 5 is called the hindering factor, which accounts for the structural effect of the gel and chemical interactions between the gel and solutes (Lamberg, 1990; Varzakas and Tzia, 2014). The results shown in Fig. 5 suggest that the hindering factor of egg white gel is affected by temperature changes. In other words, the structure of egg white gel or the chemical interaction between egg white gel and solutes may change with the temperature. Shimizu et al. (1991) reported that when transparent ovalbumin gel was heated below 100 °C and cooled repeatedly, intermolecular disulfide bridges formed, resulting in the polymerization of the denatured ovalbumin. Although the preparation method of egg white gel in this work was different, the observed change in the hindering factor might have been because of the formation of similar intermolecular covalent bonds at high temperatures.
Distribution coefficients in multi-component systems To demonstrate the practical applicability of the model system to manufacturing processes, the distribution coefficients in multi-component systems were measured. Fig. 6 shows the relationship of the distribution coefficients in single- and binary-component systems containing glucose and/or sodium chloride.

In this study, three different methods were adopted to investigate the sequence of sorption of seasoning compounds, namely, model foods were soaked in either glucose and sodium chloride solution (shown as circles in Fig. 6), glucose and sodium chloride solution after equilibration in glucose solution (shown as triangles in Fig. 6), or glucose and sodium chloride solution after equilibration in sodium chloride solution (shown as rectangles in Fig. 6). In Fig. 6, the symbols represent the distribution coefficients of sodium chloride on egg white gel (0.61), sodium chloride on konjac (0.73), glucose on konjac (0.74), and glucose on egg white gel (0.82) from the left of the horizontal axis.
The three kinds of symbols (circles, triangles, and rectangles) show similar values for each combination of model food and seasoning compound, which suggests that the sequence of glucose and sodium chloride sorption does not affect the total sorbed amounts in the binary-component system. Moreover, for the sorption of glucose onto konjac, sodium chloride onto konjac, and sodium chloride onto egg white gel, the distribution coefficients were similar in the single- and binary-component systems. In contrast, for the sorption of glucose onto egg white gel, the distribution coefficients in the binary-component system were approximately 0.2 units lower than those in the single-component system. In other words, the amount of glucose sorbed onto egg white gel decreased when sodium chloride coexisted in the liquid phase. Moreover, the decrease in the amount of glucose sorbed onto egg white gel in the binary system was not affected by the sequence of sorption of glucose and sodium chloride, as the three soaking patterns showed similar values.
Only the values of the distribution coefficients of glucose on egg white gel in the binary system decreased. Nakamura et al. (1958) reported that the amount of saccharides adsorbed onto an anion-exchange resin decreased when sodium chloride was added to the saccharide solution. They concluded that the decrease in the adsorbed amount was because of ion exchange between the counter anion in the resin and the chloride anion in solution. Taking their report into account, the decrease in the distribution coefficient of glucose on egg white gel in the binary system was due to a similar ion exchange between the ions in egg white gel and sodium or chloride ions.
We also compared single- and multi-component systems using soy sauce as the liquid phase. The amounts of sodium chloride sorbed onto konjac and egg white gel were measured at 25 °C. Sodium chloride solutions with different concentrations and commercially available soy sauce were used as the liquid phase. The concentration of sodium chloride in soy sauce was determined to be 174 kg/m3. When sodium chloride solution was used as the liquid phase, the sodium chloride distribution coefficients (average ± standard deviation) on konjac and egg white gel were 0.73 × 10⁻³ ± 0.03 × 10⁻³ m3/kg and 0.61 × 10⁻³ ± 0.03 × 10⁻³ m3/kg, respectively (Fig. 2). In contrast, when soy sauce was used as the liquid phase, the sodium chloride distribution coefficients in konjac and egg white gel were 0.52 × 10⁻³ ± 0.00 × 10⁻³ m3/kg (n = 3) and 0.41 × 10⁻³ ± 0.01 × 10⁻³ m3/kg (n = 3), respectively, which were lower than when sodium chloride solution was used. Nanbu et al. (1995a, 1995b, 1997) reported that the amounts of sorbitol sorbed onto walleye pollock in the presence and absence of sodium chloride varied considerably, whereas those of sodium chloride were not affected by the presence of sorbitol. They attributed the changes in the amounts of sorbed sorbitol to fish denaturation proteins and the polymerization of myosin heavy chains during sodium chloride penetration. Other researchers have also reported that when soy sauce is used as the liquid phase, temporal changes in the amount of sodium chloride and monosodium glutamate sorbed onto potatoes and whale meat are higher than those when a single component solution of sodium chloride or monosodium glutamate is used (Take and Otsuka, 1968; Take and Otsuka, 1973). They concluded that the increase in the amounts of sorbed sodium chloride and monosodium glutamate might have been because of the synergistic effect of these two seasoning compounds. In our research, opposite results were obtained. It is known that synthetic resins are used in the decoloring process of soy sauce (Furuta, 1967). The residues of konjac and egg white gel after extraction with ion-exchanged water were slightly brown in color, indicating that the color pigment originating from soy sauce had moved into the konjac and egg white gel. Odake (2010) reported that soy sauce pigment moved into hanpen (Japanese fish cake) after 24 h of soaking. As mentioned previously, sodium or chloride ions may be exchanged with the ions in egg white gel. The amounts of sorbed sodium chloride can decrease when the color pigment in soy sauce is competitively adsorbed onto the ionic section of egg white gel. Both our study and previous reports suggest that when several kinds of seasoning compounds penetrate foodstuffs simultaneously, interactions between the seasoning compounds and food as well as between the compounds themselves play important roles.