Technical paper
Effects of taro (Colocasia esculenta L. Schott) drying on the properties of taro flour and taro flour products
2021 Volume 27 Issue 3 Pages 369-379
Details
2021 Volume 27 Issue 3 Pages 369-379
We examined the effect of taro drying processes on the properties of taro flour and taro flour products. Taro flour produced by blast-drying with hot air was characterized by the formation of aggregated starch granules during storage. Consequently, pastes made from blast-dried flour exhibited higher hardness and adhesiveness than pastes made from fresh taro. Pastes made from freeze-dried flour exhibited similar increases in hardness and adhesiveness due to the formation of aggregated starch granules during heating. Starch granules did not aggregate in flour that was blast-dried after heating, and the hardness and adhesiveness of pastes were lower than those of fresh taro. Bread substituted with 10 % blast-dried flour after heating exhibited softening and increased cohesiveness. The results demonstrated that the drying processes of taro flour have a marked effect on the texture of products by affecting the aggregation and swelling of starch granules.
Taro (Colocasia esculenta L. Schott), a starchy root crop that has been cultivated in many regions of the world since ancient times, is an important carbohydrate source in Africa and Asia, including Japan. However, unlike potatoes and sweet potatoes, the high water content of taro means that the crop cannot be stored for extended periods of time (Huang et al., 2000), and tubers are known to start rotting as early as two weeks after harvesting (Njintang and Mbofung, 2006). Consequently, taro flour is commonly used instead of fresh taro to make dishes that would typically be produced by boiling, peeling, and then pounding the taro tubers into a smooth and homogenous paste using a mortar, such as taro flour achu in Cameroon (Njintang and Mbofung, 2003a; Njintang et al., 2006; Njintang et al., 2007; Njintang et al., 2008a).
When fresh taro is processed into flour, its storability is greatly improved and it can be widely used in the food industry as a raw material for processed foods containing starch as their main component. Further, some of the starch contained in taro changes to resistant starches during the drying process (Arici et al., 2016). These resistant starches have a lower glycemic index than native taro starch, and they also exhibit a cholesterol-adsorbing capacity (Simsek and El, 2012), making them a promising material for producing functional foods. Thus, processing fresh taro into flour is advantageous in terms of storability, convenience, and functionality.
Numerous studies have been conducted on the preparation of taro flour. These studies have shown that taro flour exhibits different properties depending on the precooking conditions (Njintang and Mbofung, 2006; Kumar et al., 2017), drying temperature, drying time and the volume of air used for drying (Arici et al., 2016). However, many of the factors that effect changes in the properties of taro flour during the drying process remain to be clarified. Indeed, with the exception of achu production, very little is known about the effect of different taro flour characteristics on products prepared using taro flour.
In this study, four types of taro flour were prepared by freeze-drying and blast-drying. The effect of these drying processes on the components of fresh taro, as well as on the particle size and pasting properties of the taro flour, was therefore investigated. In addition, taro paste and bread made with 10 % of wheat flour substituted with the four kinds of taro flour were prepared, and the effect of the taro flour properties on the texture of the products was clarified.
Materials The taro used in this study, known locally as dodare, belongs to a group that is widely produced in Japan. Dodare was purchased from a grocery store in Shizuoka city. Table 1 shows the proximate composition of fresh dodare as analyzed by Japan Food Research Laboratories (http://www.jfrl.or.jp/). Hard wheat flour (‘Camellia’, Nisshin Flour Milling, Tokyo, Japan), superfine sugar (Fuji Nihon Seito, Tokyo, Japan), non-fat dry milk powder (Megmilk Snow Brand, Tokyo, Japan), unsalted butter (Megmilk Snow Brand), refined salt (The Salt Industry Center of Japan, Tokyo, Japan) and instant yeast (‘Super Camellia granule’, Nisshin Foods, Tokyo, Japan) were used as the breadmaking ingredients.
| Moisture | Protein | Fat | Ash | Carbohydrates | ||
|---|---|---|---|---|---|---|
| Sugar | Fiber | |||||
| (g/100 g)* | 81.3 | 1.9 | 0.2 | 1.3 | 12.7 | 2.6 |
Preparation of taro flour Four types of taro flour were prepared according to the method of Arici et al. (2016). Fresh taro tubers were washed with tap water, peeled, and sliced to a thickness of approximately 5 mm. These samples were divided into four lots. One lot was frozen in a freezer at −70 °C and then freeze-dried for approximately 24 h using a freeze dryer (FDU-810, Tokyo Rikakikai, Tokyo, Japan). Two lots were placed on a silicon net in a tray and dried at 60 °C or 80 °C for approximately 8 h using a blow dryer (OFX-50, Asone, Tokyo, Japan). The remaining lot was placed on a cooking sheet and steamed for approximately 15 min using a steamer. After steaming, the lot was placed on a tray and dried using a food dryer (DSJ-mini, Shizuoka Seiki, Shizuoka, Japan) at 50 °C for approximately 7 h. The dried taro slices were then pulverized using a test mill (OML-1, Osaka Chemical, Osaka, Japan) and passed through a 150-µm sieve. The sieved fraction was then sealed in a plastic container and stored in a refrigerator at 4 °C. Hereafter, the freeze-dried taro flour is referred to as FD, the taro flour dried at 60 °C and 80 °C is respectively referred to as BD60 and BD80, and the taro flour dried after steaming is referred to as SBD. Approximately 130 g of FD, 125 g of BD60 and BD80, and 120 g of SDB flours were obtained from approximately 1 kg of fresh taro, respectively. The process of preparing flour from fresh taro was carried out three times each.
Moisture content Approximately 1 g of each of the taro flour samples was collected and the moisture content was measured by heating at 120 °C using an electronic moisture meter (MOS-120H, Shimadzu, Kyoto, Japan).
Degree of gelatinization The degree of gelatinization of BD60, BD80 and SBD was measured by the glucoamylase method. The measurement was performed by Japan Food Research Laboratories.
Observation by scanning electron microscope (SEM) A small amount of taro flour was placed on a sample stage with conductive double-sided tape and observed under an SEM (TM-1 000, Hitachi High-Tech, Tokyo, Japan) at a magnification of 250x.
Particle-size distribution measurement The particle-size distribution of taro flour was measured in the dry mode using a laser scattering particle size distribution analyzer (LA-950 V2, Horiba, Kyoto, Japan). The measurement conditions were as follows. Transmittance: 91.1 %, compressed air: 0.40 MPa, repetition number: 15, frequency distribution: volume, refractive index: 1.6. The modal diameter and median diameter (D50) were calculated from the obtained particle size distribution curve.
Color The color of taro flours was measured using a colorimeter (CR-300, Konica Minolta Japan, Tokyo, Japan) and expressed using the L*a*b* color system developed by the International Commission on Illumination (CIE1976). The whiteness index (WI) was calculated from the following formula.
 |
Pasting properties The pasting viscosity of taro flour and starch purified from fresh taro were measured using a Rapid Visco Analyzer (RVA, RVA-4, Perten Instruments, Hägersten, Sweden). Taro starch was prepared according to the method of Wickramasinghe et al. (2009). Water was added to the fresh taro slices to achieve a taro/moisture ratio of 3:4. After milling for 1 min using a mill-equipped mixer (BM-RS08, Zojirushi, Osaka, Japan), the mixture was first passed through a 250-µm sieve, followed by a 150-µm sieve. Next, the sieved material was centrifuged at 12 110 × g for 10 min using a centrifuge. The resulting precipitate was washed three times with 70 % ethanol, dried at room temperature, and passed through a 150-µm sieve.
Measurement conditions performed for the RVA followed the methods of Aric et al. (2016) and Sit et al. (2014). To obtain the suspension, 4.0 g of solid content for the flour and 3.5 g of solid content for the starch were mixed in 25.0 g and 24.5 g of water, respectively. The resulting suspension was held at 50 °C for 1 min, heated to 95 °C in 3.7 min, and then held at 95 °C for 2.5 min. Then, the suspension was cooled to 50 °C in 3.8 min and held at 50 °C for 2.0 min. From the obtained RVA curve, pasting temperature, peak, trough, breakdown, setback and final viscosities were determined using the supplied software.
Formulation of taro paste The moisture content of the taro paste was set to approximately 80 % to correspond with that of paste prepared from fresh taro. The FD, BD60 and BD80 pastes were prepared as follows. Taro flour (5 g) was transferred to a beaker (100 mL), water was added at the ratio of 4:1, the paste was stirred, covered with plastic film, and heated for 15 s at 600 W in a microwave oven (ER-R6, Toshiba Lifestyle Products & Services, Kanagawa, Japan). After heating, the beaker was taken out of the microwave oven and stirred, and the heating step was repeated. After allowing the paste to cool at room temperature, the amount of water lost to evaporation was replaced, and the sample was stirred again to obtain a paste. The SBD paste was prepared by adding water to the flour at a ratio of 4:1 followed by stirring. Paste made with fresh taro was used as a control paste (Ctrl). After washing, the fresh taro was heated with the skin intact in a microwave oven for 5 min (per 100 g). After heating, the taro was allowed to cool before being peeled and cut into small pieces. Then, 150 g was milled into a paste for 2 min using a food processor (MK-K80P, Panasonic, Osaka, Japan). The rate of moisture loss due to heating and milling ranged from 1.3 % to 1.9 %.
Texture of taro paste Hardness, cohesiveness and adhesiveness of the pastes were measured using a universal testing machine (RE 2-33005s, Yamaden, Tokyo, Japan). The paste was placed in a glass petri dish with a diameter of 30 mm and a height of 15 mm. Using a cylindrical plunger with a diameter of 8 mm, compression was performed twice at a compression speed of 1 mm/s with a clearance of 5 mm. Hardness, cohesiveness and adhesiveness were then calculated from the texture profile curve using the supplied software.
Formulation of bread substituted with taro flour The ingredients of the bread produced using wheat flour substituted with 10 % taro flour are shown in Table 2. A breadmaking machine (SD-BMS151, Panasonic) was used to bake the bread. After baking, the bread was removed from the tray and cooled in an incubator (KCL-2000A, Tokyo Rikakikai) at 20ºC and 60 % relative humidity for 2 h. After cooling, the bread was double-wrapped in plastic film and stored in the same incubator. Bread prepared without taro flour substitution was used as the control bread (Ctrl).
| Ingredient | Bread | ||
|---|---|---|---|
| Ctrl | Substituted with 10% taro flour | ||
| Flour | Hard wheat | 280 g | 252 g |
| Taro (FD/BD60/BD80/SBD) | − | 28 g | |
| Sugar | 12 g | ||
| Butter | 10 g | ||
| Salt | 4.7 g | ||
| Non-fat dry milk powder | 6 g | ||
| Instant yeast | 2.7 g | ||
| Water | 210 g | ||
FD, taro flour prepared by freeze-drying; BD60, taro flour prepared by blast-drying at 60 °C; BD80, taro flour prepared by blast-drying at 80 °C; SBD, taro flour prepared by blast-drying at 50 °C after steaming.
Specific loaf volume (SLV), moisture content and texture of bread At 2 h after baking, the bread was weighed and its volume was measured using the rapeseed displacement method. The SLV (mL/g) was calculated as the ratio of the bread volume to the mass of the bread. The moisture content of the bread crumb at 24 h after baking was measured. To assess crumb hardness and cohesiveness, the bread loaves were sliced to a thickness of 20 mm from the longitudinal section at 24 h after baking using an electric slicer, and 20 cubic samples (20 mm per side) were obtained from each loaf using an ultrasonic cutter (USC-3305, Yamaden). Hardness and cohesiveness were measured using a universal testing machine with a cylindrical plunger (diameter, 30 mm) at a rate of 1 mm/s and 60 % compression in reference to the method of Sugiura et al. (2017). Hardness and cohesiveness were calculated from the texture profile curve using the supplied software.
Statistical analysis All measurements were performed in triplicate or more and each value was expressed as the mean ± standard deviation (SD). The results were evaluated by ANOVA. The means were compared by Tukey's test with statistical significance set at p < 0.05.
Characteristics of taro flour produced using different drying processes Two methods were used to dry the fresh taro: freeze-drying (FD), which does not affect the components, and blast-drying (BD), which is cheaper than freeze-drying in practical terms. Further, three different blast-drying treatments were tested; namely, blast-drying at 60 °C (BD60), where starch swelling and protein heat denaturation start, blast-drying at 80 °C (BD80), where the effect of heat is greater compared with 60 °C, and blast-drying at 50 °C, which was applied after steaming the fresh taro (SBD).
The moisture content of the taro flour immediately after grinding was 5.85 ± 0.50 % for FD, 6.41 ± 0.29 % for BD60, 6.49 ± 0.14 % for BD80, and 8.33 ± 0.55 % for SBD, all of which are suitable for long-term storage. The degree of gelatinization of taro flour starch was 6 % for BD60, 5 % for BD80, and 94 % for SDB. Thus, most of the starches in the BD60 and BD80 samples were ungelatinized, and most of those in the SBD sample were gelatinized.
SEM imaging of the FD samples showed individual taro starch granules and starch agglomerates comprised of multiple granules (Fig. 1). In the BD60 samples, in addition to starch granules, the starch agglomerates were larger than those in the FD samples. In the BD80 samples, the agglomerates were larger and more numerous than those in the BD60 samples. Unlike the FD and BD samples, starch granules were not observed in the SBD samples, and agglomerates with a smooth surface were observed.
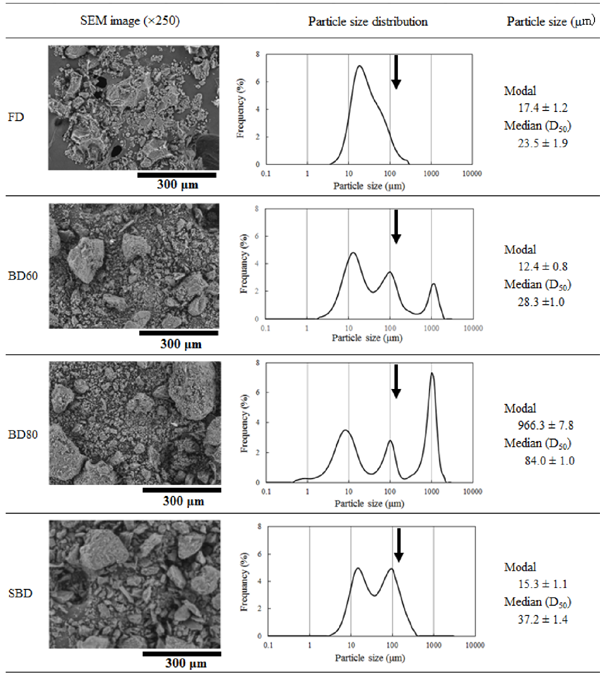
Scanning electron microscope image and particle size of taro flours processed in different ways during flour production.
FD, taro flour prepared by freeze-drying; BD60, taro flour prepared by blast-drying at 60 °C; BD80, taro flour prepared by blast-drying at 80 °C; SBD, taro flour prepared by blast-drying at 50 °C after steaming. The downward pointing arrows indicate the mesh siz. (150 µm) of the sieve used. Modal and median particle size are shown as mean ± standard deviation (n = 3).
Particle-size distribution measurements of the FD sample revealed a single peak at approximately 20 µm (Fig. 1). Since the particle size of taro starch typically ranges between 1–5 µm (Jane et al., 1992; Njintang et al., 2008b), it was considered that granules comprising dozens of individual granules were the most common in the FD sample. As in the FD sample, the particle-size distribution in the BD60 sample showed a maximum peak at approximately 20 µm, but peaks were also detected at approximately 100 µm and 1 000 µm. In the BD80 sample, three peaks were detected at approximately the same positions as in BD60, but the peak at 20 µm was lower and the peak at 1 000 µm was the highest. In the SBD sample, two peaks were detected at approximately 20 µm and 100 µm, but no peaks were detected in the vicinity of 1 000 µm. The modal diameter and median diameter (D50) of taro flour were greatest in the BD80 sample.
These results showed that the shape and size of taro flour particles changes depending on the drying process. Compared with the FD sample, the BD60 and BD80 samples had agglomerates that were even larger than compound granules of starch. The peak at approximately 100 µm was the maximum peak in achu made from fresh taro, and in achu prepared using taro flour made from dried taro, which was pulverized after boiling in water (Njintang et al., 2008a). Therefore, the peak at approximately 100 µm was attributed to particles that formed due to heat.
On the other hand, the peak at approximately 1 000 µm in the BD60 and BD80 samples was not detected in the FD and SBD samples, nor was it mentioned in Njintang et al. (2008a). The particle size of 1 000 µm is larger than the mesh size (150 µm, indicated by the dotted line in Fig. 1.) of the sieve used during powder preparation, suggesting that it may have been newly generated during storage. Since these agglomerates were not detected in the FD sample in which protein was not denatured, or in the SBD sample that was heat denatured, it was speculated that this was a hydrophobic effect caused by the partial denaturation of protein. When fresh taro is blast-dried at 60 °C or 80 °C, the three-dimensional structure of some of the protein is altered and the hydrophobic amino acids are exposed, which increases surface hydrophobicity and intermolecular association (Chanphai and Tajmir-Riahi, 2015). Further, Hoyos-Leyva et al. (2018) reported that the protein acts as an adhesive material, facilitating the aggregation of starch granules in spray-drying microencapsulation. Thus, it was speculated that in the BD60 and BD80 samples, protein adhered to the starch granules to form larger agglomerates during storage, and particles measuring approximately 1 000 µm were generated. In the case of the SBD sample, it was speculated that large particles were not generated because the protein was completely heat denatured and coagulated during the steaming process, and the starch that showed increased fluidity by gelatinization prevented association between proteins.
In the SBD sample, a peak at approximately 100 µm was also detected, and the same volume of peak was detected at approximately 20 µm. However, the starch granules seen in the FD sample were not observed in the SEM images. Therefore, it is speculated that the peak at 20 µm was not due to starch granules, but rather due to particles generated as the result of the gelatinized starch acquiring a glassy consistency and becoming friable upon drying.
Thus, the findings showed that the drying process of the taro affects the aggregation and friability of particles and changes the particle size of the flour.
Color of taro flour Since the color of flour is an important quality parameter that can influence its marketability, the color of taro flours was measured (Table 3). The FD sample had the highest L*, and the SBD sample had the lowest. Both the FD and BD60 samples had negative a* values indicating greenness, whereas the BD80 and SBD samples had positive a* indicating redness. For b*, all taro flours had positive values, which indicates yellowness; the BD60 sample had the highest b*, and the SBD sample had the lowest. The FD sample had the highest WI, and the SBD sample had the lowest WI.
| Color index | WI (%) | |||
|---|---|---|---|---|
| L* | a* | b* | ||
| FD | 96.27 ± 0.65a | −0.82 ± 0.02c | 7.76 ± 0.13c | 91.33 ± 0.23a |
| BD60 | 93.91 ± 0.34b | −0.06 ± 0.04b | 9.65 ± 0.12a | 88.59 ± 0.29c |
| BD80 | 94.49 ± 0.81b | 0.09 ± 0.02a | 8.55 ± 0.32b | 89.81 ± 0.24b |
| SBD | 89.95 ± 0.42c | 0.14 ± 0.05a | 5.60 ± 0.13d | 88.45 ± 0.36c |
The abbreviations used for taro flour samples are the same as in Table 2. WI, Whitness index. Data are shown as the mean ± standard deviation (n = 3). Means subscripted with different letters are statistically significant (p < 0.05).
Compared to the FD sample, all of the BD samples had significantly lower L* values. In addition, for the BD80 and SBD samples, which are markedly affected by heat, it was speculated that the a* value changed from green to red due to amino carbonyl reaction. The b* value can also increase due to amino carbonyl reaction. Njintang and Mbofung (2003b) reported that browning proceeded very rapidly at temperatures above 80 °C, with rapid development of an undesirable yellowish off-color. In addition, taro can be enzymatically browned by polyphenol oxidase (Xiao, 2020), which may increase the b* value. The higher b* value of BD60 than BD80 was thought to be due to the higher residual activity of the enzyme at 60 °C than at 80 °C. On the other hand, the SBD sample had lower L*, a*, and b* values compared to taro flour produced using a method very similar to that of Kaushal et al. (2012). Therefore, the color of taro flour was considered to be greatly influenced by the taro variety and the cultivation method (Huang et al., 2007). On the other hand, Ganongo-Po et al. (2018) reported that taro flours comprised of smaller particles are whiter than those comprised of large particles. The finding that the WI of the SBD sample did not decrease significantly compared with that of the FD sample was considered to be because, in addition to the low b* value, a large number of fine particles were present.
These results showed that, compared to the FD sample, taro flour prepared by BD has a lower brightness and more redness, which decreases whiteness.
Pasting properties of taro flour Pasting properties play an important role in industry for selection as a thickener, binder or some other application (Brunnschweiler et al., 2005). Pasting properties are dependent on the rigidity of starch granules, which in turn affect granule swelling potential (Deka and Sit, 2016). RVA was therefore used to measure the pasting properties of starch fractionated from fresh taro in addition to taro flour (Fig. 2 and Table 4).

Rapid Visco Analyzer curves for taro flour samples and taro starch.
The abbreviations used for taro flour samples (gray lines) are the same as in Fig. 1. Taro starch (black line) was prepared from fresh taro.
| Pasting temperature (°C) | Viscosity (RVU) | ||||||
|---|---|---|---|---|---|---|---|
| Peak | Trough | Breakdown | Final | Set back | |||
| Taro flour | FD | 93.6 ± 1.2ab | N.D. | N.D. | N.D. | 406 ± 6b | N.D. |
| BD60 | 94.9 ± 0.1a | N.D. | N.D. | N.D. | 267 ± 6c | N.D. | |
| BD80 | 90.7 ± 0.5b | N.D. | N.D. | N.D. | 372 ± 3a | N.D. | |
| SBD | 50.2 ± 0.1c | 186 ± 14 | 151 ± 5 | 24 ± 7 | 228 ± 6d | 65 ± 2 | |
| Taro starch | 80.8 ± 0.8 | 234 ± 1 | 136 ± 2 | 101 ± 3 | 202 ± 5 | 65 ± 3 | |
The abbreviations used for taro flour samples are the same as in Table 2. Taro starch was prepared from fresh taro. RVU indicates a rapid viscosity unit. Data are shown as mean ± standard deviation (n = 3). N.D.: not detected. Means subscripted with different letters are statistically significant (p < 0.05).
Comparison of the RVA curves of the taro flour (gray lines in Fig. 2) and taro starch (black line in Fig. 2) revealed that they were markedly different. Taro starch had a pasting temperature of approximately 80 °C, which generally corroborated the findings of Sit et al. (2014), and typical peak, trough, breakdown, and setback viscosities were observed (Table 4). On the other hand, the pasting temperatures of the FD, BD60, and BD80 samples were in the vicinity of 90 °C, exceeding that of taro starch by about 10 °C or more. The increase in the viscosity of these samples was slow, but the viscosity increased significantly during the cooling process without causing a clear breakdown. The SBD sample had a pasting temperature of 50 °C, and viscosity was observed immediately after measurements were started. During heating, peak viscosity was generally maintained and the viscosity was higher than that of the FD, BD60 and BD80 samples; however, the viscosity increase during cooling was small and the final viscosity was lower than that of the FD and BD80 samples.
These results showed that the pasting properties of taro flour differed significantly from those of taro starch, suggesting that components other than starch are involved in the viscosity of taro flour. Huang et al. (2010) fractionated starch and mucilage separately from taro, and then performed RVA measurements on the separated starch sample and starch with mucilage added. They reported that the addition of mucilage increased the pasting temperature and lowered the peak viscosity. The increase in viscosity observed in the FD, BD60 and BD80 samples was slower than that of taro starch. In general, starches comprised of large particles, such as potato starch, show a higher rate of viscosity increase in RVA than wheat, maize and rice, which have smaller particles (Waterschoot et al., 2016). However, in taro flour, many small starch granules are assumed to be aggregated via proteins; thus, it was speculated that protein suppressed swelling, resulting in a slower viscosity increase compared with starch alone. In addition, it was speculated that in the BD60 and BD80 samples, the adhering particles gradually increased in size without causing a clear breakdown, and that hydrogen bonding during the cooling process increased the final viscosity. On the other hand, the viscosity of the FD sample continued to increase, similar to the BD60 and BD80 samples. This increase in the final viscosity of the FD sample is considered to be due to the denaturation of intact proteins in the FD sample during the heating process, causing the aggregation of starch granules and the formation of large particles, which became hydrogen-bonded without breaking down like they did in the BD60 and BD80 samples. According to Arici et al. (2016), breakdown was detected in the RVA measurements, even in taro flour that had been blast-dried. This difference in the obtained results is considered to have arisen due to differences in taro varieties and components, but this is a topic for future study. In the SBD sample, constant viscosity was observed immediately after measurements were started, presumably because most of the starch was gelatinized.
These results indicated that the drying method affects the pasting properties of taro flour and that it is therefore possible to produce taro flours with different viscosities by controlling the drying process.
Texture properties of paste made with taro flour One of the simplest ways to use taro flour is to make it into a paste, like achu, for use as a staple food or side dish. We used taro flour to prepare taro paste with a water content of 80 %. Samples from the FD, BD60 and BD80 treatments were heated in a microwave oven because the starch was not gelatinized. The texture of the resulting paste was measured in comparison with the Ctrl prepared from fresh taro (Fig. 3).

Texture parameters of taro pastes produced using the different taro flour samples.
Ctrl, paste made with fresh taro. The abbreviations used for taro flour samples are the same as in Fig. 1. Values are shown as the mean ± standard deviation (n = 3). Means with different letters are statistically significant (p < 0.05).
The hardness of the FD, BD60, and BD80 samples was significantly higher than that of the Ctrl, and the SBD sample was significantly lower than that of the Ctrl. The cohesiveness of all taro flours was significantly higher than that of the Ctrl. The adhesiveness was significantly higher in the FD and BD80 samples than in the Ctrl, which was roughly equivalent to that of the BD60 sample, and significantly lower compared to the SBD sample.
The results showed that the texture of taro paste changes depending on the drying process employed to produce the flour. In particular, Njintang et al. (2008b) reported that taro flour had a high capacity for absorbing water compared to the starch components. Thus, the FD, BD60 and BD80 samples showed no clear breakdown in the RVA measurements. However, it is speculated that swollen starch granules partly collapsed under the influence of heat and stirring, releasing amylose and amylopectin, and underwent gelation with large particles, resulting in higher hardness, adhesiveness, and cohesiveness compared to the Ctrl. On the other hand, the SBD sample was considered to contain a large amount of free water that did not hydrate the starch, which presumably increased the softness and decreased the adhesiveness of the paste. Moreover, it was speculated that the presence of a large amount of free water increased recovery from deformation caused by compression (Nishinari et al., 2013) and accounted for the higher calculated cohesiveness compared with the other taro flour samples and the Ctrl.
Thus, the drying process used to produce taro flour affected the texture of the paste. The pastes prepared with the FD and BD80 samples, which exhibit good cohesiveness and are harder and more adhesive, respectively, than the Ctrl, are considered to be suitable as binders for combining small food items. Since pastes prepared by SBD show good cohesiveness and are softer and less adhesive than the Ctrl, they are well suited for baby foods and foods for people with eating dysfunctions.
Characteristics of bread substituted with taro flour More people in the world eat bread than taro paste as a staple. Therefore, for the purpose of expanding the use of taro flour, we prepared bread in which 10 % of the wheat flour was substituted with taro flour and examined the effect of the drying process on bread rising and crumb texture (Fig. 4 and Fig. 5). The initial substitution rate of taro flour was up to 30 %, but the presence of off-flavors resulted in a substitution rate of 10 % being used.

Photographs, specific loaf volume (SLV) and moisture content of bread made with wheat flour substituted with different taro flour samples.
The abbreviations used for taro flour samples are the same as in Fig. 1. Ctrl, bread made using wheat flour only (i.e. not substituted with taro flour); FD, bread substituted with 10 % FD; BD60, bread substituted with 10 % BD60; BD60, bread substituted with 10 % BD80; SBD, bread substituted with 10% SBD. Data are shown as the mean ± standard deviation (n = 3). No significant differences in SLV and moisture content were observed between bread samples.

Texture paretares of bread made with wheat flour substituted with different taro flour samples.
The abbreviations used for taro flour samples and bread are the same as in Fig. 1 and Fig. 4, respectively. Data are shown as the mean ± standard deviation (n = 3). Means with different letters are statistically significant (p < 0.05).
All of the bread produced with flour substitution rose to a height almost equal to that of the Ctrl. Moreover, no significant difference in the gas cells of the bread crumb was noted compared with the Ctrl. The SLV of the breads with substituted flour was not significantly different from the Ctrl. The moisture content of the crumb in bread produced with substituted flour was also not significantly different from the Ctrl. Thus, it was established that substituting 10 % of the wheat flour with taro flour did not adversely affect breadmaking.
Crumb hardness was significantly lower in bread substituted with the SBD flour than in the Ctrl. One of the factors responsible for the reduced crumb hardness in the SBD-substituted bread was considered to be the increase in the amount of gelatinized starch. Partial substitution of wheat flour with cooked rice (Okunishi, 2009) or rice porridge (Shibata et al., 2011) has shown that the viscoelasticity of the gelatinized starch reinforces the gluten structure and maintains gas cells, making the crumb softer. The effect of gelatinized starch was also inferred to be the reason for the SBD-substituted bread being softer than the Ctrl.
Crumb cohesiveness was significantly higher in the SBD-substituted bread compared with the Ctrl, and significantly lower in the BD80-substituted bread. It was speculated that in the case of the SBD-substituted bread, gelatinized starch strengthened the gluten and increased the cohesiveness of the crumb. Unlike taro paste, bread has a low moisture content. In the BD80-substituted breads, it was speculated that one of the reasons underlying the lower cohesiveness was that the large particles cannot swell sufficiently
Thus, the drying process of taro flour was found to affect the texture of the breads made with substituted flour. In particular, SBD flour substitution was found to soften the crumb and increase its cohesiveness despite the decrease in gluten. Therefore, it was shown that by substituting flour with SBD flour, it is possible to prepare bread that is easier to chew and to form into a bolus compared to the Ctrl. On the other hand, substitution with taro flour containing large particles, such as those present in BD60 and BD80 flours, was shown to lower the texture of the crumb compared with the Ctrl.
Taro flour made by blast-drying fresh taro with hot air is characterized by the presence of aggregated starch granules during storage, owing to the partial denaturation of protein. Consequently, pastes produced using such flour have higher hardness and adhesiveness compared with fresh taro pastes. In freeze-dried flour, the hardness and adhesiveness of the paste were similarly increased by the formation of aggregated starch granules during the heating process. In the case of flour that is blast-dried after heating, starch granule aggregates are not generated during storage and heating, and the adhesiveness of the paste is reduced compared with fresh taro paste. Bread made with taro flour prepared by blast-drying after heating exhibited softening and increased cohesiveness, whereas bread made with flour substituted with blast-dried flour (BD80) had a harder crumb despite the reduced gluten content.
From these results, it is clear that the drying process of fresh taro changes the texture of the product by affecting the aggregation and swelling of the starch granules. However, since only the dodare group of taro was used for the samples in this study, we plan to study the effects of the drying process using varieties with different starch and protein contents.
Acknowledgement This research was carried out with the support of a Grant-in-Aid for Scientific Research (B) from the Japan Society for the Promotion of Science (Grant No.: 17KT0075).
Conflict of Interest The authors declare no conflict of interest.