Original papers
Separation and preparation of the main flavonoids in Flos Dolichoris Lablab and their antioxidant activity
2021 Volume 27 Issue 3 Pages 429-440
Details
2021 Volume 27 Issue 3 Pages 429-440
Flos Dolichoris Lablab, as a flower of a homologous plant with medicinal and food applications, has rich plant activity with research value. In this article, we studied flavonoids in Flos Dolichoris Lablab, and an effective semipreparative HPLC separation method was established. Then, seven flavonoids from Flos Dolichoris Lablab were prepared in one step, and their antioxidant activity was evaluated. The results show for the first time that the seven flavonoids kaempferol 3-O-sophoroside (1), quercetin 3-rutinoside (2), quercetin 3-glucoside (3), kaempferol-3-O-robinobioside (4), kaempferol-3-O-rutinoside (5), isorhamnetin 3-O-neohesperidoside (6), and kaempferol-3-O-galactoside (7) were isolated from the genus Lablab. Antioxidant activity results with individual compounds show that compounds 2, 3, and 7 exhibit better antioxidant activity. Experiments on different combinations of flavonoids of Flos Dolichoris Lablab indicate that the interaction of flavonoids can affect the mixture's total antioxidant activity. This research provides guidelines for preparing flavonoids present in Flos Dolichoris Lablab and structure-activity relationship studies.
As an herbaceous perennial grown in many countries (Kalloo and Pandey, 1993), Flos Dolichoris Lablab is the flower of Dolichos Lablab L. belonging to the family Leguminosae (Fabaceae). It is generally believed that the wild hyacinth bean (Dolichos Lablab L.) originated in Southeast Asia or India and was widely spread to many tropical and subtropical places during the eighth century (Al-Snafi, 2017; Kalloo and Pandey, 1993). As a medicinal and edible plant, phytochemical analysis showed that Dolichos Lablab L. is rich in flavonoids, proanthocyanidins, saponins, proteins, and dietary fiber (Al-Snafi, 2017). Preliminary pharmacological studies revealed that Dolichos Lablab L. possessed antioxidant, antidiabetic, anti-inflammatory, insecticidal, hepatoprotective, and antispasmodic effects and was also used to treat irondeficiency anemia. In addition, Flos Dolichoris Lablab applied externally to wounds exhibited a positive effect of reducing swelling and analgesia. These findings are closely associated with abundant phytochemical activity in Flos Dolichoris Lablab, especially the flavonoids (Qiaoyu and Lingsheng, 1996). Plant flavonoids possessing various essential physiological functions are pharmacologically active (Gutiérrez-del-Río et al., 2018; Sae-leaw and Benjakul, 2019; Yang et al., 2018) and are increasingly favored worldwide due to their unique efficacy in health care, disease prevention, and medical treatment. In the main related studies (Olaku et al., 2015; Vincent et al., 2013), reactive oxygen species (ROS) were shown to mediate cardiotoxicity and neurotoxicity induced by various cancer chemotherapeutic agents, and the excellent antioxidant properties of flavonoids (Nada, 2014; Sovak, 2001; Uchida, 1980) have great potential in combination with drugs for the treatment of diseases. However, for the previously studied functional effects on Dolichos lablab plants, crude extracts were used in the experiment, and the structure-activity relationship for flavonoids of lentil flower has not been reported (Al-Snafi, 2017; Krishnaveni and Challa, 2013; Bhogireddy et al., 2013; Ahmed et al., 2015; SINGH and SANKAR, 2012; MOMIN et al., 2012). Therefore, this article starts with the research on the flavonoids and their antioxidant activity of Flos Dolichoris Lablab, which promoted the utilization value of lentil flower raw materials.
A necessary prerequisite for bioactivity studies, valid prescription use, and value-added utilization of renewable resources is the structural identification of active ingredients that are efficiently separated and purified from plants. Thus, separation and purification of flavonoids from Flos Dolichoris Lablab is a critical step. In many studies in the past, due to the complex chemical composition of plants, the chemical composition of plants has traditionally been determined using silica gel columns for separation (Buca et al., 2013; Atanasov et al., 2013). The application of silica gel columns results in considerable solvent and time expenditures and cannot directly detect the outflow of compounds. Silica gel columns are not the right choice, especially for the separation of complex compounds or those with similar properties. However, semipreparative HPLC (SPHPLC) overcomes the above disadvantages due to its superior separation effect and reproducibility, which is beneficial for the application of compounds separation and preparation.
This study is aimed to establish an effective SPHPLC separation method to separate and purify flavonoids isomers form Flos Dolichoris Lablab. The flavonoids obtained were identified by UPLC-TOF-MS, 1H NMR and 13C NMR. The antioxidant capacity of the isolated flavonoids and their mixtures were also evaluated with the aim of elucidating the structure-activity relationship. The test flow chart is shown in Fig. 1.
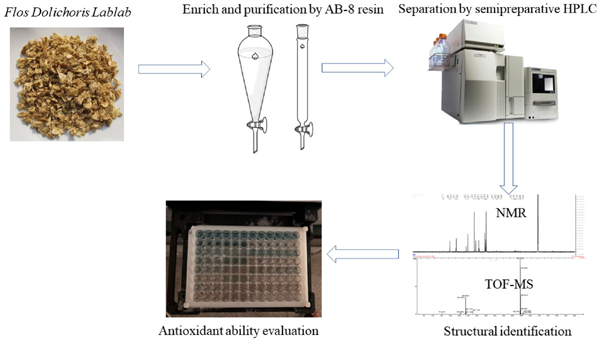
The flow chart of the experiment.
Main instruments and reagents 1H NMR and 13C NMR spectra of flavonoids were recorded using DMSO-d6 or methanol-d4 on a Bruker Ascend-500 spectrometer (Bruker BioSpin Gmbh, Rheinstetten, Germany) at 500 and 126 MHz, respectively. Chemical shifts were given by δ (ppm) relative to TMS as an internal reference and coupling constants (J) are reported in Hz. The preparation for HPLC and subsequent analysis were carried out using a Waters Breeze 2 system that was equipped with a 2414 refractive index detector, a 2707 autosampler, a 1525 binary HPLC pump, and a 2998 photodiode array detector. The chromatographic columns of HPLC analysis were Sunfire C18 columns (150 mm × 4.6 mm I.D., 5 µm), and the semipreparative HPLC column was a Sunfire C18 column (150 mm × 10 mm I.D., 5 µm). The organic solvents for the experiments were purchased from Sinopharm Chemical Reagent Co., Ltd. (Shanghai, China). Flos Dolichoris Lablab was provided by a pharmacy (Bozhou, Anhui, China). 2,2-diphenyl-1-picrylhydrazyl (DPPH) and 2,2′-azino-bis(3-ethylbenzthiazoline-6-sulfonic acid) (ABTS) were obtained from Sigma-Aldrich (Saint Louis, USA). 2-phenyl-4,4,5,5-tetramethylimidazoline-1-oxyl 3-oxide (PTIO) was provided by Aladdin (Shanghai, China).
Extraction and pretreatment of Flos Dolichoris Lablab Flos Dolichoris Lablab (10 kg) was extracted three times with 70% ethanol under reflux. The lower aqueous phase was collected to enrich flavonoids using n-butanol after the extraction liquid was washed with petroleum ether to remove impurities. Then, the n-butanol extraction component was divided into four fractions through AB-8 macroporous resin, and the elution gradient was 20% (Fr. I), 30% (Fr. II), 50% (Fr. III), 70% and (Fr. IV) ethanol-water eluent, and each eluent was added to the resin at 10 BV. Fr. II was freeze-dried for subsequent analysis.
Analytical HPLC conditions The following solvent phases were used: acetonitrile (A) and 0.5% aqueous acetic acid (B). The flow rate and injection volumes were 1.0 mL/min and 20 µL, respectively. The detector wavelength was 360 nm, and the column temperature was set to 30 °C. The gradient elution program was as follows: 0–5 min, 10–17% A; 5–10 min, 17–19% A; 10–25 min, 19–26% A; 25–26 min, 26–10% A; and 26–28 min, 10–10% A.
Optimization of HPLC conditions To improve the resolution of the target compound and facilitate subsequent component analysis. The preparation conditions of HPLC were optimized, including elution conditions, mobile phase composition and injection volume. Two organic phases, methanol and acetonitrile, were examined for mobile phase composition. Then, 0.1%, 0.3%, 0.5%, and 1% acetic acid and 0.1% phosphoric acid were used to adjust the pH of the mobile phase, improving peak tailing and shape. It can be noted from Fig. S1 that the compounds all eluted within 30 mins. Therefore, we optimized the elution procedure to reduce the elution time of the subsequent SPHPLC and solvent. The results are shown in Fig. S2. The sample preparation concentration was 0.5 g/mL, and the injection volume was selected to be 50 µL, 100 µL, and 150 µL to examine the loading capacity.
Further separation of flavonoids by SPHPLC Fr. II was prepared by SPHPLC (replacement of the analytical column on the HPLC with the semipreparative column). Fr. II dissolved in methanol was injected into the Sunfire C18 column (150 × 10 mm, 5 µm) through an autosampler. The conditions were optimized through amplification and optimization of the HPLC analysis, and then the peaks were collected manually.
Identification of flavonoids The chemical structure of purified flavonoids was confirmed by UV, 1H NMR, 13C NMR spectrometry and UPLC-TOF-MS. UV spectral data from all peaks were acquired by a PDA detector of the HPLC system.
Assay of reducing power The reducing power of seven flavonoids from Fr. II was determined using a previously described method with some modifications (Liu et al., 2017). After the complete reaction, 200 µL of the test solution was measured at 700 nm, Vitamin C (VC) was used as a positive control, and the absence of flavonoids was negative control.
Antioxidant activities Measurements were conducted by referring to relevant literature with slight modifications to the proposed ABTS+ methods (Thaipong et al., 2006). The seven target compounds were collected and obtained from SPHPLC. After vacuum freeze-drying, the compounds were dissolved in methanol separately, and then each sample solution was diluted using methanol. The diluted solutions were placed in the refrigerator at 4 °C for subsequent use. Ten milliliters of 7 mM ABTS reagent was reacted with 176 µL of 140 mM K2S2O8 solution in the dark for 16 h. Then, the ABTS+ solution was diluted immediately with pH 7.0 phosphate buffer (prepared by mixing potassium dihydrogen phosphate with dipotassium hydrogen phosphate solution) until its absorbance at 734 nm reached 0.7 ± 0.1. A total of 190 µL of ABTS+ solution was added to 10 µL of the diluted sample solution placed in a 96-well microporous plate (A1). Parallel experiments were performed on each group 3 times. The control group (A0) was prepared by adding 10 µL of methanol into the same amount of ABTS+ solution. At 25 °C, the mixed solution was incubated for 6 minutes in the dark and placed in a microplate reader to determine its absorbance at 734 nm. The equation of ABTS+ free radical scavenging capacity was calculated by (1 - A1/A0) × 100%.
The DPPH radical scavenging activity to determine antioxidant capacity was determined based on Le Grandois (Le Grandois et al., 2017), and some slight modifications were enacted according to this approach. Sample solutions were diluted into a series of gradients in the same way. For each gradient, 100 µL of 0.2 mM DPPH solution was added to 100 µL of the sample solution in a 96-well microporous plate, which was then placed in the dark for 30 mins (B1). For the sample solutions of various gradients in each group, an equal volume of methanol was added to 2 mL of one sample. This operation was repeated accordingly for each sample set. Next, B2 was mixed with the reaction solutions and placed in the dark. The control group (B0) was mixed with 100 µL of methanol with an equal volume of DPPH solution. The absorbance was measured at 517 nm by using a microplate reader after the reaction. The DPPH free radical scavenging capacity was calculated as [1 − (B1 − B2)/B0] × 100%.
PTIO• scavenging Assay The PTIO• scavenging activity was determined following the method mentioned by Li's (Li, 2017) work with slight modifications. In brief, a variety of methanol solutions containing sample (20 µL) were added to a 96-well microporous plate, followed by the addition of 80 µL of PTIO•-phosphate buffer solution (the PTIO• solution was diluted with pH 7.0 phosphate buffer) to each well. The calculation of the PTIO•-scavenging activity was the same as that of ABTS+ scavenging activity.
Flavonoid – flavonoid interactions and their effect on antioxidant activity The separated flavonoids were mixed in pairs at the same volume ratio to explore the antioxidant synergy/inhibition effects between them, and then ABTS+ was used to determine their antioxidant capacity. Briefly, the solution of two individual flavonoids was mixed in equal amounts of 5 µL, and then 190 µL of ABTS+ solution was added to 10 µL of the diluted sample solution (Hidalgo and Sánchez-Moreno et al., 2010). The results are expressed as the IC50 (µM), and all samples were run in triplicate.
Statistical analysis OriginLab 2020b software was used to analyze data performed by ANOVA.
Optimization of HPLC conditions The n-butanol component was eluted from resin to obtain Fr. II. Fr. II was not easily dissolved in moderately polar solvents, such as chloroform. Therefore, a C18 column was selected as the chromatographic column to separate these polar compounds. The composition of the mobile phase was evaluated with two organic phases, methanol and acetonitrile. It can be seen from Fig. S2 that the methanol-aqueous acetic acid system had a worse ability to separate the compounds compared with acetonitrile-aqueous acetic acid. Thus, acetonitrile-aqueous acetic acid was selected as the mobile phase system for optimal resolution in subsequent experiments. Phosphoric acid is not easy to remove, so 0.5% acetic acid was added to the mobile phase to reduce peak tailing and improve peak shape instead of phosphoric acid. The optimized conditions for the mobile phase elution procedure were acetonitrile (A) and 0.5% aqueous acetic acid (B) and the following gradient elution program: 0–5 min, 10–17% A; 5–10 min, 17–19% A; 10–25 min, 19–26% A; 25–26 min, 26–10% A; and 26–28 min, 10–10% A. The flow rate was increased to 4.7 mL/min, the injection volume was increased to 150 µL (Fig. 2), and the detector conditions were the same as the analytical HPLC conditions.
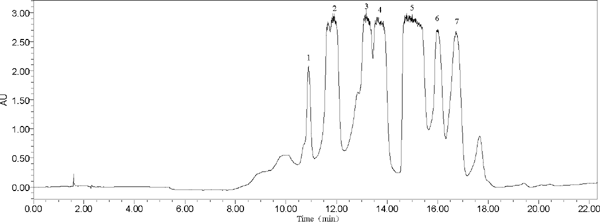
Chromatogram of Fr. II from Flos Dolichoris Lablab by SPHPLC (peaks: 1 = kaempferol 3-O-sophoroside, 2 = quercetin 3-rutinoside, 3 = quercetin 3-glucoside, 4 = kaempferol-3-O-robinobioside, 5 = kaempferol-3-O-rutinoside, 6 = isorhamnetin 3-O-neohesperidoside, 7 = kaempferol-3-O-galactoside).
HPLC analysis SPHPLC effluent Each peak from the SPHPLC preparation were collected, rotary evaporated to dryness at 50 °C, and dissolved in methanol after freeze-drying followed by HPLC analysis. The results show that seven compounds were separated successfully from Fr. II in one step using SPHPLC. The HPLC chromatogram and retention time (Rt) values are shown in Fig. 3A-G, and the Rt of kaempferol 3-O-sophoroside (A, Rt= 11.732), quercetin 3-rutinoside (B, Rt= 12.117), quercetin 3-glucoside (C, Rt= 13.345), kaempferol-3-O-robinobioside (D, Rt= 13.991), kaempferol-3-O-rutinoside (E, Rt= 15.361), isorhamnetin 3-Oneohesperidoside (F, Rt= 16.187), and kaempferol-3-Ogalactoside (G, Rt= 16.531) were determined. Finally, 100 mg of compound 1, 131 mg of compound 2, 90 mg of compound 3, 291 mg of compound 4, 882 mg of compound 5, 99 mg of compound 6, 126 mg of compound 7 were obtained from Fr. II.
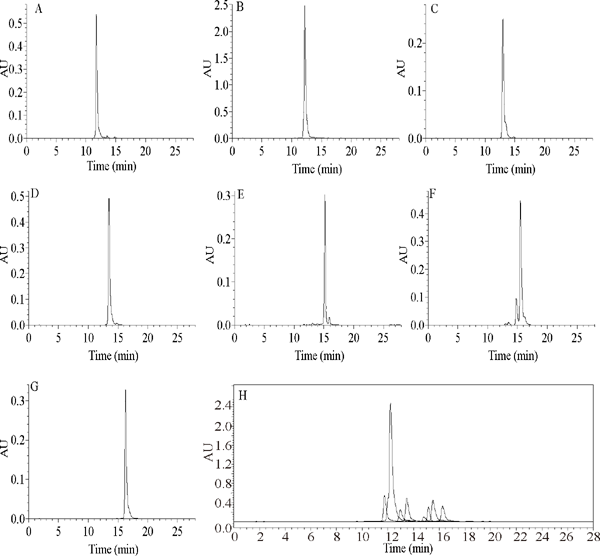
HPLC chromatograms of seven flavonoids separated by SPHPLC (A: kaempferol 3-O-sophoroside, B: quercetin 3-rutinoside, C: quercetin 3-glucoside, D: kaempferol-3-O-robinobioside, E: kaempferol-3-O-rutinoside, F: isorhamnetin 3-O-neohesperidoside, G: kaempferol-3-O-galactoside, H is the overlaid chromatograms of the seven compounds.)
Structural determination Each structural identification (Fig. 4) of SPHPLC peak fractions were performed according to 1H NMR, 13C NMR, UV and UPLC-TOF-MS and by comparison with reference compounds and literature data. Compounds 1–7 were identified as kaempferol 3-O-sophoroside (1, Chang et al., 2017), quercetin 3-rutinoside (2, Kazuma et al., 2003), quercetin 3-glucoside (3, Manguro et al., 2003), kaempferol-3-O-robinobioside (4, Nianyun, 2006), kaempferol-3-O-rutinoside (5, Slimestad, et al., 1995), isorhamnetin 3-O-neohesperidoside (6, Peng et al., 2005), and kaempferol-3-O-galactoside (7, Kishore et al., 2003). The 1H NMR and 13C NMR data of all seven compounds were shown in the supplementary information, and the NMR spectra were shown in Fig. S3. UV and MS data were listed in Table 1, and the spectra were shown in Fig. S4.
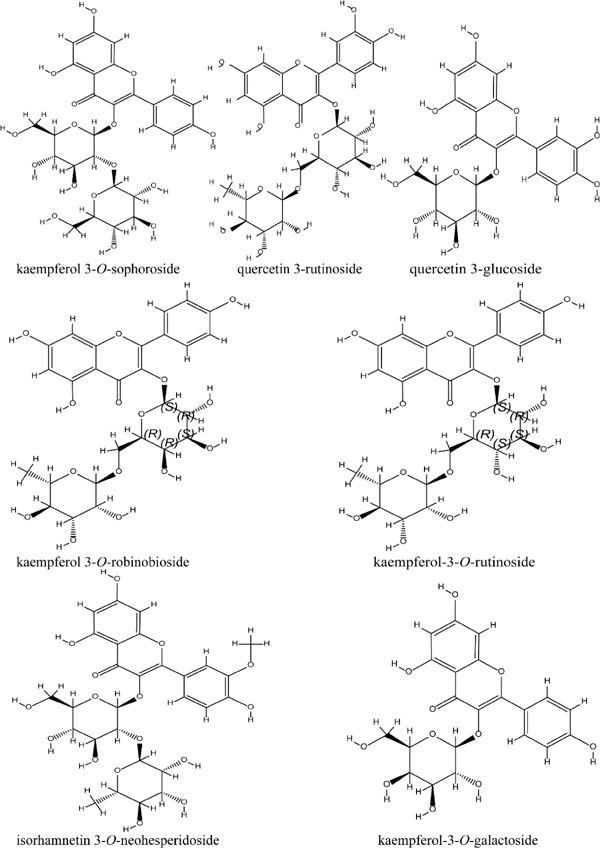
Chemical structure of flavonoids isolated from Flos Dolichoris Lablab.
| Peaks | Formula | UV(λ/nm, CH3OH) | [M-H]−(m/z) | Compounds |
|---|---|---|---|---|
| 1 | C27H30O16 | 266.2175, 346.2175 | 609.1492 | kaempferol 3-O-sophoroside |
| 2 | C27H30O16 | 257.2175, 354.2175 | 609.2333 | quercetin 3-rutinoside |
| 3 | C21H20O12 | 256.2175, 365.2175 | 463.1445 | quercetin 3-glucoside |
| 4 | C27H30O15 | 266.2175, 343.2175 | 593.2227 | kaempferol-3-O-robinobioside |
| 5 | C27H30O15 | 265.2175, 343.2175 | 593.2293 | kaempferol-3-O-rutinoside |
| 6 | C28H32O16 | 255.2175, 354.2175 | 623.2488 | isorhamnetin 3-O-neohesperidoside |
| 7 | C21H20O11 | 266.2175, 347.2175 | 447.1520 | kaempferol-3-O-galactoside |
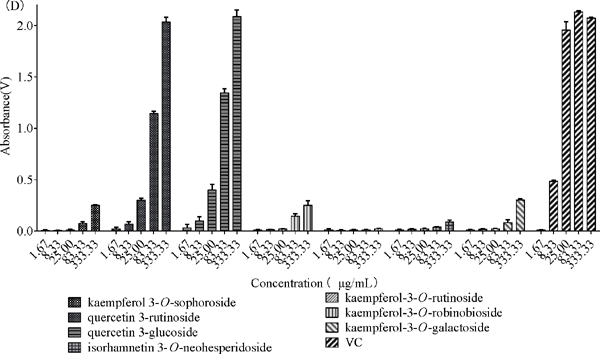
Antioxidative activity VC was taken as the positive control, the ability of all isolated compounds to scavenge free radicals (DPPH, ABTS+, and PTIO•) were measured, and their total reducing power were studied. The results are shown in Fig. 5. The scavenging activity (IC50) was calculated by a nonlinear regression equation, as listed in Table 2. The total reducing power was determined by the ability of the compounds to reduce Fe3+ to the ferrous form. The Fe3+ concentration can be monitored by measuring the formation of Perl's Prussian blue (Kumaran, 2006), and a higher absorbance at 700 nm implies better reducing power. As shown in Fig. 4C, all compounds showed a certain reducing power in determining the total reducing ability except compound 6, of which compounds 2 and 3 had the most potent reducing power followed by compounds 1, 3, 4, 5 and 7. The reducing power of the compounds became stronger as their concentrations increased. For the DPPH assay, as shown in Fig. 4B, compounds 2 and 3 demonstrated similar antioxidant capacities and could scavenge free radicals completely, even at low concentrations. As shown in Fig. 4D, from the experimental data of the PTIO• assay, a larger number of tested samples were required than for the ABTS+ and DPPH assays (Li, 2017).
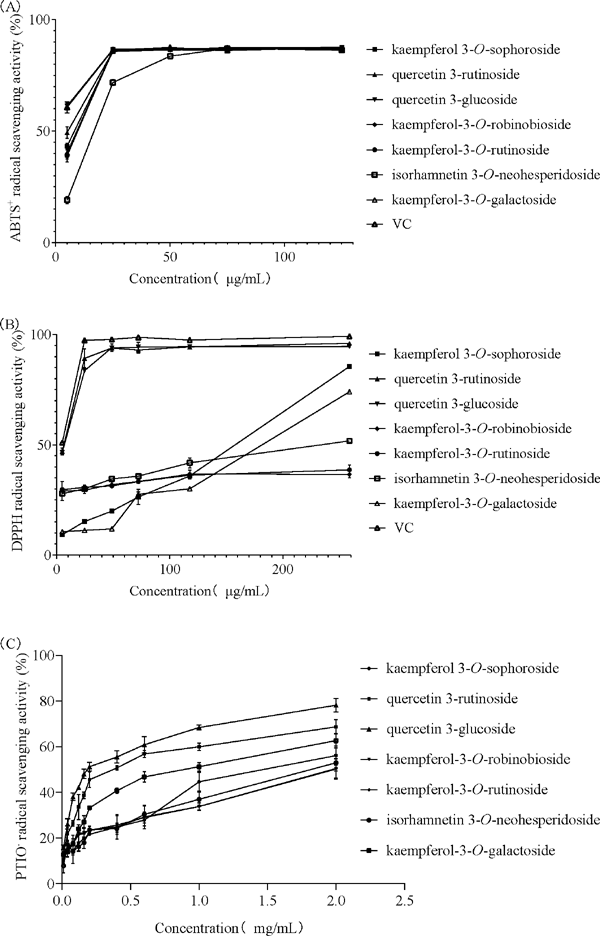
Determination of the antioxidant capacities of seven flavonoids from Flos Dolichoris Lablab (A: ABTS+ free radical scavenging activity of different concentrations of seven flavonoids and the reference antioxidant (5.00, 25, 50, 75, 125 µg/mL), B: DPPH free radical scavenging activity of different concentrations of seven flavonoids and the reference antioxidant (5.00, 24.69, 48.78, 72.29, 117.65, 258.70 µg/mL), C: PTIO• assay of different concentrations of seven flavonoids (0.01, 0.04, 0.08, 0.12, 0.16, 0.20, 0.40, 0.60, 1.00, 2.00 mg/mL)), D: Reducing power of different concentrations of seven flavonoids and the reference antioxidant (1.67, 8.33, 25.00, 83.33, 333.33 µg/mL).
Determination of the antioxidant capacities of seven flavonoids from Flos Dolichoris Lablab (A: ABTS+ free radical scavenging activity of different concentrations of seven flavonoids and the reference antioxidant (5.00, 25, 50, 75, 125 µg/mL), B: DPPH free radical scavenging activity of different concentrations of seven flavonoids and the reference antioxidant (5.00, 24.69, 48.78, 72.29, 117.65, 258.70 µg/mL), C: PTIO• assay of different concentrations of seven flavonoids (0.01, 0.04, 0.08, 0.12, 0.16, 0.20, 0.40, 0.60, 1.00, 2.00 mg/mL)), D: Reducing power of different concentrations of seven flavonoids and the reference antioxidant (1.67, 8.33, 25.00, 83.33, 333.33 µg/mL).
| Compound | Scavenging activity (IC50 ± SD1, 2, µM) | ||
|---|---|---|---|
| ABTS+ (µM) | DPPH (µM) | PTIO• (103 µM) | |
| 1 | 12.61 ± 0.90 c | 211.80 ± 33.61 b | 3.09 ± 0.17 c |
| 2 | 11.45 ± 0.78 d | 8.88 ± 1.11 c | 0.66 ± 0.10 e |
| 3 | 10.37 ± 1.01 e | 8.72 ± 1.53 c | 0.47 ± 0.06 e |
| 4 | 13.48 ± 0.87 b | – | 6.06 ± 0.52 a |
| 5 | 13.68 ± 0.93 b | – | 5.91 ± 0.45 a |
| 6 | 17.12 ± 0.50 a | 600.16 ± 48.80 a | 3.85 ± 0.36 b |
| 7 | 12.59 ± 0.37 c | 151.90 ± 28.35 b | 1.85 ± 0.27 d |
“-” not detected
In contrast, the scavenging ratio of compounds 1, 3, 6 and 7 showed excellent oxidation resistance at relatively high concentrations (>100 µg/mL), which was much smaller at low concentrations (<30 µg/mL). Compounds 4 and 5 has an individual ability to scavenge free radicals without a strong scavenging capacity for DPPH. However, the ABTS+ experiments showed different results from the DPPH assay in that all the compounds had strong antioxidant properties. It was reported that the antioxidant capacity of foods detected by the ABTS+ method was significantly higher than that of foods detected by the DPPH method (Floegel et al., 2011; Dan, 2015). The values of scavenging activity (IC50), as listed in Table 2, also confirmed this conclusion. Finally, the results for the DPPH and ABTS+ assay were different for the same compound, and two reasons are probably responsible for this observed difference in antioxidant activity. First, the ability of compounds to scavenge two different radicals (DPPH and ABTS+) may differ from each other. Second, the different velocities of the compounds' reaction to free radical scavenging may also contribute to this difference (Chen et al., 2014).
Comparing the IC50 values listed in Table 2, the antioxidant capacities of the compounds were similar as evidenced by the PTIO• assay when 4′-OH sites exist in the B ring, and the compound exhibits excellent antioxidant capacity when 3′, 4′-OH sites appear on the B ring. The results obtained from the PTIO• assay are consistent with those of previous work reporting free radical scavenging experiments, which indicated that PTIO• can be used in the antioxidant structureactivity relationship of these reactive compounds. In addition, compounds 4 and 5 did not present antioxidant activities with a significant (p < 0.05) difference in the PTIO• assay, indicating that the PTIO• scavenging reaction has no stereospecificity (Li, 2017). It was found that the parent ring structures of compounds 1, 4 and 7 was the same, and the 3″ position of the C ring was substituted by different glycosides. However, the IC50 values were significantly different when the PTIO• assay was used to detect antioxidant activity. We speculated that the number and configuration of glycosides in C-ring O-glycosides had a greater impact on the effect of the PTIO• assay than on other antioxidant experiments (Xican et al., 2018). The PTIO• assay is more suitable for evaluating the antioxidant capacity of water-soluble compounds than nonpolar compounds (Li, 2017). Moreover, this assay may better reflect the influence of glycosides on antioxidant experiments.
Structure-activity relationships of separated flavonoids Flavonoids possess a C6-C3-C6 structure as the basic configuration. The two benzene rings are usually termed the A and B rings, and the central 3 carbons make up the C ring. Differences in structure, especially the degree of hydroxylation, hydroxyl position, and glycoside substituents, will affect the antioxidant capacity of flavonoids (Gabrielska et al., 1997; Riceevans et al., 1996). Compounds 1–7 had glycoside substituents in place of the 3-position hydroxyl group of the C ring of the parent structure. This glycosylation would reduce their antioxidant activity, while compound 2 was not influenced. It is worth noting that structure-activity studies of antioxidants have not yet achieved a unified conclusion. For example, in the study of Mora (Mora et al., 1990), C3 had little effect on antioxidant activity. Similarly, it can also be found from compounds 2 and 3 that the number of hydroxyl group substitutions was the same at the substitution positions, and the difference was that compound 2 had more C-6″ substituted glycosides than compound 3 but does not differ significantly in terms of antioxidant capacity.
After comparing the antioxidant values of 7 compounds, compounds 2 and 3 with two hydroxyl groups in the B ring showed the highest antioxidant activity. The results indicate that the presence of 3′, 4′ dihydroxy groups on the B ring of flavonoids will enhance the antioxidant capacity of the compounds (Hidalgo et al., 2010), and the position of 3′-OH is the main site for enhancing antioxidant activity, which was in accordance with previous reports (Cao et al., 1997, Hidalgo et al., 2010), which revealed that the hydroxyl group on the B ring were closely related to high antioxidant activity. It can also be found from the DPPH, ABTS+ and PTIO• antioxidant results of compounds 2, 4 and 5 that their structures are similar, but compound 2 has a 3′-OH group on the B ring unlike compounds 4 and 5, leading to stronger antioxidant properties of compound 2. After the comparison between compound 2 and compound 6, it can be noted that the activity also decreased to a great extent when 3′-OH was substituted by a methyl group. Therefore, the results show that compounds 2, 3 and 7 showed good antioxidant properties in the set of gradient test antioxidants, while compounds 4 and 5 exhibited the worst antioxidant properties. In addition, it is worth noting that all the separated compounds had a certain antioxidant capacity and have one structural component in common, i.e., the 5, 7-OH on the A ring and 4′-OH on the B ring.
Therefore, structure-activity relationships indicated that the -OH groups at the 7 and 4′ positions were important sites for antioxidant activity (Zhang et al., 2014). Although the 5, 7-dihydroxyl sites of the A ring arrangement improve the antioxidant activity, the influence on the antioxidant capacity is far less than that of the B ring (Heim et al., 2002). In addition, hydrogen bonding between the 4-keto and 5-OH moieties stabilizes flavonoid radicals (van Acker et al., 1990; Wolfe and Liu, 2008).
Flavonoid–flavonoid interactions and their effects on antioxidant activity As shown in Table 3, the experimental results of different combinations of flavonoids are compared with theoretical values. In this way, any statistically significant effect produced by these combinations could be determined, regardless of whether they were synergistic or antagonistic (Hidalgo et al., 2010). Table 3 shows that the compound 2 mixture with other compounds showed antagonism except when mixed with compound 6, while compound 3 could significantly improve the antioxidant activity when used in combination with other compounds. The comparison of compounds 2 and 3 indicated that the combination of compounds in which the 3-hydroxyl group of the C ring is substituted by a longer glycoside might reduce the antioxidant capacity of the mixture determined by the ABTS+ method (Hidalgo et al., 2010). Additionally, synergistic effects occurred when mixing other compounds with compound 6 (except for the slight antagonism when combined with compound 7), which contains a 3′-OMe group in the B-ring. In this respect, we proposed that the insertion of methoxyl groups in the B-ring decreases antioxidant activity when an individual compound is studied (Rice-Evans et al., 1996). Considering the interaction between the compounds, the methoxy derivative can improve the antioxidant activity efficiency (Rivero-Pérez et al., 2008). In addition, kaempferol flavonoids (compounds 1, 4, 5, 7) exhibit low antioxidant capacity, while the antioxidant activity was significantly increased when they are paired with quercetin-3-glucoside. Thus, the combination of kaempferol flavonoids and quercetin-3-glucoside had a synergistic effect. It can be concluded that quercetin glycoside and kaempferol glycoside compounds have better antioxidant properties when combined than isolated. Based on these observations, we can also conclude that flavonoids can interact with each other, and their interactions can affect the total antioxidant capacity when present in a mixture.
| Sample | IC50 (µM) | Difference in ABTS+ antioxidant activity (%) a |
|---|---|---|
| 1 + 2 | 14.13 ± 0.82 | −17.46 ± 9.64 |
| 1 + 3 | 8.58 ± 0.94 | 25.33 ± 11.57 |
| 1 + 4 | 10.35 ± 0.78 | 20.66 ± 8.46 |
| 1 + 5 | 9.38 ± 0.53 | 28.64 ± 5.70 |
| 1 + 6 | 8.69 ± 1.18 | 41.54 ± 11.23 |
| 1 + 7 | 12.09 ± 0.43 | −0.92 ± 5.08 |
| 2 + 3 | 12.26 ± 0.73 | −12.37 ± 9.46 |
| 2 + 4 | 14.46 ± 1.02 | −16.00 ± 11.57 |
| 2 + 5 | 12.9 ± 0.55 | −2.67 ± 6.19 |
| 2 + 6 | 9.77 ± 0.72 | 31.61 ± 7.13 |
| 2 + 7 | 14.32 ±1.08 | −25.61 ± 13.40 |
| 3 + 4 | 9.95 ± 0.81 | 16.56 ± 9.61 |
| 3 + 5 | 8.89 ± 0.77 | 26.07 ± 9.06 |
| 3 + 6 | 9.93 ± 1.66 | 27.76 ± 17.07 |
| 3 + 7 | 10.57 ± 0.83 | 2.67 ± 10.81 |
| 4 + 5 | 10.14 ± 2.52 | 25.33 ± 26.24 |
| 4 + 6 | 9.25 ± 1.32 | 39.54 ± 12.20 |
| 4 + 7 | 13.25 ± 0.93 | −6.73 ± 10.59 |
| 5 + 6 | 12.23 ± 1.17 | 20.58 ± 10.74 |
| 5 + 7 | 14.04 ± 0.49 | −12.19 ± 5.54 |
| 6 + 7 | 14.57 ± 0.35 | −2.35 ± 3.48 |
In this work, a new preparative procedure for preparative isolation and purification of flavonoids from the Dolichos Lablab L. was established using AB-8 resin followed by SPHPLC. Moreover, all flavonoids were isolated for the first time from the genus Lablab. The separation method of SPHPLC was exhibited excellent performance, and the optimization technique proposed with remarkable improvement because various schemes can be used to expand production further to achieve optimal separation of the prepared compounds. Antioxidant activity results with individual compounds showed that compounds 2, 3, and 7 exhibited better antioxidant activity among the seven flavonoids, which would in turn ensure lentil flower has a certain potential to become one of the raw materials of natural additives in food processing, and it is also expected to develop and use its opportunities as health foods to enhance the utilization value of lentil flower raw materials.
The structural characteristics of the compounds had a significant impact on their antioxidant activities, such as the 5-OH moiety in the A ring, the 3′-OH moiety in the B ring and the 4-keto group in the C ring. In addition, the antioxidant reaction mechanism was affected by changes in the presence of glycosides and the substitution of hydroxyl and methoxy groups. These structural elements are critical to the effect of flavonoid antioxidants. Therefore, the antioxidant value of the flavonoid mixture will affect its clearance activity previously determined, and the result is relatively complicated and influenced by the interaction between different flavonoids. These antioxidant structure-activity relationships and the interaction mechanism of different flavonoids in combination require further exploration.
Acknowledgements The authors are grateful to the Key Research and Development Program of Anhui Province (No. 202004a06020022) and the Major Project of the Education Department of Anhui Province (No. KJ2018ZD013) for their financial support.
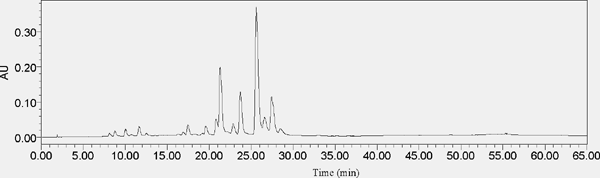
Chromatogram of HPLC analysis Fr. II
(The analysis HPLC conditions are: 0–20min, 10%–19%A; 20–45min, 19%–25%A; 45–50min, 25%–35%A; 50–55min, 35%–85%A; 55–60min, 85%–10%A; 60–65min, 10%–10%A. The column temperature is 30°C, the compositions of mobile phase are A acetonitrile and B 0.1% acetic acid in water, the flow rate is 1 mL/min, the detection wavelength is 360nm, and the PDA detector wavelength is selected from 210nm-400nm ultraviolet full wavelength. The chromatographic column was SunFire C18(4.6×150 mm, 5µm), and the HPLC (Waters) dead volume was 1.7 mL.)
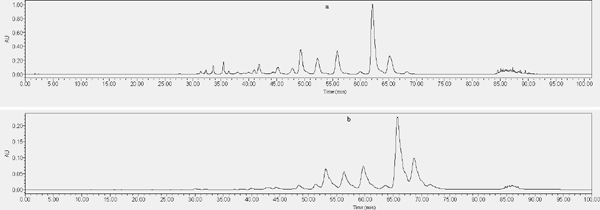
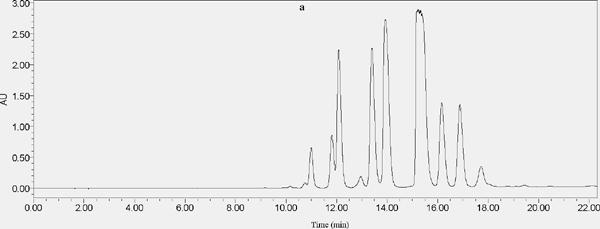
The effect of different organic phases in mobile phase on compound elution (a: Acetonitrile/0.1% acetic acid - water elution procedure, b: Methanol/0.1% acetic acid - water elution procedure)
The effect of different loadings on separated compounds (a: SHPLC chromatogram of 50 µL injection volume, b: SHPLC chromatogram of 100 µL injection volume)
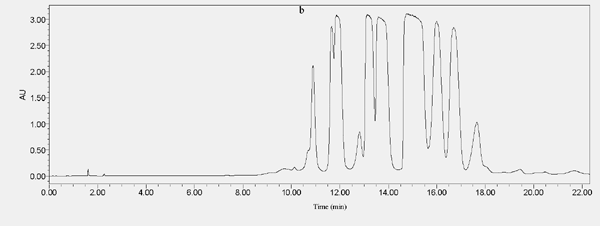
The effect of different loadings on separated compounds (a: SHPLC chromatogram of 50 µL injection volume, b: SHPLC chromatogram of 100 µL injection volume)
Structural determination:
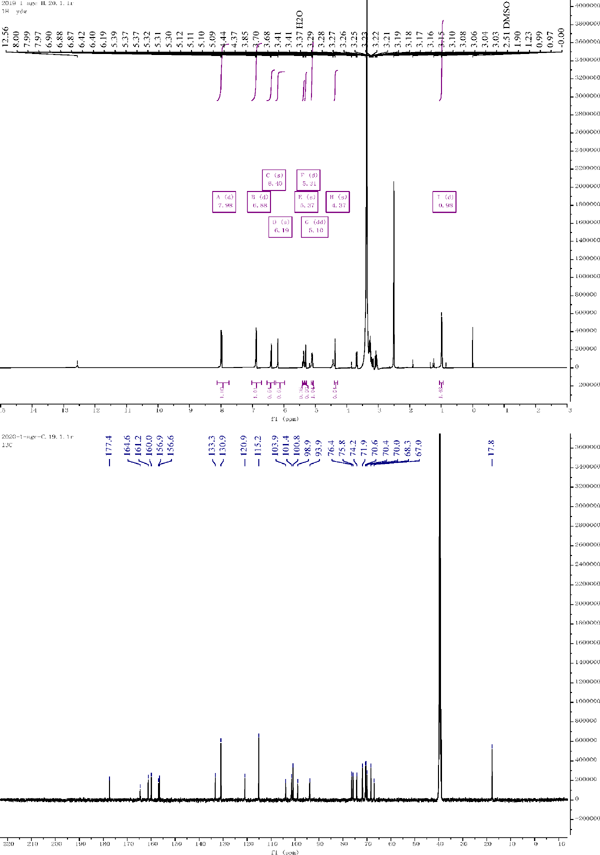
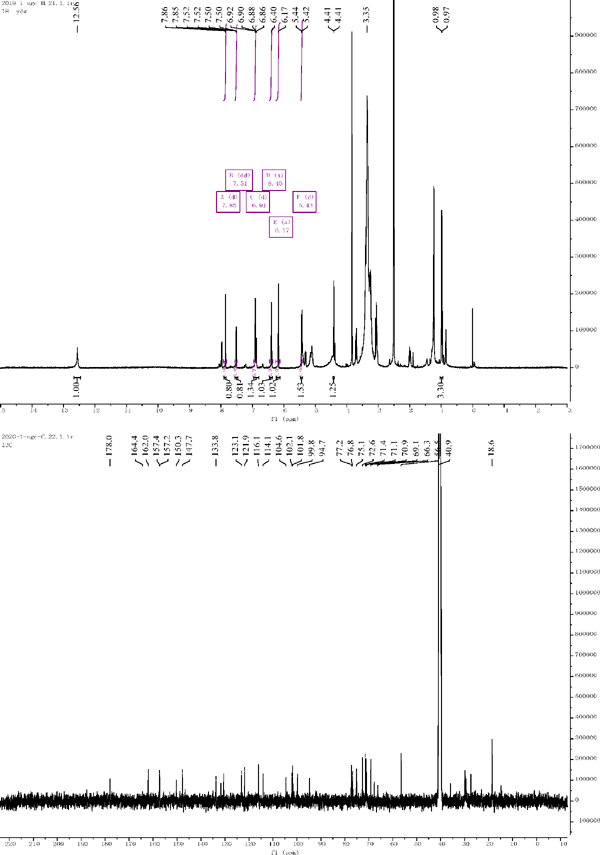
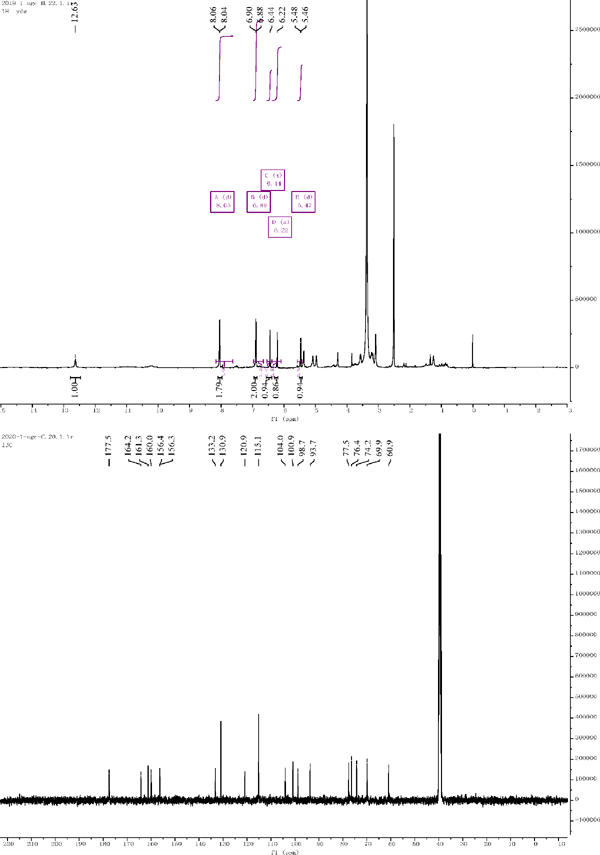
1H NMR and 13C NMR spectra were shown in Fig. S3, and the data were listed as follows:
Compound 1: 1H NMR (500 MHz, DMSO-d6) δ = 6.20 (s, 1H), 6.43 (s, 1H), 8.05 (d, J = 8.6 Hz, 2H), 6.91 (d, J = 8.8 Hz, 2H), 6.91 (d, J = 8.8 Hz, 2H), 8.05 (dd, J = 8.6 Hz, 2H), 5.71 (d, J = 7.0 Hz, 1H), 4.61 (d, J = 7.8 Hz, 1H). 13C NMR (126 MHz, DMSO) δ = 156.3 (C-2), 132.9 (C-3), 177.5 (C-4), 161.3 (C-5), 98.7 (C-6), 164.3 (C-7), 93.7 (C-8), 155.6 (C-9), 104.2 (C-10), 120.9 (C-1′), 131.0 (C-2′), 115.3 (C-3′), 160.0 (C-4′), 115.3 (C-5′), 131.0 (C-6′), 97.9 (C-1″), 82.5 (C-2″), 76.7 (C-3″), 69.7 (C-4″), 77.0 (C-5″), 60.8 (C-6″), 103.9 (C-1‴), 74.4 (C-2‴), 76.6 (C-3‴), 69.6 (C-4‴), 77.5 (C-5‴), 60.5 (C-6‴). Compared with the literature, the structure was identified as kaempferol 3-Osophoroside (Chang et al., 2017).
Compound 2: 1H NMR (500 MHz, Methanol-d4) δ = 6.21 (d, J = 2.1 Hz, 1H), 6.40 (d, J = 2.1 Hz, 1H), 7.67 (d, J = 2.1 Hz, 1H), 6.91 (d, J = 8.8 Hz, 2H), 6.87 (d, J = 8.4 Hz, 1H), 7.63 (dd, J = 8.5, 2.2 Hz, 1H), 5.11 (d, J = 7.7 Hz, 1H), 4.52 (d, J = 1.6 Hz, 1H), 1.12 (d, J = 6.2 Hz, 3H). 13C NMR (126 MHz, Methanol-d4) δ = 158.5 (C-2), 135 (C-3), 179.4 (C-4), 162.9 (C-5), 99.9 (C-6), 166.0 (C-7), 94.8 (C-8), 159.3 (C-9), 105.6 (C-10), 123.1 (C-1′), 117.7 (C-2′), 145.8 (C-3′), 149.8 (C-4′), 116.0 (C-5′), 123.5 (C-6′), 104.7 (C-1″), 75.7 (C-2″), 78.2 (C-3″), 71.4 (C-4″), 77.2 (C-5″), 68.5 (C-6″), 102.4 (C-1‴), 72.1 (C-2‴), 72.2 (C-3‴), 73.9 (C-4‴), 69.7 (C-5‴), 17.9 (C-6‴). Compared with the literature, the structure was identified as quercetin 3-rutinoside (Kazuma and Noda et al., 2003).
Compound 3: 1H NMR (500 MHz, DMSO-d6) δ = 6.06 (s, 1H), 6.25 (s, 1H), δ 6.79 (d, J = 8.8 Hz, 1H), 5.42 (d, J = 7.4 Hz, 1H). 13C NMR (126 MHz, DMSO) δ = 159.3 (C-2), 132.4 (C-3), 177.5 (C-4), 167.8 (C-5), 98.3 (C-6), 168.1 (C-7), 93.8 (C-8), 158.6 (C-9), 104.0 (C-10), 125.8 (C-1′), 117.1 (C-2′), 141.7 (C-3′), 144.2 (C-4′), 115.8 (C-5′), 125.3 (C-6′), 100.1 (C-1″), 72.0 (C-2″), 73.0 (C-3″), 68.4 (C-4″), 73.6 (C-5″), 65.4 (C-6″). Compared with the literature, the structure was identified as quercetin 3-glucoside (Manguro and Ugi et al., 2003).
Compound 4: 1H NMR (500 MHz, DMSO-d6) δ .20 (d, J = 2.0 Hz, 1H), 6.42 (d, J = 2.1 Hz, 1H), 8.05 (d, J = 8.7 Hz, 2H), 6.86 (d, J = 8.8 Hz, 2H), 6.86 (d, J = 8.8 Hz, 2H), 8.05 (d, J = 8.7 Hz, 2H), 5.32 (d, J = 7.7 Hz, 1H), 4.58 (d, J = 4.3 Hz, 1H), 1.06 (d, J = 6.2 Hz, 2H). 13C NMR (126 MHz, DMSO) δ = 156.5 (C-2), 133.3 (C-3), 177.4 (C-4), 161.2 (C-5), 98.8 (C-6), 164.5 (C-7), 93.8 (C-8), 156.6 (C-9), 103.8 (C-10), 120.9 (C-1′), 131.0 (C-2′), 115.1 (C-3′), 160.0 (C-4′), 115.1 (C-5′), 131.0 (C-6′), 102.1 (C-1″), 71.1 (C-2″), 73.5 (C-3″), 68.3 (C-4″), 73.0 (C-5″), 65.3 (C-6″), 100.1 (C-1‴), 70.4 (C-2‴), 70.6 (C-3‴), 71.9 (C-4‴), 68.0 (C-5‴), 17.9 (C-6‴). Compared with the literature, the structure was identified as kaempferol-3-O-robinobioside (Nianyun, 2006).
Compound 5: 1H NMR (500 MHz, DMSO-d6) δ = 7.98 (d, J = 8.7 Hz, 1H), 6.88 (d, J = 8.8 Hz, 1H), 6.40 (s, 1H), 6.19 (s, 1H), 5.37 (s, 0H), 5.31 (d, J = 7.5 Hz, 0H), 5.10 (dd, J = 11.6, 5.4 Hz, 1H), 4.37 (s, 1H), 0.98 (d, J = 6.2 Hz, 1H). 13C NMR (126 MHz, DMSO) δ = 156.59 (C-2), 133.3 (C-3), 177.38 (C-4), 161.24 (C-5), 98.90 (C-6), 164.61 (C-7), 93.87 (C-8), 156.86 (C-9), 103.90 (C-10), 120.95 (C-1′), 130.94 (C-2′), 115.16 (C-3′), 159.97 (C-4′), 115.1 (C-5′), 133.25 (C-6′), 101.43 (C-1″), 74.23 (C-2″), 76.41 (C-3″), 69.97 (C-4″), 75.78 (C-5″), 66.95 (C-6″), 100.83 (C-1‴), 70.4 (C-2‴), 70.65 (C-3‴), 71.87 (C-4‴), 68.31 (C-5‴), 17.9 (C-6‴). Compared with the literature, the structure was identified as kaempferol-3-O-rutinoside (Slimestad and Andersen, et al., 1995).
Compound 6: 1H NMR (500 MHz, DMSO-d6) δ = 6.17 (s, 1H), 6.40 (s, 1H), 7.85 (d, J = 2.1 Hz, 1H), 6.91 (d, J = 8.4 Hz, 1H), 7.51 (dd, J = 8.4, 2.1 Hz, 1H), 5.43 (d, J = 7.2 Hz, 1H), 4.41 (d, J = 7.2 Hz, 1H). 13C NMR (126 MHz, DMSO) δ = 157.4 (C-2), 133.8 (C-3), 177.3 (C-4), 162.0 (C-5), 99.8 (C-6), 164.4 (C-7), 94.7 (C-8), 157.2 (C-9), 104.6 (C-10), 121.9 (C-1′), 116.1 (C-2′), 150.3 (C-3′), 147.7 (C-4′), 56.3 (OCH3), 114.1 (C-5′), 123.1 (C-6′), 102.1 (C-1″), 75.1 (C-2″), 77.2 (C-3″), 71.4 (C-4″), 76.8 (C-5″), 66.5 (C-6″), 101.8(C-1‴), 70.9 (C-2‴), 71.1 (C-3‴), 72.6 (C-4‴), 69.1 (C-5‴), 18.6 (C-6‴). Compared with the literature, the structure was identified as isorhamnetin 3-O-neohesperidoside (Peng and Li et al., 2005).
Compound 7: 1H NMR (500 MHz, DMSO-d6) δ = 8.05 (d, J = 8.7 Hz, 1H), 6.89 (d, J = 8.7 Hz, 1H), 6.89 (d, J = 8.7 Hz, 1H), 8.05 (d, J = 8.7 Hz, 1H), 5.47 (d, J = 7.5 Hz, 1H). 13C NMR (126 MHz, DMSO) δ = 156.3 (C-2), 133.2 (C-3), 177.5 (C-4), 161.3 (C-5), 98.7 (C-6), 98.7 (C-7), 93.7 (C-8), 156.4 (C-9), 104.0 (C-10), 120.9 (C-1′), 130.9 (C-2′), 115.1 (C-3′), 160.0 (C-4′), 115.1 (C-5′), 130.9 (C-6′), 100.9 (C-1″), 74.2 (C-2″), 77.5 (C-3″), 69.9 (C-4″), 76.4 (C-5″), 60.9 (C-6″). Compared with the literature, the structure was identified as kaempferol-3-O-galactoside (Kishore and Reddy et al., 2003).
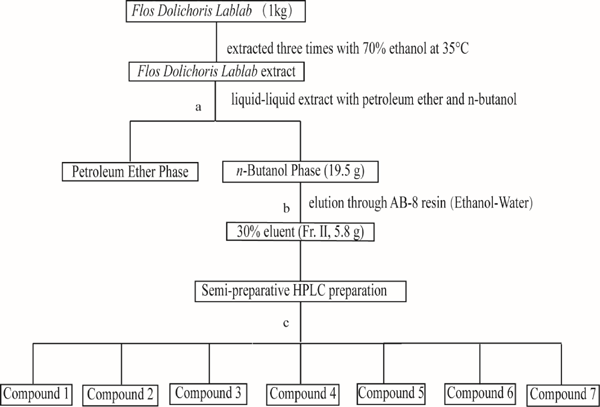
The procedure of extraction and isolation flavonoids compounds from Flos Dolichoris Lablab extracts (a: The extracted sample was first extracted with petroleum ether. Then, it was extracted with saturated n-butanol water to enrich the flavonoids; b: Purification of the n-butanol extraction components by AB-8 macroporous resin, and each eluent was added to the resin at 10 BV; c: Fr. II was prepared by SPHPLC, and the methods was shown in the section of Further separation of flavonoids by SPHPLC.)
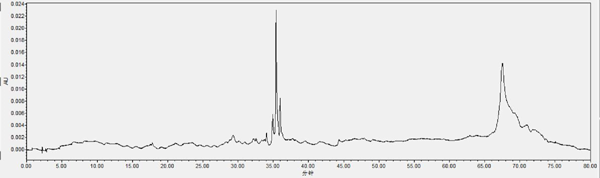
Chromatogram of HPLC analysis Fr. II eluted by silica column (chloroform-methanol, 9:1, V: V): The analysis HPLC conditions are: 0–15min, 10%–17%A; 15–20min, 17%–19%A; 20–40min, 19%–32%A; 40–47min, 32%–50%A; 47–67min, 50%–90%A; 67–70min, 90%–90%A, 70–75min, 90%–10%A, 75–80min, 10%–10%A. The column temperature is 30°C, the compositions of mobile phase are A acetonitrile and B 0.1% phosphoric acid in water, the flow rate is 1 mL/min, the detection wavelength is 360nm. The chromatographic column was SunFire C18(4.6×150 mm, 5µm), and the HPLC (Waters) dead volume was 1.7 mL.
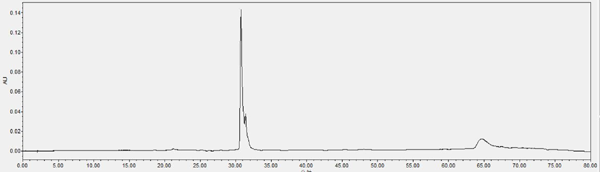
Chromatogram of HPLC analysis Fr. II eluted by silica column (chloroform-methanol, 85:15, V: V)
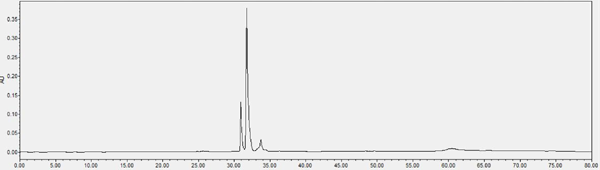
Chromatogram of HPLC analysis Fr. II eluted by silica column (chloroform-methanol, 8:2, V: V)
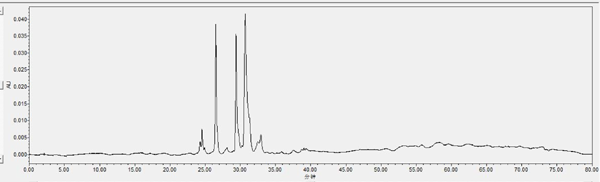
Chromatogram of HPLC analysis Fr. II eluted by silica column (chloroform-methanol, 7:3, V: V)
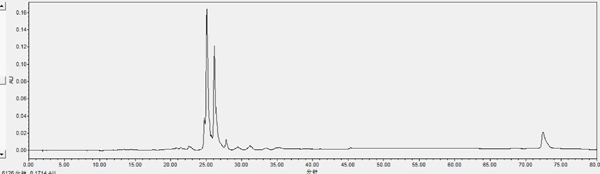
Chromatogram of HPLC analysis Fr. II eluted by silica column (chloroform-methanol, 6:4, V: V)
(The analysis HPLC conditions are: 0–20min, 10%–19%A; 20–45min, 19%–25%A; 45–50min, 25%–35%A; 50–55min, 35%–85%A; 55–60min, 85%–10%A; 60–65min, 10%–10%A. The column temperature is 30°C, the compositions of mobile phase are A acetonitrile and B 0.1% acetic acid in water, the flow rate is 1 mL/min, the detection wavelength is 360nm, and the PDA detector wavelength is selected from 210nm-400nm ultraviolet full wavelength. The chromatographic column was SunFire C18(4.6×150 mm, 5µm), and the HPLC (Waters) dead volume was 1.7 mL.)
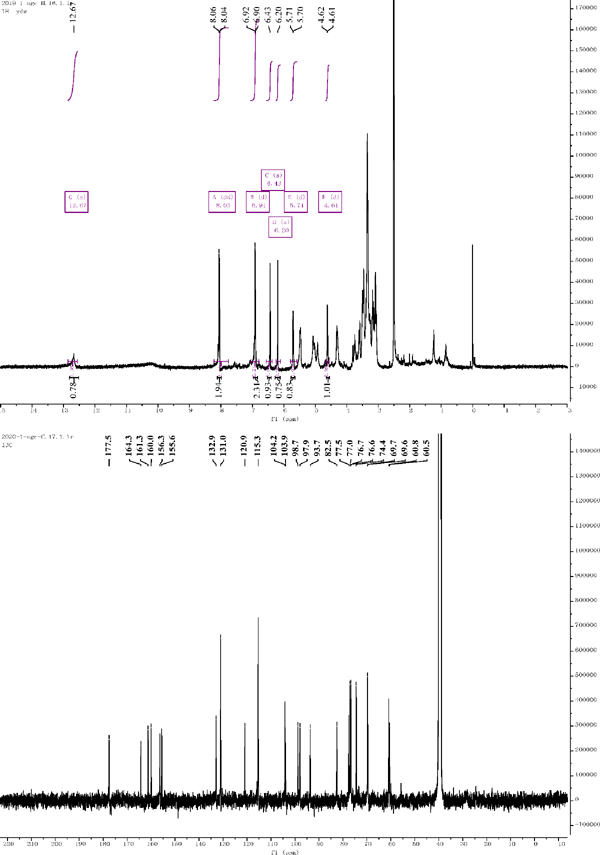
1H NMR and 13C NMR of compound 1
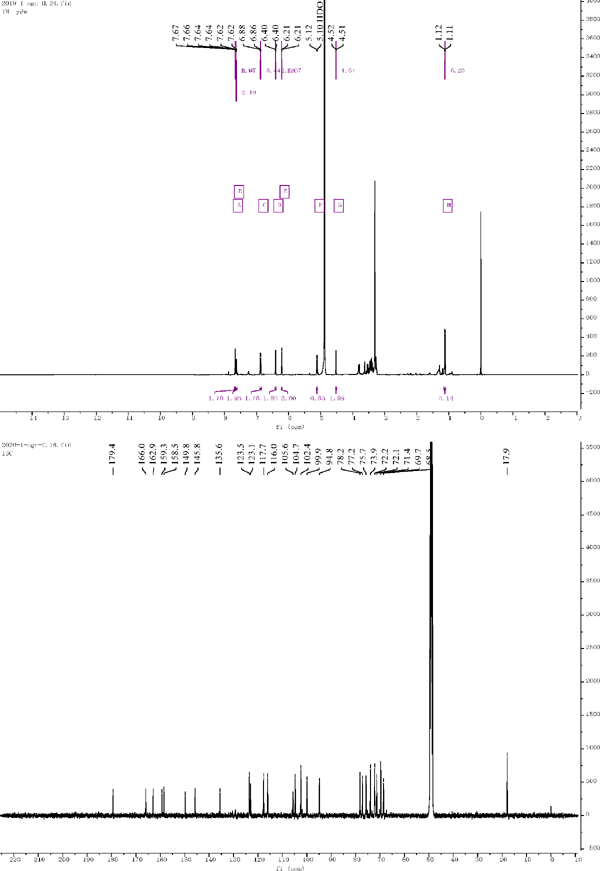
1H NMR and 13C NMR of compound 2
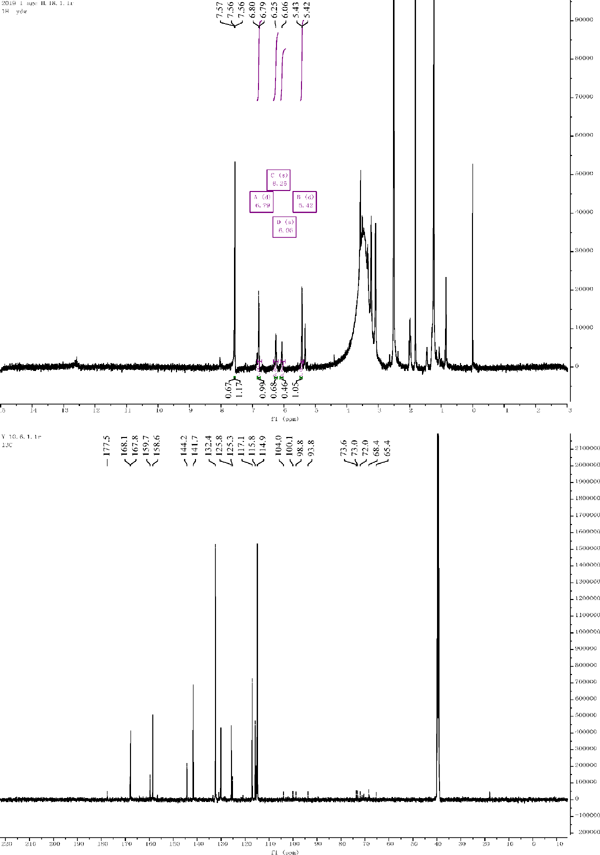
1H NMR and 13C NMR of compound 3
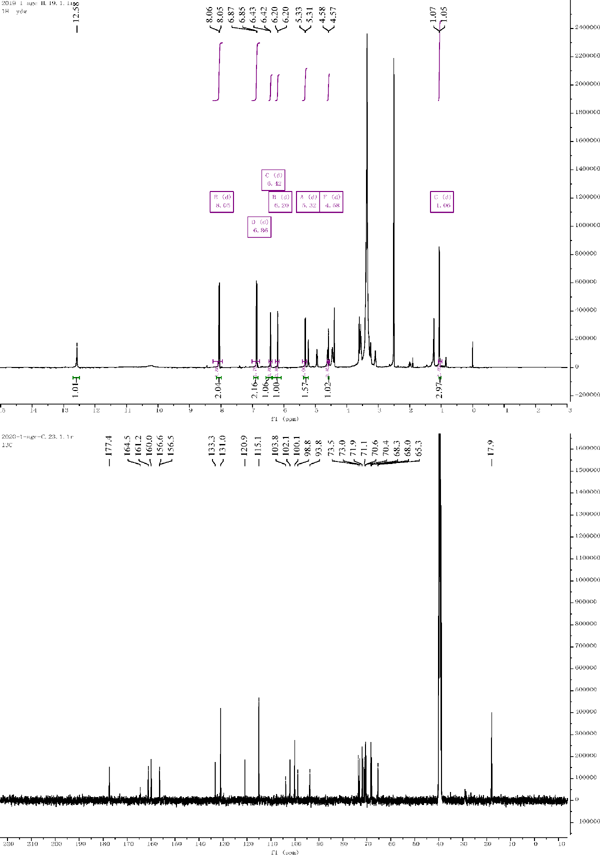
1H NMR and 13C NMR of compound 4
1H NMR and 13C NMR of compound 5
1H NMR and 13C NMR of compound 6
1H NMR and 13C NMR of compound 7
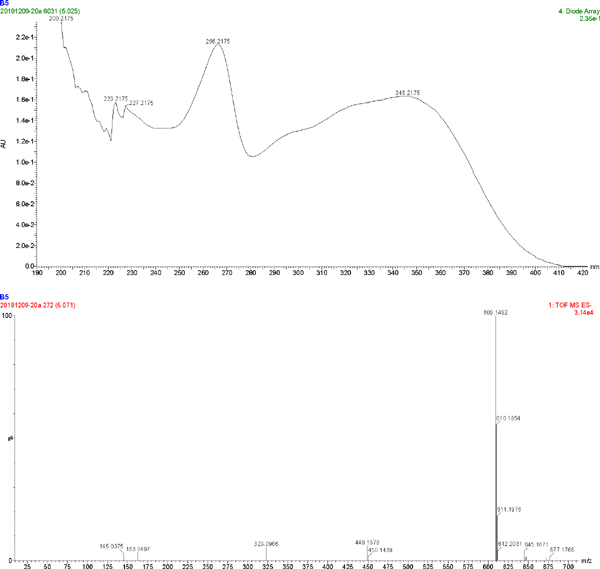
The UV spectrum and MS of compound 1
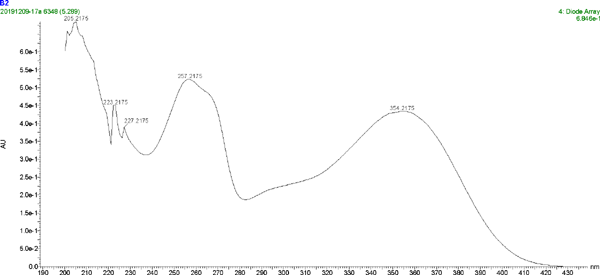
The UV spectrum and MS of compound 2
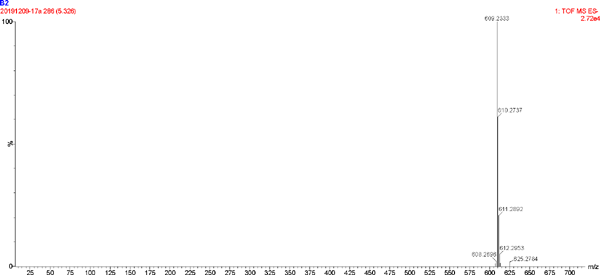
The UV spectrum and MS of compound 2
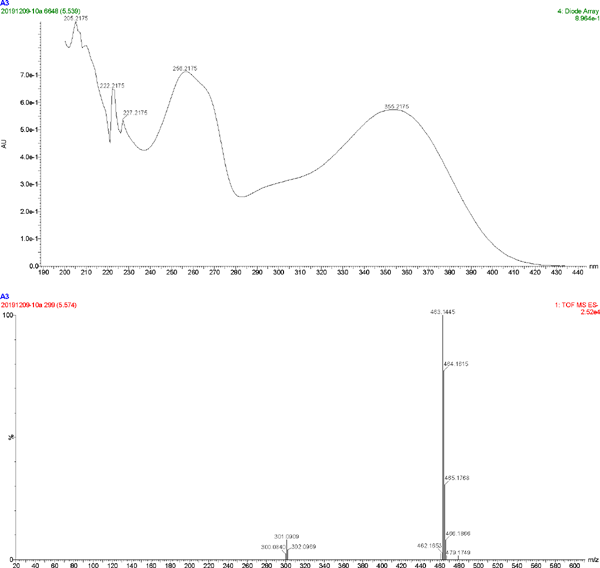
The UV spectrum and MS of compound 3
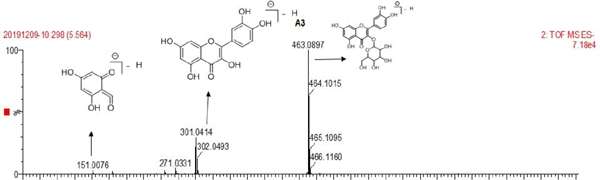
The UV spectrum and MS of compound 3
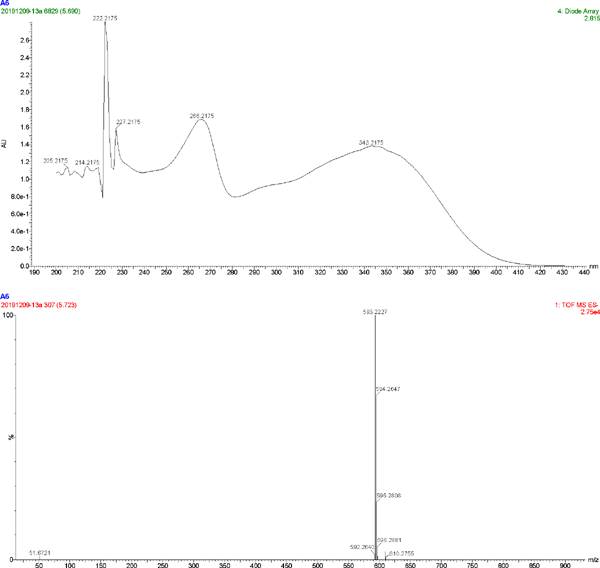
The UV spectrum and MS of compound 4
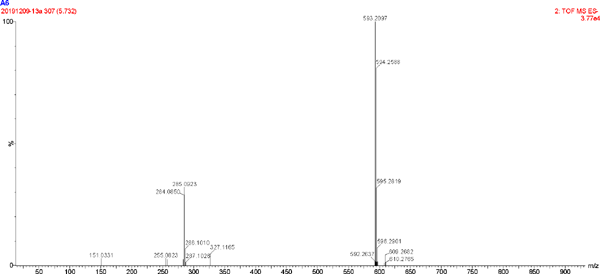
The UV spectrum and MS of compound 4
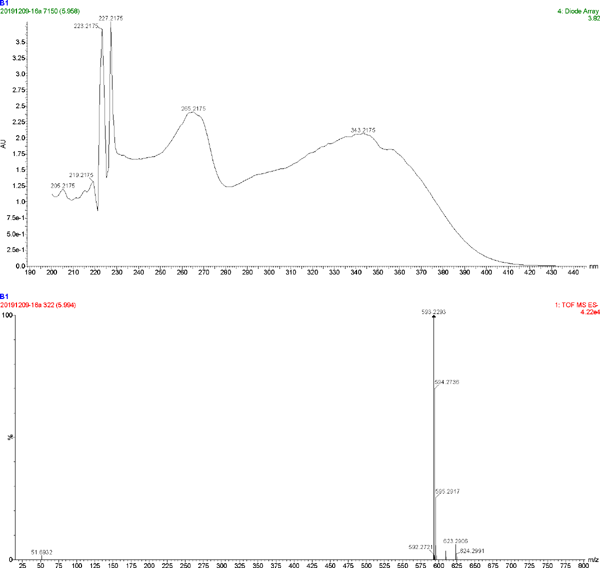
The UV spectrum and MS of compound 5
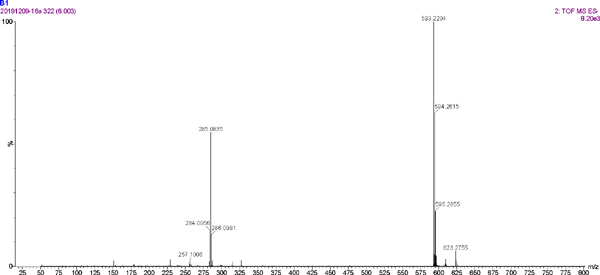
The UV spectrum and MS of compound 5
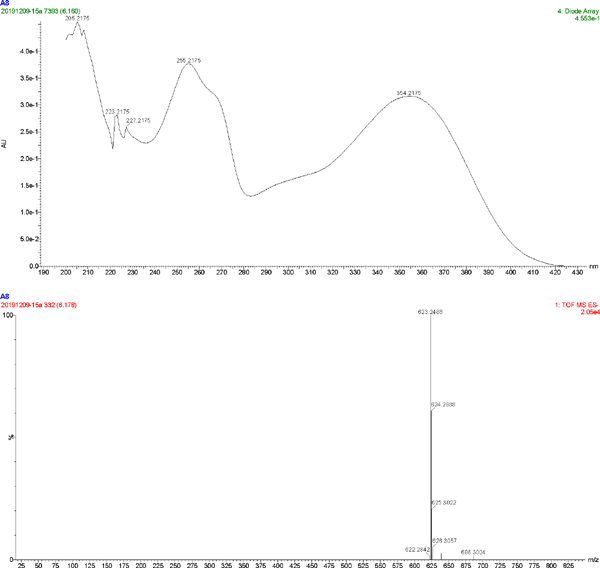
The UV spectrum and MS of compound 6
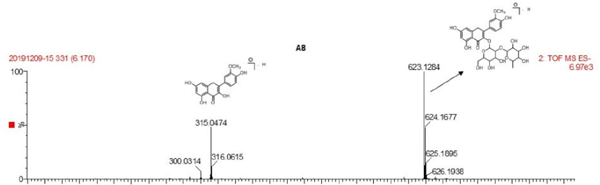
The UV spectrum and MS of compound 6
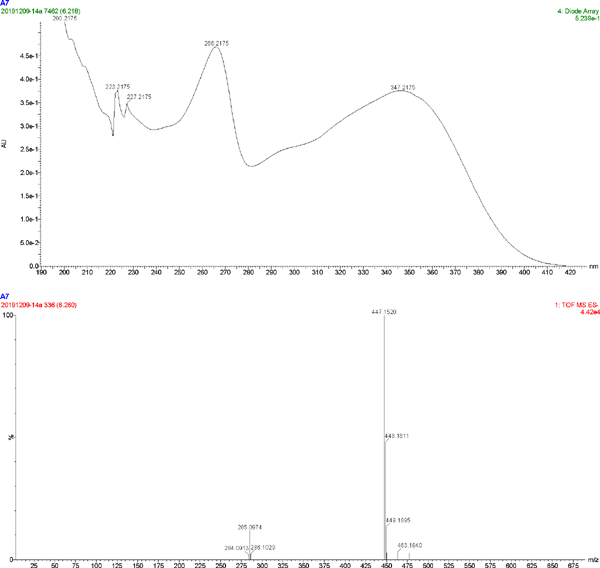
The UV spectrum and MS of compound 7