Abstract
Glucosinolates in cruciferous plants have been reported to exhibit various health benefits. Consequently, several studies have focused on the quantification of glucosinolates. A simple method was developed in this study to quantify glucosinolates in nozawana (Brassica rapa L.), and the validity of the developed method was evaluated. Glucosinolates were extracted from a dry powder of nozawana, solid-phase extraction was performed, and liquid chromatography–mass spectrometry measurements were conducted. A single-laboratory validation study on the developed method suggested that the relative repeatability standard deviation, relative intermediate standard deviation, and recovery rate of the spike and recovery tests complied with the accuracy standards of the Association of Official Analytical Chemists (AOAC) guidelines. Additionally, a multi-laboratory (three laboratories) validation study revealed that although the Horwitz ratio (HorRat) for trace glucosinolates was over 2, that for the primary glucosinolates in nozawana was less than 2, indicating an appreciable degree of reproducibility.
Introduction
Glucosinolates are sulfur-containing compounds that are found in Brassica vegetables; nearly 120 varieties of these compounds have been identified so far (Fahey et al., 2001). Some of these compounds have been reported to possess bioactive properties, such as suppression of carcinogenesis (Fahey et al., 2001), density reduction of Helicobacter pylori (Mithen et al., 2000), liver function improvement (Gaona-Gaona et al., 2011), and suppression of fat absorption (Washida et al., 2010). Nozawana (Brassica rapa L.), which is a type of Brassica vegetable mainly savored as pickles, is attracting research attention owing to its health functionality; nozawana is known to be one of the three major pickles in Japan.
The desulfurization method has been frequently applied for the quantification of glucosinolates (Björkqvist and Hase 1988). While this outstanding analytical method can detect glucosinolates with high selectivity, the pretreatment process is extremely complicated and unsuitable for measuring numerous samples. Because several samples have to be analyzed to verify the health functionality of glucosinolates in nozawana, a simpler and more quantitative glucosinolate analysis method is required.
Apart from desulfurization, simple extraction and high-performance liquid chromatography (HPLC) have been employed in several studies on the quantification of glucosinolates. For example, sinigrin and glucoraphanin were determined in Brassica species by ion-pair HPLC (Rangkadilok et al., 2002), and glucoraphanin and glucoerucin present in a food item containing Eruca sativa seeds have been quantified by liquid chromatography–mass spectrometry (LC–MS) (Franco et al., 2016); multiple glucosinolates have been simultaneously determined by HPLC-triple quadrupole MS (Mellon et al., 2002) and ultra-HPLC in tandem with MS, time-of-flight MS, and orbitrap-MS (Andini et al., 2020; Hwang et al., 2019; Li et al., 2021). However, none of the aforementioned studies optimized their methods for detecting glucosinolates in nozawana. It is necessary to examine the optimum analytical conditions for glucosinolates in nozawana, including extraction conditions, HPLC or LC–MS conditions, and purification methods, since the content of glucosinolates and other components contained in them varies depending on the species of cruciferous plants. Additionally, no analysis method for glucosinolates has been evaluated for validity so far. Therefore, we developed and validated a method for quantification of glucosinolates in nozawana.
An analytical method was developed in the present study for quantifying multiple glucosinolates in nozawana using a simple pretreatment procedure; a single-laboratory validation study was also executed. Solid-phase extraction with a silica gel-based ion-exchange resin was introduced in the pretreatment step, and quantification was performed using a UV detector owing to its high versatility. In addition, the simultaneous use of mass spectrometry (MS) facilitated the identification of glucosinolates based on molecular weights without the use of standard samples. The developed analytical method was tested using a single-laboratory validation study on the following important glucosinolates in nozawana: gluconapin, glucobrassicanapin, glucoercin, and gluconasturtiin. Acceptable intra-laboratory precision results were also obtained.
Moreover, a multi-laboratory validation study was performed. According to the guidelines recommended by the Association of Official Analytical Chemists (AOAC), multi-laboratory validation studies require eight or more laboratories (AOAC Appendix D, 2002); however, there have been instances wherein studies were performed in a smaller number of laboratories, such as four (Watanabe et al., 2012) and five (Prior et al., 2010). In the present study, a simple multi-laboratory validation study was performed in three laboratories.
Materials and Methods
Chemicals and reagents Sinigrin, glucomoringin, gluconapin, glucobrassicanapin, glucoerucin, and gluconasturtiin (each in the form of a potassium salt) were sourced from Extrasynthese (Lyon, France). Methanol (LC–MS grade), acetonitrile (LC–MS grade), and ammonium formate (HPLC grade, 1 mol/L aqueous solution) were purchased from FUJIFILM Wako Pure Chemical Corporation (Osaka, Japan). Solid-phase extraction was performed using an InertSep NH2 sorbent (500 mg/3 mL) purchased from GL Sciences Inc. (Tokyo, Japan).
Preparation of standards Sinigrin and glucomoringin were selected as internal standards because of their relative ease of purchase and lack of overlapping peaks with those of other glucosinolates. The internal standard reagent was prepared as follows: Two separate solutions of sinigrin and glucomoringin potassium salts (10.4 and 6.1 mg, respectively) were prepared using 50 % (v/v) methanol; the volume was subsequently adjusted to 10 mL with 50 % (v/v) methanol to yield 2.5 and 1.0 mmol/L of the salts, respectively. Aliquots of 2.5 mL were drawn from each solution and added to a volumetric flask, and the volume was adjusted to 10 mL using 50 % methanol.
Gluconapin, glucobrassicanapin, glucoerucin, and gluconasturtiin were selected as spike standards. The prescribed amount of each reagent was weighed, and their individual volumes were adjusted to 10 mL using methanol. The prepared solutions were mixed and diluted, resulting in three types of spike standard solutions with different concentrations for the spike and recovery tests.
Materials Nozawana was divided into its leaves and stems, which were lyophilized, pulverized in a mill, and sieved. Various amounts and compositions of glucosinolates are typically present in nozawana, depending on the part of the plant or its production area. Therefore, the different parts (leaves and stems) of nozawana from different production areas (Koumi Town and Shiojiri City in Nagano Prefecture, and Tokushima Prefecture) were blended; two types of samples (A and B) with different glucosinolate contents were prepared and used for the repeatability and intermediate precision tests in the single- and multi-laboratory validation studies. Sample C, which was a mixture of A and B, was employed for the spike and recovery tests in the single-laboratory validation study.
Method for determining glucosinolates The sample powder (0.2 g) was weighed in a tube, to which 5 mL of 50 % (v/v) methanol was added; the tube was agitated and sonicated for 10 min while being heated at 50°C. The tube was cooled using running water, centrifuged (1 000 × g, 5 min), and the resulting supernatant was added to a 10-mL volumetric flask. Subsequently, 2 mL of 50 % (v/v) methanol was added to the remaining precipitate; this solution was agitated, centrifuged, and the supernatant was added to the volumetric flask containing the supernatant. The operation was repeated once and scaled-up to 10 mL using 50 % (v/v) methanol.
The scaled-up samples were filtered using a membrane filter (0.45 µm, PTFE); subsequently, 2.5 mL of the filtrate and 0.5 mL of the internal standard solution were mixed. The aliquot was loaded by dividing this solution into two 1.5-mL parts and allowed to flow through a solid-phase extraction column conditioned with 2.5 mL of 50 % (v/v) methanol at a flow rate of under 2 mL/min. After extraction, the solution was diluted using a similar volume of distilled water and was subsequently analyzed using an LC–MS apparatus (Acquity-Xevo qTofMS; Waters, Milford, MA, USA). The LC–MS conditions are listed in Table 1. The peak areas were obtained with a UV detector and the peak retention times for each glucosinolate were identified with an MS detector. The amount of each glucosinolate was calculated using the peak areas of sinigrin and glucomoringin added as internal standards.
Table 1.
conditions of LC–MS
| LC condition |
Column |
Cadenza CD-C18 HT (3 µm i.d. 3.0 mm×250 mm) |
|
Column oven temp. |
40 °C |
|
Autosampler temp. |
15 °C |
|
Flow rate |
0.4 mL/min |
|
Mobile phase |
A 5 mM ammonium formate (1% acetonitorile) |
|
|
B acetonitorile |
|
Gradient |
B (%) 0 min (0)→5 min (0)→15 min (10)→30 min (30)→30.1 min (0) |
|
Injection volume |
2 µL |
|
Wavelength |
235 nm |
| |
| MS condition |
Ionization mode |
ESI negative |
|
Capillary voltage |
2.0 kV |
|
Source temperature |
150 °C |
|
Desolvation temperature |
500 °C |
Single-laboratory validation study Two types of nozawana powder (samples A and B) with different amounts of glucosinolates were measured seven times on three different days to evaluate repeatability and intermediate precision. In addition, spike and recovery tests were performed seven times using sample C with three types of spike standards containing different concentrations to evaluate trueness. The spike standard solution (0.5 mL) was mixed with sample C (0.2 g) in a test tube, which was capped for 30 min at 20–25 °C; distilled water (0.5 mL) and methanol (4 mL, 50 % v/v) were subsequently added to the tube. Subsequently, the preparatory steps were performed in a manner similar to that used for the preparation of samples A and B; spiked and non-spiked samples were analyzed by LC–
Multi-laboratory validation study The multi-laboratory validation study was performed in three participating laboratories, including the host institution of the study, in which the test was performed by a different analyst than the one who was involved in the preparation of this study.
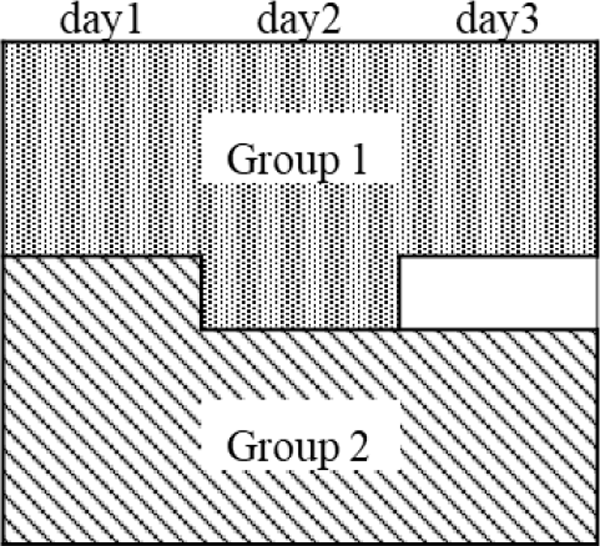
The two nozawana powder samples (A and B) used in the single-laboratory validation study were separated into two groups, 1 and 2, as shown in Fig. 1. Group 1 consisted of three, four, and three samples obtained from days 1, 2, and 3, respectively. Group 2 consisted of four, three, and three samples from days 1, 2, and 3, respectively; these samples were different from those selected in group 1. Considering that these groups involved two parallel and ten-times measurements, the within- and between-standard deviations were calculated using one-way analysis of variance. To confirm the homogeneity of the sample, the obtained values were applied to an F-test with a confidence level of 95 %.
Samples for the multi-laboratory validation study were extracted from groups 1 and 2 that were obtained from samples A and B. Each sample was randomly labeled, and four samples (A1, A2, B1, and B2) were provided to each laboratory. In addition, an internal standard and reference solution were provided to enable construction of the calibration curve. Additionally, because one laboratory only had access to an HPLC system (not an LC–MS system), standard samples containing the four glucosinolates (gluconapin, glucobrassicanapin, glucoerucin, and gluconasturtiin) were provided for this laboratory to identify the peaks of each glucosinolate.
Several standard solutions containing sinigrin (5–625 µmol/L) and glucomoringin (2–250 µmol/L) were prepared to confirm that the concentration of the internal standard was within the range of first-order correlation. The lower limit of quantification (LLOQ) in the experiments conducted by the participating laboratories was calculated using the results of each standard solution. The LLOQ was defined as the lowest concentration of the standard solution in which the signal-to-noise ratio was over 10.
The method used for determining the glucosinolates was performed using a similar procedure in each laboratory. Moreover, similar LC columns were employed; however, the internal diameter was modified in accordance with the HPLC or LC–MS setups of each laboratory. The flow rate and injection volume were adjusted based on the internal diameter of the columns.
Analysis of results The values of the repeatability relative standard deviation (RSDr), reproducibility relative standard deviation (RSDR), and Horwitz ratio (HorRat) were calculated using one-way analysis of variance for each glucosinolate. In addition, the predicted RSDR (PRSDR) was calculated using Horwitz's modified equation (Eq. 1) as follows:
where
C represents the mass fraction (w/w) of each glucosinolate in the samples.
Moreover, the HorRat values were calculated as follows:
Results and Discussion
Determination via LC-MS The chromatogram obtained by LC–MS is shown in Fig. 2. The glucosinolate peaks reported by Suzuki et al. (2006) who investigated the typical glucosinolates present in nozawana, are observed to be well separated in our measurements. A method involving an anion-exchange resin (Felker and Bunch 2020) for solid-phase extraction was employed in a recent study, in which glucosinolates were absorbed by a resin and eluted by an ammmonium solution, after allowing it to flow through impurities. In this study, impurities were adsorbed using an aminopropyl resin and purified by allowing it to flow through the glucosinolates. This facilitated the removal of contaminant peaks, which was presumed to enable a more accurate quantification of the glucosinolates.

The column (Cadenza CD-C18HT; Imtact, Kyoto, Japan) showed excellent resolution and good peak separation. The peak shape became distorted at high concentrations of the organic solvent in the sample solution, owing to the difference in the concentration of the organic solvent and that of the mobile phase liquid. However, this problem was resolved when the concentration of methanol in the sample solution was reduced to below 25 % (Fig. 3).

Single-laboratory validation study Table 2 shows the RSDr and RSDI calculated from the measurements results for samples A and B. According to the AOAC guidelines (AOAC Appendix K, 2002), the accuracy standard of repeatability involves an RSDr of 4 % and an RSDI of 8 % in the 0.01–0.1 % (w/w) concentration range, and an RSDr of 3 % and an RSDI of 6 % in the 0.1–1 % (w/w) concentration range, where the concentration represents the amount of glucosinolate in the nozawana powder samples. The results for each glucosinolate, internal standard, and spike concentration are observed to be within the tolerance indicated by these AOAC guidelines.
Table 2.
Results of repeated measurements for the glucosinolates of nozawana dry powder samples.
| sample A |
gluconapin content (mg/g) |
gbcobrasicanapin content (mg/g) |
gbcoerucin content (mg/g) |
gbconasturtiin content (mg/g) |
| sinigrin equivalent |
gbcomorirgin equivalent |
sinigrin equivalent |
gbcomoringin equivalent |
sinigrin equivalent |
gbcomoringin equivalent |
sinigrin equivalent |
gbcomoringin equivalent |
|
day1 |
day2 |
day3 |
day1 |
day2 |
day3 |
day1 |
day2 |
day3 |
day1 |
day2 |
day3 |
day1 |
day2 |
day3 |
day1 |
day2 |
day3 |
day1 |
day2 |
day3 |
day1 |
day2 |
day3 |
| 1 |
1.71 |
1.77 |
1.82 |
1.26 |
1.31 |
1.26 |
0.220 |
0.220 |
0.215 |
0.163 |
0.163 |
0.149 |
0.504 |
0.499 |
0.548 |
0.372 |
0.369 |
0.378 |
0.196 |
0.179 |
0.188 |
0.145 |
0.132 |
0.130 |
| 2 |
1.75 |
1.79 |
1.81 |
1.25 |
1.30 |
1.25 |
0.228 |
0.231 |
0.217 |
0.162 |
0.167 |
0.150 |
0.520 |
0.487 |
0.545 |
0.371 |
0.353 |
0.391 |
0.204 |
0.176 |
0.189 |
0.145 |
0.127 |
0.131 |
| 3 |
1.74 |
1.79 |
1.80 |
1.27 |
1.30 |
1.25 |
0.224 |
0.226 |
0.213 |
0.164 |
0.164 |
0.148 |
0.511 |
0.506 |
0.540 |
0.374 |
0.367 |
0.375 |
0.197 |
0.181 |
0.184 |
0.144 |
0.132 |
0.127 |
| 4 |
1.70 |
1.81 |
1.80 |
1.23 |
1.30 |
1.24 |
0.219 |
0.230 |
0.218 |
0.159 |
0.166 |
0.151 |
0.517 |
0.498 |
0.541 |
0.374 |
0.359 |
0.375 |
0.183 |
0.179 |
0.184 |
0.132 |
0.129 |
0.128 |
| 5 |
1.80 |
1.81 |
1.79 |
1.28 |
1.32 |
1.31 |
0.235 |
0.216 |
0.215 |
0.167 |
0.157 |
0.157 |
0.520 |
0.500 |
0.525 |
0.369 |
0.363 |
0.384 |
0.186 |
0.175 |
0.182 |
0.132 |
0.127 |
0.133 |
| 6 |
1.78 |
1.77 |
1.80 |
1.28 |
1.29 |
1.25 |
0.234 |
0.225 |
0.219 |
0.169 |
0.165 |
0.152 |
0.522 |
0.501 |
0.531 |
0.377 |
0.366 |
0.370 |
0.181 |
0.186 |
0.181 |
0.130 |
0.136 |
0.126 |
| 7 |
1.77 |
1.78 |
1.79 |
1.27 |
1.32 |
1.26 |
0.247 |
0.214 |
0.216 |
0.178 |
0.158 |
0.151 |
0.522 |
0.509 |
0.521 |
0.375 |
0.376 |
0.365 |
0.192 |
0.176 |
0.173 |
0.138 |
0.131 |
0.121 |
| Mean content (mg/g) |
|
1.78 |
|
|
1.28 |
|
|
0.223 |
|
|
0.160 |
|
|
0.517 |
|
|
0.372 |
|
|
0.184 |
|
|
0.132 |
|
| Sr(mg/g) |
|
0.02 |
|
|
0.02 |
|
|
0.007 |
|
|
0.005 |
|
|
0.008 |
|
|
0.007 |
|
|
0.006 |
|
|
0.005 |
|
| RSDr(%) |
|
1.3 |
|
|
1.3 |
|
|
3.2 |
|
|
2.9 |
|
|
1.6 |
|
|
1.8 |
|
|
3.3 |
|
|
3.6 |
|
| SI (mg/g) |
|
0.03 |
|
|
0.03 |
|
|
0.009 |
|
|
0.009 |
|
|
0.02 |
|
|
0.009 |
|
|
0.008 |
|
|
0.007 |
|
| RSDI(%) |
|
1.9 |
|
|
2.3 |
|
|
4.2 |
|
|
5.5 |
|
|
3.8 |
|
|
2.4 |
|
|
4.6 |
|
|
5.2 |
|
| sample B |
gluconapin content (mg/g) |
gbcobrasicanapin content (mg/g) |
gbcoerucin content (mg/g) |
gbconasturtiin content (mg/g) |
| sinigrin equivalent |
gbcomorirgin equivalent |
sinigrin equivalent |
gbcomoringin equivalent |
sinigrin equivalent |
gbcomoringin equivalent |
sinigrin equivalent |
gbcomoringin equivalent |
|
day1 |
day2 |
day3 |
day1 |
day2 |
day3 |
day1 |
day2 |
day3 |
day1 |
day2 |
day3 |
day1 |
day2 |
day3 |
day1 |
day2 |
day3 |
day1 |
day2 |
day3 |
day1 |
day2 |
day3 |
| 1 |
5.20 |
5.19 |
5.28 |
4.06 |
4.01 |
3.95 |
0.553 |
0.532 |
0.536 |
0.432 |
0.412 |
0.401 |
0.515 |
0.491 |
0.504 |
0.402 |
0.380 |
0.376 |
0.473 |
0.488 |
0.473 |
0.370 |
0.378 |
0.354 |
| 2 |
5.28 |
5.08 |
5.10 |
4.05 |
4.04 |
4.05 |
0.551 |
0.536 |
0.516 |
0.423 |
0.427 |
0.410 |
0.536 |
0.486 |
0.492 |
0.412 |
0.387 |
0.369 |
0.486 |
0.472 |
0.460 |
0.374 |
0.376 |
0.365 |
| 3 |
4.93 |
5.15 |
5.07 |
4.10 |
4.01 |
4.07 |
0.513 |
0.529 |
0.517 |
0.426 |
0.412 |
0.414 |
0.509 |
0.503 |
0.504 |
0.423 |
0.392 |
0.405 |
0.454 |
0.487 |
0.458 |
0.377 |
0.380 |
0.367 |
| 4 |
5.08 |
5.27 |
5.25 |
3.98 |
4.07 |
4.01 |
0.530 |
0.546 |
0.542 |
0.416 |
0.421 |
0.414 |
0.521 |
0.488 |
0.497 |
0.408 |
0.377 |
0.380 |
0.467 |
0.486 |
0.472 |
0.366 |
0.375 |
0.361 |
| 5 |
5.19 |
5.36 |
5.29 |
4.03 |
4.19 |
3.97 |
0.538 |
0.567 |
0.547 |
0.418 |
0.443 |
0.411 |
0.510 |
0.477 |
0.497 |
0.396 |
0.373 |
0.373 |
0.486 |
0.493 |
0.471 |
0.378 |
0.385 |
0.354 |
| 6 |
5.27 |
5.24 |
5.30 |
4.17 |
4.19 |
3.96 |
0.549 |
0.551 |
0.544 |
0.435 |
0.440 |
0.406 |
0.530 |
0.477 |
0.494 |
0.419 |
0.381 |
0.369 |
0.486 |
0.482 |
0.479 |
0.385 |
0.385 |
0.358 |
| 7 |
5.13 |
5.11 |
5.38 |
4.08 |
3.99 |
4.09 |
0.537 |
0.523 |
0.549 |
0.427 |
0.408 |
0.417 |
0.514 |
0.482 |
0.508 |
0.408 |
0.376 |
0.386 |
0.477 |
0.480 |
0.473 |
0.380 |
0.375 |
0.360 |
| Mean content (mg/g) |
|
5.20 |
|
|
4.05 |
|
|
0.538 |
|
|
0.420 |
|
|
0.502 |
|
|
0.390 |
|
|
0.476 |
|
|
0.371 |
|
| Sr (mg/g) |
|
0.11 |
|
|
0.07 |
|
|
0.01 |
|
|
0.01 |
|
|
0.009 |
|
|
0.01 |
|
|
0.009 |
|
|
0.005 |
|
| RSDr(%) |
|
2.1 |
|
|
1.6 |
|
|
2.7 |
|
|
2.3 |
|
|
1.7 |
|
|
2.5 |
|
|
1.9 |
|
|
1.4 |
|
| Si (mg/g) |
|
0.11 |
|
|
0.07 |
|
|
0.01 |
|
|
0.01 |
|
|
0.02 |
|
|
0.02 |
|
|
0.01 |
|
|
0.01 |
|
| RSDI(%) |
|
2.1 |
|
|
1.7 |
|
|
2.5 |
|
|
2.9 |
|
|
3.7 |
|
|
5.0 |
|
|
2.4 |
|
|
3.1 |
|
Sr = Repeatability standard deviation
RSDr = Repeatability relative standard deviation
SI = Intermediate precision standard deviation
RSDI = Intermediate precision relative standard deviation
The results for sample C and the three types of spike standards employed in the spike and recovery test are shown in Table 3; the results of the spike and recovery test are shown in Table 4. According to the AOAC guidelines (AOAC Appendix K, 2002), the accuracy standard for recovery rates is 85—110 % in the 0.01—0.1 % (w/w) concentration range and 90–108 % in the 0.1–1 % (w/w) concentration range. Each glucosinolate is noted to be within the acceptable range for each internal and spike standard at each concentration in the present study.
Table 3.
Mesurement results of nozawana dry powder sample C, and the spike standards
|
|
glucosinolate content (mg/g or mL) |
|
|
sinigrin equivalent |
glucomoringin equivalent |
|
|
GNp |
GBc |
GE |
GNt |
GNp |
GBc |
GE |
GNt |
| sample C (mg/g) |
3.543 |
0.383 |
0.523 |
0.329 |
2.606 |
0.282 |
0.385 |
0.242 |
|
+ |
0.210 |
0.083 |
0.091 |
0.093 |
0.139 |
0.055 |
0.060 |
0.062 |
| spike standard (mg/mL) |
++ |
0.140 |
0.056 |
0.061 |
0.062 |
0.093 |
0.037 |
0.040 |
0.041 |
|
+++ |
0.105 |
0.042 |
0.045 |
0.047 |
0.070 |
0.028 |
0.030 |
0.031 |
GNp : gluconapin GBc : glucobrasicanapin GE : glusoerucin GNt gluconasturtiin
Table 4.
The results of the spike recovery test of glucosinolates
|
gluconapin recovery(%) |
glucobrasicanapin recovery(%) |
|
sinigrin equivalent |
glucomoringin equivalent |
sinigrin equivalent |
glucomoringin equivalent |
| spike standard |
+ |
++ |
+++ |
+ |
++ |
+++ |
+ |
++ |
+++ |
+ |
++ |
+++ |
| 1 |
106.3 |
106.4 |
101.0 |
91.3 |
94.5 |
91.0 |
104.6 |
94.7 |
97.5 |
106.2 |
96.0 |
99.0 |
| 2 |
96.7 |
108.1 |
96.7 |
93.8 |
89.9 |
96.8 |
103.6 |
97.1 |
94.0 |
109.8 |
96.2 |
99.7 |
| 3 |
95.1 |
108.9 |
99.1 |
93.6 |
95.8 |
94.7 |
102.0 |
99.1 |
96.3 |
108.7 |
100.2 |
100.2 |
| 4 |
95.3 |
104.3 |
103.5 |
99.1 |
95.7 |
98.0 |
103.1 |
101.7 |
98.3 |
111.9 |
104.9 |
101.7 |
| 5 |
96.6 |
102.3 |
102.9 |
96.0 |
96.4 |
97.2 |
103.4 |
96.2 |
99.1 |
110.4 |
100.1 |
102.6 |
| 6 |
97.8 |
102.2 |
98.4 |
105.0 |
94.3 |
100.0 |
98.4 |
95.9 |
96.8 |
107.8 |
99.0 |
103.4 |
| 7 |
102.2 |
108.0 |
101.2 |
96.8 |
103.7 |
92.7 |
102.1 |
94.5 |
95.2 |
107.1 |
98.6 |
97.2 |
| Mean |
98.6 |
105.8 |
100.4 |
96.5 |
95.8 |
95.8 |
102.5 |
97.0 |
96.7 |
108.8 |
99.3 |
100.5 |
| Mean recovery (%) |
|
101.6 |
|
|
96.0 |
|
|
98.7 |
|
|
102.9 |
|
| Sr (mg/g) |
|
3.2 |
|
|
3.9 |
|
|
2.1 |
|
|
2.4 |
|
| RSDr(%) |
|
3.2 |
|
|
4.1 |
|
|
2.2 |
|
|
2.3 |
|
| SI (mg/g) |
|
4.8 |
|
|
3.7 |
|
|
3.8 |
|
|
5.6 |
|
| RSDI(%) |
|
4.7 |
|
|
3.8 |
|
|
3.8 |
|
|
5.5 |
|
|
glucoerucin recovery(%) |
gluconasturtiin recovery(%) |
|
sinigrin equivalent |
glucomoringin equivalent |
sinigrin equivalent |
glucomoringin equivalent |
| spike standard |
+ |
++ |
+++ |
+ |
++ |
+++ |
+ |
++ |
+++ |
+ |
++ |
+++ |
| 1 |
89.5 |
100.9 |
89.8 |
88.4 |
101.4 |
89.8 |
97.2 |
97.1 |
95.4 |
99.7 |
99.9 |
97.9 |
| 2 |
89.5 |
102.0 |
89.8 |
93.7 |
99.7 |
94.6 |
93.1 |
97.8 |
92.3 |
99.2 |
98.5 |
98.4 |
| 3 |
90.4 |
101.3 |
94.2 |
95.2 |
101.2 |
97.2 |
95.3 |
94.5 |
93.2 |
102.0 |
96.6 |
97.7 |
| 4 |
89.6 |
100.4 |
94.8 |
96.7 |
102.4 |
97.2 |
91.6 |
96.3 |
96.2 |
99.6 |
100.2 |
100.3 |
| 5 |
89.8 |
106.5 |
94.2 |
94.9 |
110.3 |
96.4 |
97.1 |
94.9 |
95.4 |
104.2 |
99.6 |
99.4 |
| 6 |
92.4 |
102.2 |
91.3 |
101.0 |
104.7 |
96.9 |
87.1 |
100.3 |
92.1 |
95.6 |
104.7 |
98.7 |
| 7 |
87.5 |
101.1 |
94.6 |
90.3 |
104.9 |
95.6 |
93.3 |
98.1 |
96.6 |
98.4 |
103.4 |
99.7 |
| Mean |
89.8 |
102.0 |
92.7 |
94.3 |
103.5 |
95.4 |
93.5 |
97.0 |
94.5 |
99.8 |
100.4 |
98.9 |
| Mean recovery (%) |
|
94.8 |
|
|
97.7 |
|
|
95.0 |
|
|
99.7 |
|
| Sr (mg/g) |
|
2.0 |
|
|
3.5 |
|
|
2.6 |
|
|
2.3 |
|
| RSDr(%) |
|
2.1 |
|
|
3.6 |
|
|
2.7 |
|
|
2.3 |
|
| SI (mg/g) |
|
6.6 |
|
|
6.0 |
|
|
3.0 |
|
|
2.3 |
|
| RSDI(%) |
|
7.0 |
|
|
6.1 |
|
|
3.1 |
|
|
2.3 |
|
Sr = Repeatability standard deviation.
RSDr = Repeatability relative standard deviation.
SI = Intermediate precision standard deviation.
RSDI = Intermediate precision relative standard deviation.
In addition, the The International Council for Harmonisation of Technical Requirements for Pharmaceuticals for Human Use (ICH) guidelines (ICH, 2005) recommend the calculation of the mean value, RSDr, and RSDI using a three-times-over analysis in parallel at three different concentrations. The results in Table 4 reveal that the RSDr and RSDI are nearly within the accuracy standards indicated by the AOAC guidelines; moreover, the RSDr is less than 4 % and less than 3 % in the concentration ranges of 0.01–0.1 % (w/w) and 0.1–1 %, respectively, and the RSDI is less than 8 % and less than 6 % in the concentration ranges of 0.01–0.1 % (w/w) and 0.1–1 % (w/w), respectively. Although the RSDr for gluconapin slightly exceeds the standard value, the RSDr and RSDI are within the standard value. Therefore, these results indicate that there was only a minor problem in the analysis.
Consequently, the analytical method developed in this study was shown to provide sufficient accuracy using a single-laboratory setup. The pretreatment stage in the desulfurization method is extremely complicated because it involves numerous steps and complicated treatments, such as ion exchange and sulfatase treatment, and is also time consuming (∼2 d). However, the pretreatment in the method developed in this study is extremely convenient owing to the use of simple extraction and solid-phase extraction, for which less than one hour per sample is required. Additionally, this analytical method showed sufficient accuracy with both the internal standards sinigrin and glucomoringin. This indicates that this method might be applicable to quantification of glucosinolates including sinigrin or glucomoringin in other cruciferous plants.
Multi-laboratory validation study The coefficient of determination (R2) obtained from the calibration curve for the sinigrin and glucomoringin standards and the LLOQ for experiments conducted in the participating laboratories is shown in Table 5. The R2 value for the calibration curve is over 0.99 for the measurements obtained from each laboratory. Therefore, the quantification of the internal standard and glucosinolates in the samples was confirmed within the range of first-order correlation.
Table 5.
R
2 and LLOQ in the participating laboratories
|
sinigrin standard |
glucomoringin standard |
| laboratories |
R2 |
LLOQ(µmol/L) |
R2 |
LLOQ(µmol/L) |
| 1 |
>0.99 |
5 |
>0.99 |
2 |
| 2 |
>0.99 |
5 |
>0.99 |
2 |
| 3 |
>0.99 |
12.5 |
>0.99 |
5 |
R2 = coefficient of determination
LLOQ = lower limit of quantification
The results of the homogeneity tests are presented in Table 6. The F-value is the ratio of the variance within a group to the variance between groups; these values were calculated using one-way analysis of variance. The F-values for all samples and glucosinolates are noted to be below the F-critical value of 4.4, which indicated that the samples used in the multi-laboratory validation study were homogeneous; F-critical was calculated using one-way analysis of variance at a confidence level of 95 %.
Table 6.
F-value of the homogeneity test
| sample A |
sinigrin equivalent |
glucomoringin equivalent |
| GNp |
GBc |
GE |
GNt |
GNp |
GBc |
GE |
GNt |
| F-value |
0.0005 |
0.2 |
0.01 |
2.6 |
0.2 |
0.2 |
0.05 |
1.5 |
| sample B |
sinigrin equivalent |
glucomoringin equivalent |
| GNp |
GBc |
GE |
GNt |
GNp |
GBc |
GE |
GNt |
| F-value |
2.6 |
3.0 |
0.1 |
1.4 |
0.5 |
0.7 |
0.2 |
0.05 |
GNp : gluconapin GBc : glucobrasicanapin GE : glusoerucin GNt : gluconasturtiin
Table 7 shows the analysis results for measurements obtained from the three participating laboratories. The HorRat values for gluconapin and glucobrassicanapin, which are the primary glucosinolates in nozawana, are between 0.5 and 2.0 for each of the internal standards. Typically, a HorRat value of 2.0 or less indicates satisfactory reproducibility of the method. Therefore, this analytical method was shown to provide sufficient accuracy for the quantification of these glucosinolates in a multi-laboratory setup.
Table 7.
Results of the multi-laboratory study
|
gluconapin content (mg/g) |
glucobrasicanapin content (mg/g) |
|
sinigrin equivalent |
glucomoringin equivalent |
sinigrin equivalent |
glucomoringin equivalent |
| Sample |
A1 |
A2 |
B1 |
B2 |
A1 |
A2 |
B1 |
B2 |
A1 |
A2 |
B1 |
B2 |
A1 |
A2 |
B1 |
B2 |
| Labo 1 |
1.81 |
1.82 |
5.05 |
5.24 |
1.31 |
1.29 |
3.87 |
3.80 |
0.210 |
0.211 |
0.433 |
0.450 |
0.152 |
0.149 |
0.332 |
0.326 |
| Labo 2 |
1.72 |
1.65 |
4.98 |
4.72 |
1.20 |
1.18 |
3.97 |
3.66 |
0.241 |
0.227 |
0.547 |
0.520 |
0.167 |
0.162 |
0.435 |
0.402 |
| Labo 3 |
1.79 |
1.82 |
4.74 |
4.87 |
1.11 |
1.05 |
3.37 |
3.44 |
0.237 |
0.221 |
0.478 |
0.501 |
0.147 |
0.127 |
0.340 |
0.354 |
| Number of laboratories |
|
3 |
|
3 |
|
3 |
|
3 |
|
3 |
|
3 |
|
3 |
|
3 |
| Mean (mg/g) |
|
1.77 |
|
4.94 |
|
1.19 |
|
3.68 |
|
0.224 |
|
0.488 |
|
0.151 |
|
0.365 |
| Sr (mg/g) |
|
0.03 |
|
0.14 |
|
0.03 |
|
0.13 |
|
0.01 |
|
0.02 |
|
0.01 |
|
0.01 |
| RSDr (%) |
|
1.71 |
|
2.84 |
|
2.34 |
|
3.61 |
|
3.86 |
|
3.29 |
|
5.66 |
|
4.06 |
| SR (mg/g) |
|
0.07 |
|
0.21 |
|
0.11 |
|
0.26 |
|
0.01 |
|
0.05 |
|
0.02 |
|
0.05 |
| RSDR (%) |
|
4.23 |
|
4.24 |
|
9.48 |
|
6.99 |
|
6.21 |
|
9.64 |
|
10.0 |
|
13.3 |
| PRSDR (%) |
|
5.19 |
|
4.45 |
|
5.51 |
|
4.65 |
|
7.08 |
|
6.30 |
|
7.52 |
|
6.58 |
| HorRat |
|
0.82 |
|
0.95 |
|
1.72 |
|
1.50 |
|
0.88 |
|
1.53 |
|
1.33 |
|
2.02 |
|
glucoerucin content (mg/g) |
gluconasturtiin content (mg/g) |
|
sinigrin equivalent |
glucomoringin equivalent |
sinigrin equivalent |
glucomoringin equivalent |
| Sample |
A1 |
A2 |
B1 |
B2 |
A1 |
A2 |
B1 |
B2 |
A1 |
A2 |
B1 |
B2 |
A1 |
A2 |
B1 |
B2 |
| Labo 1 |
0.419 |
0.432 |
0.436 |
0.417 |
0.303 |
0.306 |
0.334 |
0.302 |
0.152 |
0.141 |
0.437 |
0.411 |
0.110 |
0.100 |
0.335 |
0.298 |
| Labo 2 |
0.511 |
0.490 |
0.507 |
0.465 |
0.355 |
0.350 |
0.404 |
0.360 |
0.178 |
0.177 |
0.357 |
0.448 |
0.124 |
0.126 |
0.284 |
0.347 |
| Labo 3 |
0.810 |
0.836 |
0.573 |
0.590 |
0.501 |
0.480 |
0.408 |
0.417 |
0.366 |
0.241 |
0.502 |
0.598 |
0.227 |
0.138 |
0.357 |
0.423 |
| Number of laboratories |
|
3 |
|
3 |
|
3 |
|
3 |
|
3 |
|
3 |
|
3 |
|
3 |
| Mean (mg/g) |
|
0.583 |
|
0.498 |
|
0.383 |
|
0.371 |
|
0.209 |
|
0.459 |
|
0.137 |
|
0.341 |
| Sr (mg/g) |
|
0.015 |
|
0.020 |
|
0.009 |
|
0.022 |
|
0.051 |
|
0.055 |
|
0.036 |
|
0.040 |
| RSDr (%) |
|
2.56 |
|
4.02 |
|
2.36 |
|
6.05 |
|
24.6 |
|
12.1 |
|
26.5 |
|
11.8 |
| SR (mg/g) |
|
0.211 |
|
0.079 |
|
0.097 |
|
0.050 |
|
0.091 |
|
0.089 |
|
0.048 |
|
0.051 |
| RSDR (%) |
|
36.3 |
|
15.9 |
|
25.3 |
|
13.6 |
|
43.4 |
|
19.3 |
|
34.7 |
|
15.0 |
| PRSDR (%) |
|
6.13 |
|
6.28 |
|
6.54 |
|
6.57 |
|
7.16 |
|
6.36 |
|
7.63 |
|
6.65 |
| HorRat |
|
5.91 |
|
2.54 |
|
3.86 |
|
2.07 |
|
6.06 |
|
3.04 |
|
4.55 |
|
2.26 |
Sr : Repeatability standard deviation.
RSDr = Repeatability relative standard deviation.
SR = Reproducibility precision standard deviation.
RSDR = Reproducibility precision relative standard deviation.
PRSDR = Predicted reproducibility precision relative standard deviation.
HorRat = RSDR / PRSDR
However, the HorRat values for glucoercin and gluconasturtiin are noted to exceed 2.0. These particular glucosinolates were present in trace amounts in the samples and were near the LLOQ in results obtained from some laboratories. Therefore, slight analytical errors were presumed to significantly affect the trace amounts of glucosinolates, as shown by the fact that the HorRat values tended to be higher in sample A, which had a lower glucosinolate content. The content of gluconasturtiin is higher in sample B than in sample A (Table 2), and the HorRat value for sample B is lower than that for sample A (Table 7). In addition, the fact that outlier values could not be excluded was also presumed to be responsible because of the small number of participating laboratories. Therefore, increasing the number of participating laboratories can presumably improve the HorRat values.
Overall, the detection of gluconapin was successful and adhered to the appropriate guidelines. This is important because gluconapin is the most significant component of glucosinolates in nozawana and is reported to provide health benefits, such as the suppression of fat absorption. Therefore, the analysis method developed in this study can be applied for evaluating the health functionality of nozawana.
The method developed in the present study was verified for identifying glucosinolates in nozawana; however, future studies should be carried out to determine if this method can be applied to the detection of other glucosinolates in cruciferous plants.
Acknowledgements This work was supported by a grant from a commissioned project study on “Research development for discovery of regional agricultural products and foods having a beneficial impact on health,” Ministry of Agriculture, Fishery and Forestry, Japan.
Nozawana samples were purchased from Takeuchi Nousan, Inc. We express our gratitude to Dr. Nobuya Shirai (Institute of Food Research National Agriculture and Food Research Organization) and researcher Chiaki Ishikawa (Kyushu Okinawa Agricultural Research Center National Agriculture and Food Research Organization) for their participation in this study, researcher Hiroaki Serizawa (Nagano Vegetable and Ornamental Crops Experiment Station) for providing samples of nozawana and cooperating in the development of analysis methods, and Dr. Takayuki Kawai (Institute of Food Research, Notional Agriculture and Food Research Organization) for being the research project group leader.
Conflict of interest There are no conflicts of interest to declare.
References
- AOAC Appendix K. (2002). AOAC Guidelines for Single Laboratory Validation of Chemical Methods for Dietary Supplements and Botanicals.
- Andini, S., Araya-Cloutier, C., Sanders, M., and Vincken, J.P. (2020). Simultaneous analysis of glucosinolates and isothiocyanates by reversed-phase ultra-high-performance liquid chromatography–electron spray ionization–tandem mass spectrometry. J. Agric. Food Chem., 68, 3121-3131.
- Björkqvist, B. and Hase, A. (1988). Separation and determination of intact glucosinolates in rapeseed by high-performance liquid chromatography. J. Chromatogr., 435, 501-507.
- Fahey, J.W., Zalcmann, A.T., and Talalay, P. (2001). The chemical diversity and distribution of glucosinolates and isothiocyanates among plants. Phytochemistry, 56, 5-51.
- Felker, P. and Bunch, R.A. (2020). Intact glucosinolate determination in brassica vegetables using anion exchange cleanup and HILIC (hydrophilic interaction liquid chromatography) HPLC chromatography. Food Anal. Method., 13, 1817-1828.
- Franco, P., Spinozzi, S., Pagnotta, E., Lazzeri, L., Ugolini, L., Camborata, C., and Roda, A. (2016). Development of a liquid chromatography–electrosprayionization–tandem mass spectrometry method for the simultaneousanalysis of intact glucosinolates and isothiocyanates in Brassicaceaeseeds and functional foods. J. Chromatogr. A, 1428, 154-161.
- Gaona-Gaona, L., Molina-Jijón, E., Tapia, E., Zazueta, C., Hernández-Pando, R., Calderón-Oliver, M., Zarco-Márquez, G., Pinzón, E., and Pedraza-Chaverri, J. (2011). Protective effect of sulforaphane pretreatment against cisplatin-induced liver and mitochondrial oxidant damage in rats. Toxicology, 286, 20-27.
- Hwang, I.M., Park, B., Dang, Y.M., Kim, S.Y., and Seo, H.Y. (2019). Simultaneous direct determination of 15 glucosinolates in eight Brassica species by UHPLC-Q-Orbitrap-MS. Food Chem., 282, 127-133.
- IC. (2005). ICH: Validation of analytical procedures: Text and Methodology, Q2, (R1).
- Kiddle, G., Bennett, R.N., Botting, N.P., Davidson, N.E., Robertson, A.A., and Wallsgrove, R.M. (2001). High-performance liquid chromatographic separation of natural and synthetic desulphoglucosinolates and their chemical validation by UV, NMR and chemical ionisation-MS methods. Phytochem. Anal., 12, 226-242.
- Li, Z., Zheng, S., Liu, Y., Fang, Z., Yang, L., Zhuang, M., Zhang, Y., Lv, H., Wang, Y., and Xu, D. (2021). Characterization of glucosinolates in 80 broccoli genotypes and different organs using UHPLC-Triple-TOF-MS method. Food Chem., 334, 127519.
- Mellon, F.A., Bennett, R.N., Holst, B., and Williamson, G. (2002). Intact glucosinolate analysis in plant extracts by programmed cone voltage electrospray LC/MS: Performance and comparison with LC/MS/MS methods. Anal. BioChem., 306, 83-91.
- Mithen, R.F., Dekker, M., Verkerk, R., Rabot, S., and Johnson, I.T. (2000). The nutritional significance, biosynthesis and bioavailability of glucosinolates in human foods. J. Sci. Food Agric., 80, 967-984.
- Prior, R.L., Fan, E., Ji, H., Howell, A., Nio, C., Payne, M.J., and Reed, J. (2010). Multi-laboratory validation of a standard method for quantifying proanthocyanidins in cranberry powders. J. Sci. Food Agric., 90, 1473-1478.
- Rangkadilok, N., Nicolas, N.E., Bennett, R.N., Premier, R.R., Eagling, D.R., and Taylor, P.W.J. (2002). Determination of sinigrin and glucoraphanin in Brassica species using a simple extraction method combined with ion-pair HPLC analysis. Sci. Hortic. Amsterdam, 96, 27-41.
- Suzuki, C., Ohnishi-Kameyama, M., Sasaki, K., Murata, T., and Yoshida, M. (2006). Behavior of glucosinolates in pickling cruciferous vegetables. J. Agric. Food Chem., 54, 9430-9436.
- Washida, K., Miyata, M., Koyama, T., Yazawa, K., and Nomoto, K. (2010). Suppressive effect of Yamato-mana (Brassica rapa L. oleifera group) constituent 3-butenyl glucosinolate (gluconapin) on postprandial hypertriglyceridemia in mice. Biosci. Biotechnol. BioChem., 74, 1286-1289.
- Watanabe, J., Takebayashi, J., Takano-Ishikawa, Y., and Yasui, A. (2012). Evaluation of a method to quantify quercetin aglycone in onion (Allium cepa) by single- and multi-laboratory validation studies. Anal. Sci., 28, 1179-1182.

