Technical papers
Effects of compression damage on mechanical behavior and quality attributes of apple fruit
2022 Volume 28 Issue 1 Pages 53-65

Details
2022 Volume 28 Issue 1 Pages 53-65
Fresh apples are easily damaged during machining processing. To solve the compression damage of the apple, the impacts of compression damage and storage time on failure mechanical behavior and quality indexes of apple fruits were evaluated in this study, where the different compression forces (0, 40, 80, 160, 320, 640 N) were loaded on the equator position of apple fruits stored at 5 ± 0.5 °C for 16 days. Then, we investigated the damaged mechanical behavior, damage volume, weight loss, ethylene production, respiratory rate, firmness, browning degree, titratable acidity (TA), total soluble solids (TSS), TSS/TA rate, malondialdehyde (MDA), cell membrane permeability, ascorbic acid, total phenolic, total flavonoids, pectin and soluble pectin of apple were analyzed. The experiment results showed that the apple fruit will not be damaged, if the compressive force is less than 40 N. Compared with the 0 and 40 N groups, the weight loss of harvested apple fruit under compressive forces with 80, 160, 320, and 640 N significantly increased, while the browning degree, MDA, cell membrane permeability and soluble pectin firmness, ascorbic acid, total phenolic, total flavonoids and pectin decreased. In conclusion, in the process of post-harvest processing (picking, transportation, sorting, and packaging), the contact force between apple fruit and mechanical equipment should be limited to less than 40 N to avoid mechanical damage, and thus extending its shelf life and improving its commercial quality.
Fresh apple is a significant part of the human diet and has gained popularity due to its functional diversity and excellent nutritional value. Annual production is more than 40 million tons with an apple production value more than 19 billion dollars since 2019i). Therefore, apple quality also plays a crucial role in the economic impact (Bovi et al., 2018). People's pursuit of fruit quality is getting higher and higher (Galindo et al., 2017). At present, the main reason for the deterioration of fruit quality and post-harvest loss during storage is fruit injury (Hussein et al., 2017, 2020). Consequently, understanding the damaged fruit in post-harvest treatment has become a significant project in researching the damage mechanism for fruit.
Damaged fruit during post-harvest treatment has been reported in many studies (Ahmadi, 2012; Polat et al., 2012). The apple bruise not only affects the external characteristics of fruit, but also causes loss of internal quality of fruit and promote fruit rot (Montero et al., 2009). Apple (‘Fuji suprema’) is more prone to rot under the impact, pressure and cutting (Hendges et al., 2011). In addition, vibration causes the degradation of apple fruit quality and the change of ethylene synthase (Lu et al., 2019). Three kinds of pomegranate fruits (‘Acco’ ‘Herskawitz’ and ‘Wonderful’) have different damaged sensitivity with different drop heights. Physiological response of damaged pomegranates fruit stored at a relatively high temperature is more obvious (Hussein et al., 2019). Generally, fresh fruits are subjected to various extrusions during loading-unloading and transportation, which can cause tissue damage, bruise and metabolic change (Hiroaki et al., 2010; Ishikawa et al., 2009). And fruit bruise refers to the browning of the tissue under the pericarp causing by an external force. The external force produced during extrusion affects the browning degree of apples. When the external pressure on the apple's surface exceeds its yield limit, the cell wall is damaged and the cell fluid is oxidized when overflowing (Stopa et al., 2018; Fu et al., 2016).
Most previous research on fruit focused on the effect of compression, impact and vibration on fruit mechanical properties, and less on fruit quality (Fadiji et al., 2016; Opara and Pathare, 2014; Lewis et al., 2007). The mechanical properties of two varieties of pear, including elastic modulus, fracture and compression strength, were studied by compression test. The result can provide the foundation for selecting suitable pear varieties (Pham and Liou, 2017). The relationship between damage susceptibility and internal damage energy of impact velocity is studied, which concludes that damage susceptibility and internal damage energy increase with the increase of impact velocity (Stropek and Gołacki, 2020). Different vibration frequencies of fruits during transportation may lead to change in fruit damage degree (Mo et al., 2007). So far, more detailed information on the quality changes of apple fruit under different loading conditions (e.g., different speeds, loading directions and compression force) is still lacking. Remarkably, few works about the effects of compression damage on failure mechanical behavior and quality attributes of fruit were introduced.
The purpose of this study was to investigate the effects of compression damage and storage duration on failure mechanical behavior and quality characteristics of harvested apples during storage, and the threshold of apple damage caused by compression, which was of great significance to guide the storage of apples, and could also provide a theoretical basis for studying the mechanism of mechanical damage of apples.
Material and sample preparation Apple (Fuji) as a fragile fruit can be easily damaged by extrusion. In this study, apples were taken as test material, which were harvested from a farm in Shaanxi (108.29°E, 35.36°N) in October 2020 to ensure that the apple had the same degree of ripeness. Six hundred apple samples were selected with regular shape, uniform size and physical integrity without visual defects, and immediately transported to the laboratory and refrigerated (5 ± 0.5 °C and 85 ± 5% relative humidity). According to the storage time, apple samples were divided into 5 groups at random with 90 fruits in each group. The remaining 60 apples were used for the determination of physical properties. Compression experiment was carried out by universal material testing machine and immediately transferred to the storage room for storage. Two flat insulating pressure plates were selected and apples were placed between the upper and lower pressure plates along the equator direction. Compression loading speed was set at 2 mm·s-1 (Zhang et al., 2018; Li, 2013). Compression forces were set to 0, 40, 80, 160, 320 and 640 N. After the compression test, the fruits were stored for 16 days (5 ± 0.5 °C and 85 ± 5% relative humidity), and the physical and chemical indexes were measured every 4 days.
Determination of fruit physical properties In the experiment of determining fruit physical properties, 60 apples were randomly divided into 5 groups. Each fruit was placed in a hollow cylinder on the table with its stem-calyx axis parallel to the table surface (Fig. 1). Subsequently, the apple was photographed from the top and side by a digital camera. In total, 100 photos were taken, and processed by a computer (Digimizer photograph analysis software, MedCalc Software, USA) to extract three significant dimensions: the longitudinal height L, large transverse diameter H1 and small transverse diameter H2 (Fig. 1). Finally, the geometric mean diameter GMD, sphericity Ø and surface area S were calculated by the relevant dimensions shown in equations (1)–(3) (An et al., 2020; Liu et al., 2020). The fresh mass m1 of each apple fruit was measured by a LP-1 electronic balance (Kunshan Liping Metering Equipment Co., Ltd., China) with an accuracy of 0.01 g. The density of apple was measured by the drainage method (Hussein et al., 2019). The results measured by the above method represent the consistency of apple fruit physical properties before the experiment to some extent.
 |
 |
 |

Loading-unloading test of apple fruit.
a. Top and side view of an apple fruit; b. Compression along the stem-calyx axis on the apple fruit longitudinal equatorial section.
where L is the longitudinal height of the fruit, cm; H1 is the large diameter of the fruit on its transverse equatorial section, cm; H2 is the small diameter of the fruit on its transverse equatorial section, cm; Ø is the sphericity of the fruit; S is the surface area of the fruit, cm2.
Determination of fruit damage volume Damage volume of apple fruit was determined using the equivalent substitution method as Opara and Fadiji (2018) with some modification. Because the fruit can be approximately regarded as a sphere, damage volume of the fruit can be equivalently substituted by referring to the sphere volume, as shown in Fig. 2. So, damage volume was calculated by:
 |

Damage volume of apple fruit.
where Va is the damage volume of the fruit, mm3; D is the diameter of damaged surface of the fruit, mm; Sa1 is the upper layer depth of damaged fruit, mm; Sa2 is the under-layer depth of damaged fruit, mm; Va1 is the volume on the damaged surface of fruit, mm3; Va2 is the volume under the damaged surface of fruit, mm3.
Physiological and biochemical response
Weight loss Cumulative change in fresh weight for apple fruit was determined with the method described by Fawole and Opara (2013) under each compression and storage time condition. For each storage condition, 15 fruits were randomly selected to monitor the quality changes. Weight loss was calculated by:
 |
where W is the weight loss of the fruit,%; W1 is the weight of the fruit at the beginning of storage, g; W2 is the weight of apple fruit at the storage, g.
Ethylene production and respiration rate Ethylene production and respiration rate of fruit with different compression damage were measured every 4 days by the closed system method as previously described by Jahanbakhshi et al. (2018) and Caleb et al. (2011). The sealed glass jars were equilibrated to the temperature and relative humidity of the experimental storage conditions. 5 sets of 3 apples per treatment were placed inside 4 L sealed glass jars, and then the Fruit and Vegetable Respirometer (JunFan, JFQ-3150H, China) was turned on until the numerical stability before reading. Ethylene production was measured by placing fruit in 4 L sealed glass jars covered with lid containing a rubber septum. After 2 hours, 1mL of gas per jar was extracted and the gas chromatography (7890B, Agilent, USA) with an accuracy of 0.5% was injected into the jar.
Firmness and browning degree Fruit firmness was measured at two-point around the equatorial section (undamaged area) of 15 apples for each removal of the skin using a Texture Analyzer (TA-XT Plus, Stable Micro Systems, Inc., Surrey, UK) with a P/2, 2 mm cylinder probe, which inserted 10 mm into each sample at a speed of 2 mm·s−1. The pre-test and post-test rates were 2 mm·s−1 and 10 mm·s−1, respectively. The peak force was recorded. Browning degree was measured by taking some apple pulps for beating and centrifugation (1006.2 G), then taking the supernatant to measure the absorbance (OD) at 420 nm (Tu et al., 2018). Value of OD × 10 was used to indicate the browning degree.
Titratable acidity (TA), total soluble solids (TSS) and TSS/TA ratio Titratable acidity (TA) and total soluble solids (TSS) from 6 damaged fruits (for each compression force) were determined. The 1cm thick flesh of the damaged site was taken for determination. After grinding and filtration, 10 g of apple pulp homogenate was transferred into a triangular flask with 30 mL distilled water. Then, the triangle bottle with homogenate was heated in a water bath at 80 °C for 30 min, cool and filter. 10 mL of the filtrate was taken with 0.1 mol·L1 NaOH to a slightly red color. Phenolphthalein was used as the indicator. Approximately 0.5 mL of the juice was used to measure TSS in a digital refractometer expressed as% (Atago, Tokyo, Japan). TSS/TA ratio was calculated.
Malondialdehyde (MDA) and cell membrane permeability The 1 cm thick flesh of the damaged site was taken for determination. MDA content was extracted according to Liu et al. (2019). 0.5 g of apple sample tissue was mixed with 0.5 mL of 30 mol·L−1 trichloroacetic acids thoroughly, then centrifuged at 3354 G for 10 min at 4 °C. MDA concentration was expressed as µmol·L−1 fresh weight. Then, the cell membrane permeability of the prepared apple slices (3 mm) was measured with a conductivity meter (Changzhou Ohaus, ST3100C, China), and the test method was referred to Lu et al. (2019).
Ascorbic acid, total phenolic and total flavonoids The 1cm thick flesh of the damaged site was taken for determination. The extraction and determination of ascorbic acid in apple fruit were based on the methods of Liu et al. (2015) and Shu et al. (2020). Total phenolic content was determined by the Folin-Ciocalteu (Folic-C.) colorimetric method (Fawole et al., 2012). The results were expressed as gallic acid equivalents, and the unit was mg/kg. The total flavonoids content was determined by aluminum chloride colorimetry, where rutin was used as standard substance, and the unit was mg/kg. The instrument is ultraviolet-visible spectrophotometer (Shanghai Yuan Xi, UV- 5500, China) (Bakar et al., 2009; Liu et al., 2002).
Pectin and soluble pectin The 1cm thick flesh of the damaged site was taken for determination. Pectin or soluble pectin extract (1 mL) was stirred with 6 mL concentrated sulfuric acid. After 20 min of heating in the water bath, the extract was added 0.2 mL carbazole-ethanol solutions (1.5 g/L), shaken well and placed in the dark for 30 mins (Khalid et al., 2018). The absorbance value was measured at 530 nm (Samina et al., 2018). The Pectin and soluble pectin were measured by Zhang et al. (2019) method, expressed as%. Pectin and soluble pectin were calculated by:
 |
Where P is pectin or soluble pectin content, %; C is galacturonic acid content, µg; V is the total volume of the sample extract; Vs is the volume of liquid extracted from the sample, mL; W is the weight of the sample, g.
Statistical analysis All experiments were carried out 3 biological repetitions with taking the sample, and 5 technical repetitions during the index determination. All results were expressed as the mean ± SE. All data were plotted with Origin 8.5. And IBM SPSS Statistics 26 software was used for statistical analysis (Compression test group compared to 0 N group) by Duncan's Multiple Range Test. The difference at p < 0.05 was considered significant.
Physical property Apples were divided before the compression test, and the basic physical parameters (Table 1) were determined, which could minimize the difference of quality between different fruit. Then it comes to carrying out compression test and storage. The geometric mean diameter, surface area, sphericity, density and fresh mass of apple fruit samples varied from 7.96 to 8.11 cm, 20.95 to 22.05 cm2, 0.92 to 0.94%, 0.91 to 0.92 g·cm−3 and 265.13 to 276.53 g, respectively. No difference in each physical parameter was found between the 6 groups according to ANOVA, and no report indicated the significant quality change in the test fruit (Zhou et al., 2016). The above results indicate that the original 6 fruit samples groups were well-balanced and did not bias the data obtained by the compression tests because of distinct apple fruit quality characteristics associated with each compression force and storage time test group. Hence, physical properties of apple fruit were consistent.
| Parameters | Different compression forces | |||||
|---|---|---|---|---|---|---|
| 0 N | 40 N | 80 N | 160 N | 320 N | 640 N | |
| GMD (cm) | 8.02 ± 0.35a | 7.96 ± 0.43a | 7.99 ± 0.52a | 8.03 ± 0.38a | 8.02 ± 0.41a | 8.11 ± 0.26a |
| S (cm2) | 21.25 ± 1.83a | 22.05 ± 1.32a | 20.95 ± 2.34a | 21.16 ± 2.13a | 21.53 ± 1.89a | 21.34 ± 1.66a |
| Ø (%) | 0.93 ± 0.01a | 0.93 ± 0.02a | 0.94 ± 0.02a | 0.93 ± 0.02a | 0.92 ± 0.01a | 0.93 ± 0.01a |
| ρ (g.cm-3) | 0.92±0.02a | 0.91 ± 0.01a | 0.92 ± 0.01a | 0.92 ± 0.01a | 0.91 ± 0.01a | 0.92 ± 0.02a |
| m (g) | 273.41 ± 10.51a | 265.13 ±1 4.21a | 270.96 ± 9.23a | 276.53 ± 17.11a | 269.34 ± 14.12a | 271.26 ± 8.26a |
All values are presented as mean ± SE. Means presented in the same row with different letters indicate significant differences between compression force group (p < 0.05). GMD, S, Ϙ, ρ, m shows geometric mean diameter, surface area, sphericity, density of apple fruit samples, respectively.
Failure mechanical behavior of whole apple Fig. 3a showed, 5 compression-force deformation curves in the uniaxial loading-unloading tests, which correspond to the deformation amount-force data of 5 apple samples compressed to a given compressibility level (included 40, 80, 160, 320, and 640 N). Each deformation amount-force curve includes a loading-unloading phase. Fig. 3c showed the browning tissues on the apple fruit vertical stem-calyx section. The browning tissues are obtained after the fruit samples are compressed to a given compression force. When the compression force is 0 to 40 N, the loading phase in each deformation amount-force curve is approximately linear (Fig. 3a). And there was no visible browning tissue structure in the longitudinal equatorial section of apple (Fig. 3c). Therefore, 40 N can be regarded as the elastic deformation limit of apple fruit along the compression direction of the equator. And an obvious infection point can be found in the loading phase of some deformation amount-force curves, which corresponds to the compression force of fruit samples, 80 ± 20 N. Before each inflection point, the loading phase in each deformation amount-force curve appeared is linear (Fig. 3a). Visible tissue browning starts to occur on the section of each fruit samples, and the size of the browning area also increases with compression force (Fig. 3c). Consequently, 40 to 80 N could be regarded as the local plastic deformation ranges of apple samples along the loading direction of the section. After reaching the inflection point, the compression no longer produces the static linear response of compression force. The loading force inclines with the increase of fruit deformation, and then increases slightly in the loading phase (Fig. 3a). At the same time, the browning degree of apple fruit slices increases rapidly with the increase of fruit loading force (Fig. 3c), thus indicating the presence of an internal structural fracture in the apple fruit sample from the inflection point. Hence, 80 N is regarded as the initial deformation amount of fruit samples having an internal structural failure when the apple fruit samples are compressed.

Compression deformation curve and damage of apple. The error bar represents standard error (SE) of the mean values ± S.E. of the 5 repetitions.
O is the start point of loading, M is the point of elastic deformation, N is the point of plastic deformation, P is the destruction point of organization structure, Q is the end point of unloading
The volume change curve of apple subjected to compression damage of different forces before storage, as shown in Fig. 3b. The average damage volume of apple fruit samples under 0, 40, 80, 160, 320, and 640 N is 0, 16.15, 303.87, 1711.55, 3065.15, and 7304.82 mm3, respectively. The damage volume also increases with high compression force, and fruit almost undamaged below 80 N, as is shown in Fig. 3c.
In sum, taking the deformation amount-force curve of apple fruit with a loading force of 640 N as an example, the loading phase OP includes 3 parts: OM-apple fruit elastic deformation, MN-apple fruit local plastic deformation, and NP-apple fruit structural failure. PQ corresponds to the unloading phase of the curve. At a given level of compression force, there is no difference in compression damage between the two sides of the loading contact surface from the point of view of the damaged area (Fig. 3c). However, during compression tests in 640 N, liquid may appear on the contact surface between the apple fruit and the probe after the completion of experiments. For 0 to 40 N compression, no apparent damage on the outer surface of apple fruit can be found after the compression test, but there was noticeable damage on the outer surface of the fruit for the others compression force. Thus, 40 N is the threshold value of apple compression damage. By comparing the deformation amount-force curve with the visible browning tissue of equatorial sections of apple fruit, the failure deformation and elastic deformation range of apple in the compression direction are obtained, which can provide an objective foundation for studying the mechanism of apple damage at the macro scale.
Fruit physiological and biochemical response
Ethylene production and respiration rate Apple is a typical respiration type fruit, and its fruit respiratory metabolism is closely related to the catabolism of various nutrients. Therefore, ethylene production and respiration rate reflect the life process of fruit and significant indexes for evaluating fruit quality and storage characteristics (Li et al., 2017). The changes in ethylene production and respiration rate of damaged fruit under different compression forces at different storage times are shown in Fig. 4. Both ethylene production and respiration rate are showed the trend of fluctuating up and down.

Effects of damaging and storage time on fruit ethylene production and respiration rate.
The error bar represents standard error (SE) of the mean values ± S.E. of the 5 repetitions. The symbol (*) shows significant differences according to the Duncan's Mu ltiple Range test (p < 0.05) for each time.
Ethylene production also increasing with the degree of damaged fruit during the same storage time (Fig. 4a). Damage promotes the release of ethylene and accelerated the ripening of apple fruit, which is not conducive to long-term storage. Similar results were reported by Cristina et al. (2021), who also observed ethylene production of apples after mechanical damage increasing. All the 6 experimental groups peaked of the ethylene release in 4 d, ranging from 15.36 to 26.35 mL·kg−1·h−1. Indentation on apple skin by compression accelerate ethylene production, which is the fruit response to mechanical stress. Thus, mechanical stress could result in more ethylene production and rapid ripening of apple samples, consequently degrading the apple quality.
Respiratory peaks occurred twice in all the six experimental groups from the 4 and 12 d, respectively (Fig. 4b). The respiratory rates (p < 0.05) of apple that is mechanically damaged in the early storage period increased significantly. When apple fruit is subjected to a compression force of 640 N, the change in ethylene production and respiration rate of the fruit is more pron. However, when the compression force is 0 and 40 N, the fruit's ethylene production and respiration rate are obviously unchanged compared with 640 N. The results showed that mechanical compression damage promotes the respiration strength of the fruit. Besides, the rise and decline of respiratory intensity is a self-protection process for organisms to improve their physiological activity and resist adversity (Yang et al., 2013).
Weight loss, firmness and browning degree The weight loss of different compression damage during the storage period, and the weight loss rate of six groups increases to varying degrees with the extension of storage time are shown in Fig. 5a. Fruits which are subjected to the compression forces of 0, 40, 80, 160, 320 and 640 N have weight loss rates of 0.6, 0.61, 0.68, 0.76, 0.89 and 1.2% in 16 d, respectively. Fruit weight loss rate increase with the damaged degree, presenting a linear upwards trend during the storage. The weight loss rate of damaged fruit increases fast during storage, which could be attributed to the damage accelerating water transpiration (Scherrer-Montero et al., 2011). Weight loss rates of fruit are similar under the compression forces of 0 and 40 N, which indicates that the compression force of 40 N doesn't cause fruit damage and has no effect on the weight loss rate. The weight loss rate of fruit which is subjected to the compression force of 640 N increases significantly from 12 to 16 d. The area of fruit damage in 16 d is greater than 12 d, where the damaged part of the fruit has affected the normal breathing of the fruit in the undamaged area, consequently experienced more weight loss as the storage time lasted.
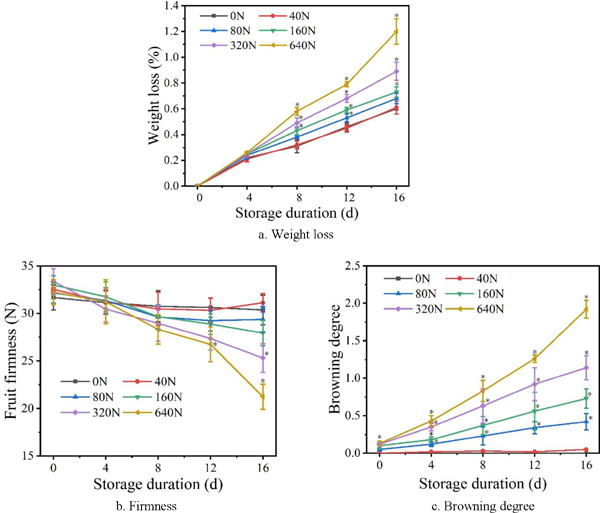
Effects of damaging and storage time on fruit weight, firmness and browning degree. The error bar represents standard error (SE) of the mean values ± S.E. of the 5 repetitions. The symbol (*) shows significant differences according to the Duncan's Multiple Range test (P < 0.05) for each time.
Firmness and browning degree are the significant physiological index to measure the shelf-life quality of apples. The firmness of damaged fruit showed a decreasing trend during the prolonged storage time, under the same storage conditions (Fig. 5b). The firmness of apple under a compression force of 0, 40, 80, 160, 320 and 640 N decreased by 4.13, 4.33, 8.73, 15.3, 24.18 and 34.15% in 16 d. The firmness of fruit compressed by 640 N rapidly reduces in the later storage period. The firmness of fruit with greater compression damage decreases faster with the same storage time, and the firmness of fruit with longer storage time decreases faster when the extent of the damage is consistent. Similar results were reported by Zhou et al. (2007), who observed that injury accelerates the softening speed of fruit and is not conducive to long-term storage.
The browning degree of the fruits in the six experimental groups is similar and about 0.1 at the 0 days (Fig. 5c). The browning degree of damaged fruit increases during the prolonged storage time, and the browning degree also increases with the degree of damage. There are also significant (p < 0.05) differences in browning among the 6 experimental groups, and the browning of the fruit directly affects the subsequent fresh-keeping and processing quality.
Titratable acidity (TA), total soluble solids (TSS) and TSS/TA ratio TA is affected by both compression force (p < 0.0001) and storage time (p < 0.0001). In the storage time of 4 days, the highest content of TA is found in damaged fruits under the compression forces of 640 N, which is 18.52% more than fruits under the compression forces of 0N. The increase in TA is due to mechanical damage causing metabolic disorders, affecting normal physiological and metabolic activities, loss of alternate respiratory pathways, and TA not being metabolized normally (Tang and Zhang, 2012). The TA of fruits under a compression force of 0, 40, 80, 160, 320 and 640 N decreases by 13.64, 12.77, 12.50, 10.00, 7.84 and 9.26% from the 4 d to 16 d (Table 2). The respiration of apple fruits during storage consumes organic acids which causes a decrease in TA (Monotero et al., 2009). The damaged apple has a smaller decrease in organic acids, because mechanical damage leads to abnormal metabolism, which reduce the consumption of organic acid. TSS is affected by both compression force (p < 0.0001) and storage time (p < 0.0001), as shown in Table 2. The decrease in TSS is the respiration of the fruit consumes sugar during storage, which is consistent with the view of Sanches et al. (2008). The TSS of fruit under a compression force of 0, 40, 80, 160, 320, and 640 N decreases by 9.60, 9.18, 8.43, 9.45, 10.82, and 11.04% from 4 to 16 d (Table 2). Apparently, the compression damage accelerates the decrease of TA and TSS contents in fruits. The TSS/TA ratio determines the taste of the fruit (Zarei et al., 2011).
| Chemical properties | Compression force (N) | Storage time (d) | ||||
|---|---|---|---|---|---|---|
| 0 | 4 | 8 | 12 | 16 | ||
| TA (%) | 0 | 0.65 ± 0.02 | 0.44 ± 0.03d | 0.41 ± 0.02d | 0.41 ± 0.04d | 0.38 ± 0.04d |
| 40 | 0.47 ± 0.01c | 0.44 ± 0.00c | 0.42 ± 0.03d | 0.41 ± 0.04cd | ||
| 80 | 0.48 ± 0.02bc | 0.45 ± 0.01c | 0.43 ± 0.01cd | 0.42 ± 0.04c | ||
| 160 | 0.50 ± 0.01bc | 0.47 ± 0.01b | 0.45 ± 0.01bc | 0.45 ± 0.05bc | ||
| 320 | 0.51 ± 0.04b | 0.48 ± 0.01b | 0.47 ± 0.02b | 0.47 ± 0.04ab | ||
| 640 | 0.54 ± 0.01a | 0.52 ± 0.00a | 0.50 ± 0.02a | 0.49 ± 0.01a | ||
| CV/% | 14.43 | 16.85 | 14.25 | 17.81 | ||
| TSS (%) | 0 | 15.21 ±1.03 | 14.26 ± 0.06a | 13.08 ± 0.42a | 13.02 ± 0.01a | 12.89 ± 0.24a |
| 40 | 14.05 ± 0.06ab | 13.02 ± 0.28ab | 12.91 ± 0.64a | 12.76 ± 0.13a | ||
| 80 | 13.88 ± 0.39bc | 12.97 ± 0.99ab | 12.76 ± 0.60ab | 12.71 ± 0.21a | ||
| 160 | 13.76 ± 0.25cd | 12.57 ± 0.21bc | 12.42 ± 0.16bc | 12.46 ± 0.48ab | ||
| 320 | 13.49 ± 0.53d | 12.13 ± 0.28cd | 12.01 ± 0.25cd | 12.03 ± 0.89bc | ||
| 640 | 13.13 ± 0.22e | 12.02 ± 0.28d | 11.79 ± 0.02d | 11.68 ± 0.47c | ||
| CV/% | 5.80 | 5.93 | 6.97 | 6.89 | ||
| TSS/TA | 0 | 23.75 ± 1.58 | 32.41 ± 0.74c | 31.90 ± 0.83c | 31.76 ± 1.07b | 33.92 ± 0.12c |
| 40 | 29.89 ± 2.20bc | 29.59 ± 1.34b | 30.74 ± 0.11ab | 31.12 ± 1.64bc | ||
| 80 | 28.92 ± 1.47bc | 28.82 ± 1.28b | 29.67 ± 2.13ab | 30.26 ± 3.98abc | ||
| 160 | 27.52 ± 0.86ab | 26.74 ± 0.35ab | 27.60 ± 0.12a | 27.69 ± 1.66ab | ||
| 320 | 26.45 ± 1.59ab | 25.27 ± 0.67ab | 25.55 ± 2.71a | 25.60 ± 0.51ab | ||
| 640 | 24.31 ± 2.15a | 23.12 ± 0.89a | 23.58 ± 3.11a | 23.84 ± 2.52a | ||
| CV/% | 9.10 | 9.95 | 6.77 | 11.72 | ||
| Level of significance | Compression force (A) | Storage time (B) | A × B | |||
| TA | < 0.0001 | < 0.0001 | 0.983 | |||
| TSS | < 0.0001 | < 0.0001 | 0.991 | |||
| TSS/TA | < 0.0001 | < 0.025 | 0.982 | |||
All values are presented as mean ± SE. Means presented in the same column with different letters indicates significant differences between impacts (p < 0.05). CV means the coefficient of variation.
In general, the contents of TA and TSS decrease with the extension of storage time under the same compression force. The TA increases with the increased compression force, and the TSS decreases with the increase of compression force under the same storage time. However, the TSS/TA ratio presents a trend of decrease. In this study, the storage time and compression force significantly affect TA, TSS and TSS/TA, but there is no significant interaction between the 2 factors (Table 2).
Cell membrane permeability and malondialdehyde (MDA) The cell membrane permeability of fruit cells could reflect the senescence degree of fruit, and the damage of the fruit cell membrane is manifested as the increase of cell membrane permeability (Li et al., 2017). MDA is one of the lipid peroxidations in the biofilm system, in which content could be reflected by the intensity of lipid peroxidation and the degree of membrane system damage (Erin and James, 2009). The cell membrane permeability and MDA (p < 0.05) content of fruit increase continuously during the prolonged storage time (Fig. 6). The degree of damaged fruit is positively correlated with cell membrane permeability and MDA content. After 16 d of storage, the relative conductance content of fruit increases by 32.21, 29.02, 29.57, 41.02, 43.50, and 55.94% when the compression force is 0, 40, 80, 160, 320, and 640 N, respectively. And the MDA content increases by 17.27, 17.59, 28.57, 31.81, 38.10, and 44.64%, respectively. Zeng et al. (2016) also indicated that damaged fruit speeded up the generation of cell membrane permeability and MDA content, which is consistent with our findings. The cell membrane permeability and MDA content are similar when fruit is compressed by 0 and 40 N, indicating that the fruit could not be damaged under the compressed force of 40N. In conclusion, it is necessary to reduce the extrusion force on the fruit to slow down the aging of apple fruit quality during the storage time.

Effects of damaging and storage time on fruit relative conductivity and malondialdehyde.
The error bar represents standard error (SE) of the mean values ± S.E. of the 5 repetitions. The symbol (*) shows significant differences according to the Duncan's Multiple Range test (p < 0.05) for each time.
Ascorbic acid, total phenolic and total flavonoids Ascorbic acid can resist the oxidation and delay senescence of fruit, but its content quickly lost by fruit oxidation. The content of ascorbic acid in damaged fruit decreased with the increase of storage time, and decreases more obviously with the growth of loading force (Fig. 7a). Similar results were reported by Tian et al. (2003), who observed the decrease of the content of ascorbic acid during the prolonged storage time under the same compression force. After 16 d of storage, the ascorbic acid content of fruit decreases by 23.63, 21.89, 25.42, 25.90, 32.31 and 38.53% when the compression forces are 0, 40, 80, 160, 320 and 640 N, respectively. The contents of ascorbic acid are decreased. On the one hand, the respiration of the fruit during storage consumes ascorbic acid. On the other hand, the damage will also accelerate the oxidative decomposition of ascorbic acid (Eline et al., 2020).

Effects of damaging and storage time on fruit ascorbic acid, total phenolic content and total flavonoids content. The error bar represents standard error (SE) of the mean values ± S.E. of the 5 repetitions. The symbol (*) shows significant differences according to the Duncan's Multiple Range test (p < 0.05) for each time.
Total phenolic and flavonoids in apple fruit have antioxidant activity, which delays many chronic diseases and lipid peroxidation process (Wang et al., 2015). Compression damage significant (p < 0.05) affects the total phenolic and flavonoids contents in fruit, which shows a similar variation trend, (Fig. 7b and Fig. 7c). However, the total phenolic content and total flavonoid content which is observed at the end of storage in fruit subjected to compression force of 0 or 40 N, is higher than that in fruit subjected to compression force of 80, 160, 320 and 640 N, and their content does not obvious change. At the end of 16 d storage, the total phenolic content of fruit decreases by 10.99, 11.11, 21.07, 29.54, 37.72 and 53.02% when the compression force is 0, 40, 80, 160, 320 and 640 N. And the total flavonoids content decreases by 1.67, 0.77, 4.74, 9.25, 17.57and 27.80%, respectively. Mechanical damage accelerates the contact of phenolic substances in the apple flesh with air and causes the activity of polyphenol oxidase and peroxidase to increase, which speeds up the oxidation and decomposition of total phenols and flavonoids (Martinez Romero et al., 2003). Overall, the damaged fruit significantly promoted the decrease of total phenolic and total flavonoids contents during storage time. However, this observation is in disagreement with Hussein et al. (2020), who observed that damaged pomegranate did not influence total phenolic content and total flavonoids content. In summary, damaged apple fruit by different compressions force promotes the decrease of total phenolic and total flavonoids, which is not conducive to the long-term storage.
Pectin and soluble pectin During the whole storage process, pectin and soluble pectin changed under 6 different compression forces, (Fig. 8). With the extension of storage time, pectin content decreased continuously (p < 0.05), soluble pectin content increased. On the 16 d, when the compression force is 0, 40, 80, 160, 320 and 640 N, the pectin content decreases by 8.04, 7.98, 12.06, 28.03, 45.28 and 54.21%, respectively, while the soluble pectin content increases by 30.16, 32.98, 50.19, 55.52, 59.64, and 65.27%, respectively. During storage, the contents of pectin and soluble pectin in the fruit treats by 40 and 0 N compression did not change significantly. There was no significant change in fruit firmness at the macro level. The results showed that high level of pectin and low level of soluble pectin (undamaged fruit) have sound effects on keeping the firmness, keeping flesh cells integrity and reducing fruit softening, which were similar to research of Ornelas-Paz et al. (2018).

Effects of damaging and storage time on fruit pectin and soluble pectin.
The error bar represents standard error (SE) of the mean values ± S.E. of the 5 repetitions. The symbol (*) shows significant differences according to the Duncan's Multiple Range test (p < 0.05) for each time.
In contrast, during storage, the contents of pectin and soluble pectin in the damaged apple fruits of the other four groups (80, 160, 320 and 640 N) changed significant (p < 0.05). Macroscopically, the fruit firmness changes obviously, and the peel wrinkles even slightly rot. These indicate that low pectin and high soluble pectin (damaged fruit) can cause softening and decay to fresh fruit, which is not conductive to long-term storage. Thus, apple fruit needs less compression during storage.
This study showed that throughout storage, damaged fruit caused by different compressive forces, can directly impact the quality attributes, and the compression damage thresholds can be determined. Our findings revealed that compressing the position of the fruit at the equator with different forces manifests itself in 3 different loading stages. The damage volume and visible browning area of apple cross-section under 0 and 40 N compression did not change significantly, which was the elastic deformation stage. However, damaged volume and visible browning area under compression forces of 80, 160, 320 and 640 N will dramatically change, which were the plastic deformation and structural failure. It indicated that the compression force of damage threshold of apple fruit at the equator was 40 N. Apple will not be damaged when the compression force is less than 40 N. The effect of squeeze damaging on the physicochemical properties is worth considering due to its potential to alter the taste of apple fruit. It is generally evident that subjecting apple fruit above 40 N compression could cause apple damage and negatively affect overall apple quality. Given the high squeezing damage rate during the current mechanized post-harvesting process (Picking, transportation, sorting and packaging), the compression force during the post-harvest treatment should be limited to less than 40 N to ensure the quality of apple fruit does not change during storage.
Acknowledgements This work was supported by the Natural fundamental research and development projects (Grant No. 2018YFD0700304).
Conflict of interest There are no conflicts of interest to declare.