Abstract
We studied whether the preference for taste solutions affects swallowing in voluntary movements. The five basic tastes comprise sweetness and umami, which are preferred tastes, saltiness, which is preferred or not preferred depending on the concentration, and sourness and bitterness, which are repellent tastes. Taste palatability and ease of deglutition were set as objective variables, and 14 myoelectric potential factors were considered as explanatory variables and applied to partial least squares regression-variable importance in projection (PLS-VIP) analysis. For all tastes, highly accurate prediction formulas were obtained, but the important factors were different for each taste. The relationships between palatability/ease of deglutition and the myoelectric potential parameters were different for each taste modality.
Introduction
Digestion begins in the oral cavity. The ingested food is chewed and mixed with saliva to form a bolus with an appropriate hardness and size for swallowing, then the bolus is sent to the esophagus via swallowing. Chewing and swallowing are complex movements in which various motor elements are continuously and simultaneously performed. The brain controls these functions, and the activities of various parts of the brain regions are involved in eating and swallowing (Onozuka et al., 2002; Malandraki et al., 2009). In addition, various types of sensory information from the oral cavity are recognized by the cerebrum, used for motor control, and stored in memory. Swallowing can be evoked both voluntarily and reflexively, and induction of the swallowing reflex involves input from the periphery of the pharynx and larynx, and input from the upper brain regions, such as the cerebrum (Ertekin, 2011). Hence, oral digestion is performed under a complicated neural control mechanism, and multiple sensory stimuli control its movements.
The ease of deglutition is comprehensively evaluated by quality characteristic and palatability based on information from the five senses, including gustation, vision, olfaction, hearing, and touch. The final decision on whether to ingest food occurs in the cerebrum. Of the five senses, taste information is important for the decision of ingesting food. First, taste information is sent from the taste buds on the tongue to the brain through the nerves associated with taste. The intensity and type of taste are recognized in the gustatory cortex. Subsequently, the signal from the cerebrum and various memories are integrated to evaluate the taste in the frontal association area. Simultaneously, the muscle activity for swallowing food is controlled, then the swallowing movement is induced (Araujo et al., 2003a, 2003b; Kern et al., 2001).
In this study, the relationships between taste and swallowing responses were examined by measuring the myoelectric potential of the submental muscle movement with voluntary swallowing and associating the sensory evaluations (palatability and ease of deglutition). If a predictive model for palatability and ease of deglutition can be constructed using surface electromyography (sEMG), it would be possible to associate voluntary biological responses with sensory evaluations. These trials would enable the construction of a novel evaluation category that assesses taste quality by using biological responses.
sEMG has been proposed as a screening method for patients with suspected dysphagia, because it is non-invasive, inexpensive, and free of radiation (Vaiman, 2007; Manda et al., 2019), and it has also been used to study swallowing-related muscles (Vasco et al., 2018; Agudelo et al., 2017). For example, sEMG is a more comfortable method for assessing symptoms of dysphagia after tooth extraction (Vaiman et al., 2006), and it is used to quantify the effects of swallowing movement on aging (Endo et al., 2020). It is convenient for detecting multiple muscle movements simultaneously, such as in the inferior orbicularis oris, submental muscle, and infrahyoid muscle by attaching the electrodes along these muscles (Ding et al., 2003). Furthermore, to examine the texture of foods, sEMG is sometimes used. In terms of taste, there have also been some reports using sEMG (Cazal et al., 2016; Kohyama et al., 2016; Morell et al., 2018; Mori et al., 2021; Reverend et al., 2016). Miura et al. (2009) also reported that changes in the response of the submental muscle to stimuli from taste solutions, carbonic acid, and cold temperature could be observed using sEMG.
In our previous study, we succeeded in quantifying the ease of deglutition of commercially available swallowing-adjusted foods using a myoelectric potential element (Kayanuma et al., 2016). In that paper, to choose representative foods for the analysis of ease of deglutition, texture-related words for swallowing-adjusted foods were first selected, then the representative foods for analysis were chosen from the viewpoint of texture. However, commercially available foods contain various factors other than taste, such as odor and texture, and it has not been clarified which factors primarily affect the ease of deglutition. Therefore, we first focused on taste and examined whether taste palatability and ease of deglutition of solutions of the five basic tastes (saltiness, sweetness, bitterness, sourness, and umami) could be evaluated using sEMG, and whether the relationship between palatability and ease of deglutition could be clarified through myoelectric potential factors.
Materials and Methods
Taste substances Regarding the measurement samples, we used a solution of each taste quality of the five basic tastes (saltiness, sweetness, bitterness, sourness, and umami). More specifically, we used: for saltiness, sodium chloride (Nihonshokuenseizo Co., Ltd.); for sweetness, granulated sugar (Mitsui Sugar Co., Ltd.); for bitterness, anhydrous caffeine (Agrochemi Co., Ltd.); for sourness, citric acid (Maruzen Pharmaceuticals Co., Ltd.); and for umami, monosodium glutamate (Maruzen Pharmaceuticals Co., Ltd.). These compounds are used for standard taste tests. Natural mineral water (hardness, 40.3; trade name, I Lohas; seller: Coca-Cola Co., Ltd.) was used as the solvent. The taste substances and solvents were prepared using foods and food additives instead of reagents, and safety was taken into consideration.
Participants All experiments were approved by the ethics committee of the University of Tokyo and Kagawa Nutrition University. Also, written informed consent was obtained from the participants for publishing this report. The target panel for the sensory evaluation of this experiment comprised 41 female students in their twenties from Kagawa Nutrition University. As it would be difficult to measure the surface myoelectric potential of all panelists, 17 to 20 panelists were randomly selected for each taste quality from the panel with cluster analysis. In addition, sensory evaluation for the preliminary experiment to set the concentration of the evaluation samples was conducted by eight persons in charge of food researchers (n = 8). All panelists were healthy subjects with no taste or oral disorders.
Sensory evaluation Preliminary evaluation for setting the sample solution concentrations
A preliminary evaluation was performed for each taste quality to set the concentration of each sample of the five basic tastes. The panelists in charge of food researchers (n = 8; 3 men in their twenties to forties, and 5 women in their twenties) evaluated each of the 9 levels of concentrations with reference to the cognitive and discrimination thresholds to tentatively set the like/dislike concentrations using a 9-point scale method. The panelists of this evaluation belonged to the University of Tokyo. For the surface myoelectric potential measurement in this experiment, the concentration of the samples was set using the range of the 9 levels (Supplemental Table 1) in 5 levels in consideration of the number of times that each panelist could be measured (Table 1).
Supplemental Table 1
Preliminary evaluation based on the solution concentration of each 9-level sample for 5 tastes
| Taste |
Common ratio |
Sample No & Concentration(%) |
| 1 |
2 |
3 |
4 |
5 |
6 |
7 |
8 |
9 |
| Saltness |
1.34 |
0.30 |
0.40 |
0.54 |
0.72 |
0.97 |
1.30 |
1.74 |
2.33 |
3.12 |
| Sweetness |
1.57 |
1.57 |
2.46 |
3.87 |
6.08 |
9.54 |
14.98 |
23.51 |
36.91 |
57.96 |
| Bitterness |
1.21 |
0.05 |
0.06 |
0.07 |
0.09 |
0.11 |
0.13 |
0.16 |
0.19 |
0.23 |
| Sourness |
1.45 |
0.13 |
0.19 |
0.27 |
0.39 |
0.57 |
0.82 |
1.19 |
1.73 |
2.51 |
| Umami |
1.33 |
0.10 |
0.13 |
0.18 |
0.24 |
0.31 |
0.42 |
0.55 |
0.74 |
0.98 |
Table 1.
Taste solutions.
| (%) |
| Taste |
Compound |
1 |
2 |
3 |
4 |
5 |
| Saltiness |
sodium chloride |
0.40 |
0.67 |
1.12 |
1.87 |
3.12 |
| Sweetness |
sucrose |
2.47 |
4.85 |
9.54 |
18.77 |
36.92 |
| Bitterness |
anhydrous caffeine |
0.05 |
0.07 |
0.11 |
0.16 |
0.23 |
| Sourness |
citric acid |
0.13 |
0.27 |
0.57 |
1.19 |
2.51 |
| Umami |
monosodium glutamate |
0.10 |
0.18 |
0.31 |
0.55 |
0.98 |
Each solute was dissolved in natural mineral water at the above ratio in room temperature.
Sensory evaluation method for the main experiment The number of evaluation samples was 25, including 5 levels of concentration solutions for saltiness, sweetness, bitterness, sourness, and umami. The evaluation items comprised the intensity of each concentration, taste preference, and degree of ease of deglutition, and we employed an absolute evaluation method with random independent presentation using a 9-point scale as follows: intensity, 1 (weak) to 9 (strong); preference, 1 (dislike) to 9 (like); and ease of deglutition, 1 (difficult to swallow) to 9 (easy to swallow). Each experimental sample (approximately 50 mL) was placed in a 90-mL plain white plastic cup and assigned a random three-digit code. The intake was left to the participants, and all experimental procedures were conducted at room temperature. The mouth was rinsed with a small amount of water between samples, and samples were evaluated at approximately 1-min intervals.
Electromyography measurement
Measuring equipment and methods P-EMG plus (Oisaka Electronics Equipment Ltd.) was used to measure the surface myoelectric potential. As the wet electrode, Blue Sensor M (Mets Co., Ltd.) was used, and the wet electrode was attached to the submental muscle for measurements. The measurement electrodes were attached along the submental muscle so that the distance between the two electrodes was 10 mm, and the reference electrodes were attached under the bones of the elbow joint opposite the dominant arm. Using this method, the myoelectric potential for 25 samples (7.5 mL each) was measured. Samples were assigned a random three-digit number and were presented randomly. In the sEMG measurements, 7.5 mL of each sample was placed in the mouth and swallowed at once. All participants in the experiment were instructed to swallow the entire solution at once. Swallowing was performed according to the instructions of the experimenter when the baseline of the EMG settled to a certain level. The sampling frequency was set to 3 kHz with reference to the experiment by Miura et al. (2009). The time series data analysis program MemCalc (GMS Co., Ltd.) was used for the frequency analysis of the sEMG.
Surface myoelectric potential parameters Fourteen sEMG measurement parameters were classified into three factors, i.e., a time factor, frequency factor, and quantitative factor (Fig. 1). The time factor corresponded to the duration and represented the time required for swallowing (Fig. 1B). The spectral density was calculated by dividing it into the following frequency bands: 0–0.2 Hz, 0.2–5 Hz, 5–10 Hz, 10–100 Hz, and 100–1500 Hz (Fig. 1C). The total spectral area was defined as the total area of the power spectrum density (PSD), the total area of 0.2–10 Hz segmented power / PSD was defined as the low frequency component ratio, and the total area of segmented power of 100 Hz or higher / PSD was defined as the high frequency component ratio. Quantitative factors included the minimum value, maximum value, Vp-p, total area of PSD, integrated EMG, and mean value. They were analyzed using the P-EMG built-in software. All EMGs were subjected to full-wave rectification (a method of expressing both positive and negative waveforms as absolute values by folding back at the reference line).

Data analysis Outliers were excluded using the outlier test of Jackknife Distances (α = 0.05) on the dataset including the sensory evaluation scores and myoelectric potential parameter values. The data analyses included cluster analysis, basic statistics, a partial least squares (PLS) regression analysis (stepwise-variable importance in projection (VIP)) method, predictive modeling, and preference mapping. JMP pro 15.02 (SAS Institute, Inc., Cary, NC, USA) was used as the statistical analysis software.
Selection of surface myoelectric potential panelists Hierarchical cluster analysis by Ward's method was applied with the panelists of each taste quality, sample concentration, intensity, and preference score as variables. In order to cover the overall preference pattern, the number of clusters was set by using the R-squared value indicating the explanation rate using the degree of explanation of preference as an index. By randomizing each cluster by generating random numbers, representative surface myoelectric potential panelists were extracted and selected (Supplemental Fig. 1).

Analysis of the relationship between sensory evaluation values and sEMG measurements The relationship between the psychological quantity of sensory evaluation and the physical quantity of surface myoelectric potential was logarithmically converted from the sEMG measurement values according to Weber-Fechner's law and used for the subsequent analysis. The stepwise PLS-VIP analysis method was applied to the explanatory variable selection to construct a prediction model with preference or ease of deglutition as the objective variable. The threshold was set at VIP > 0.8, which is recommended as the default for the usage statistics software JMP Pro 15 (SAS Institute Inc.) (Eriksson et al., 2006). Non-linear iterative PLS (NIPALS) and k-fold cross-validation were applied, and we searched for parameters that could accurately explain the objective variable. Sweetness with a zero optimal factor number was re-estimated without a verification method. To build a predictive model for each taste quality, PLS regression analysis was performed by narrowing down the parameters with the commonly used VIP > 1.0 as the threshold value (Chi-Hyuck et al., 2009; Mehmood et al., 2011; Chong and Jun, 2005; Toóth et al., 2019). The coefficient W was used as an indicator with a range of W ≤ −0.1 and W ≥ 0.1. The prediction accuracy of the prediction model regression equation was indexed by the multiple correlation coefficient (R2) and RMSE value (Morita et al., 2015; Wang et al., 2014; Wold, 1995; Wold et al., 2001). In order to compare the relation among the sensory evaluation values in the five basic tastes, the surface myoelectric potential parameter values, and the concentration values of each solution, a preference map was created by PLS regression analysis. For the analysis, three variables of preference, ease of deglutition, and intensity were applied as objective variables, and 14 variables of surface myoelectric potential parameters were applied as explanatory variables and standardized using the unverified NIPALS method to compare the five tastes.
Results and Discussion
Sensory Evaluation The mean value and standard deviation (SD) of the sensory evaluation intensity for each taste concentration are shown in Fig. 2. Saltiness palatability was the highest in sample 2 (0.67%), then as the concentration increased, the palatability decreased. Conversely, the ease of deglutition was the highest in sample 1 (0.40%), then as the concentration increased, the ease of deglutition decreased. For sweetness, the sensory evaluation values were high at the concentrations of sample 2 (4.85%) and sample 3 (9.54%) for both palatability and ease of deglutition, and they showed similar patterns. For bitterness, the evaluation value of palatability was lower than that of the other tastes, and the evaluation value of sample 1 (0.05%) was high for both palatability and ease of deglutition. Similar to bitterness, sourness was also highly evaluated in sample 1 (0.13%) in terms of both palatability and ease of deglutition. Regarding umami, the evaluation value for palatability increased slightly as the concentration increased, but no significant difference was seen among samples. The ease of deglutition did not depend on the concentration and fluctuated little, showing a unique pattern.

The taste intensity increased with the concentration, which was common to all tastes. This indicated that the panelists could properly recognize the difference in the concentration of each taste solution (Fig. 2C).
sEMG measurement The mean values and standard errors (SE) of the 14 sEMG parameters of the five concentrations for the five basic tastes are shown in Table 2. These data were used for the explanatory variables to perform PLS regression analysis. Of the five basic tastes, a concentration dependency was observed for bitterness with duration. In terms of the quantitative factors, the maximum value, Vp-p, integrated EMG, and mean value tended to increase with increasing concentration of the salty taste. For sweetness, the maximum value tended to decrease as the concentration increased. No association between the quantitative factors and concentrations was found for the other tastes. In terms of the frequency factors, the low frequency component and high frequency component tended to fluctuate in response to changes in the concentration of the salty taste, but no significant difference in frequency distribution due to differences in taste was detected. Parameters that were significantly different were a frequency of 0–0.2 Hz for sourness and a frequency of 0.2–5 Hz for saltiness (Table 2).
Table 2.
Surface myoelectric potential measurement
| Taste (Compound) |
sample |
(%) |
Duration (second) |
Frequency between 0 and 0.2 Hz (µV2/Hz) |
Frequency between 0.2 and 5 Hz (µV2/Hz) |
| average |
SE |
average |
SE |
average |
SE |
Saltiness
(sodium chloride) |
s1 |
0.40 |
1.05 |
0.0698 |
9.95.E-05 |
1.68.E-05 |
3.44.E-03(a) |
7.08.E-04 |
| s2 |
0.67 |
1.16 |
0.0706 |
1.11.E-04 |
1.44.E-05 |
7.68.E-03 |
2.55.E-03 |
| s3 |
1.12 |
1.10 |
0.0438 |
9.95.E-05 |
1.48.E-05 |
7.30.E-03 |
1.66.E-03 |
| s4 |
1.87 |
1.11 |
0.0551 |
1.03.E-04 |
1.71.E-05 |
7.01.E-03 |
1.70.E-03 |
| s5 |
3.12 |
1.17 |
0.0600 |
9.81.E-05 |
1.98.E-05 |
1.15.E-02(b) |
2.78.E-03 |
Sweetness
(sucrose) |
w1 |
2.47 |
0.987 |
0.0432 |
1.16.E-04 |
1.73.E-05 |
3.12.E-03 |
8.96.E-04 |
| w2 |
4.85 |
1.01 |
0.0482 |
1.16.E-04 |
1.34.E-05 |
2.68.E-03 |
5.73.E-04 |
| w3 |
9.54 |
1.08 |
0.0643 |
1.12.E-04 |
1.44.E-05 |
4.21.E-03 |
1.26.E-03 |
| w4 |
18.77 |
0.954 |
0.0700 |
9.35.E-05 |
1.65.E-05 |
2.60.E-03 |
7.06.E-04 |
| w5 |
36.92 |
1.05 |
0.0647 |
1.45.E-04 |
1.38.E-05 |
2.64.E-03 |
6.25.E-04 |
Bitterness
(anhydrous caffeine) |
b1 |
0.05 |
1.04 |
0.0597 |
1.23.E-04 |
1.43.E-05 |
2.09.E-03 |
5.15.E-04 |
| b2 |
0.07 |
1.09 |
0.0499 |
1.28.E-04 |
1.65.E-05 |
4.73.E-03 |
3.31.E-03 |
| b3 |
0.11 |
1.11 |
0.0649 |
1.38.E-04 |
1.75.E-05 |
2.16.E-03 |
4.11.E-04 |
| b4 |
0.16 |
1.15 |
0.0745 |
1.31.E-04 |
1.18.E-05 |
1.88.E-03 |
3.76.E-04 |
| b5 |
0.23 |
1.22 |
0.0689 |
1.24.E-04 |
1.29.E-05 |
2.50.E-03 |
8.82.E-04 |
Sourness
(citric acid) |
o1 |
0.13 |
1.06 |
0.0564 |
1.37.E-04(a) |
1.42.E-05 |
2.83.E-03 |
7.93.E-04 |
| o2 |
0.27 |
1.07 |
0.0538 |
1.63.E-04(a) |
2.58.E-05 |
2.58.E-03 |
6.40.E-04 |
| o3 |
0.57 |
1.09 |
0.0884 |
1.16.E-04 |
1.50.E-05 |
2.92.E-03 |
5.73.E-04 |
| o4 |
1.19 |
1.06 |
0.0408 |
1.06.E-04 |
1.32.E-05 |
4.28.E-03 |
8.98.E-04 |
| o5 |
2.51 |
1.23 |
0.0814 |
6.93.E-05(b) |
1.50.E-05 |
5.24.E-03 |
1.57.E-03 |
Umami
(monosodium glutamate) |
u1 |
0.10 |
0.972 |
0.0426 |
1.22.E-04 |
1.72.E-05 |
5.99.E-03 |
3.67.E-03 |
| u2 |
0.18 |
1.10 |
0.0538 |
1.07.E-04 |
1.66.E-05 |
4.46.E-03 |
1.89.E-03 |
| u3 |
0.31 |
0.939 |
0.0375 |
1.09.E-04 |
1.74.E-05 |
6.46.E-03 |
3.34.E-03 |
| u4 |
0.55 |
1.06 |
0.0438 |
1.32.E-04 |
1.44.E-05 |
6.87.E-03 |
3.19.E-03 |
| u5 |
0.98 |
1.03 |
0.0505 |
1.21.E-04 |
1.65.E-05 |
7.01.E-03 |
4.72.E-03 |
| Taste (Compound) |
sample |
(%) |
Frequency between 5 and 10 Hz (µV2/Hz) |
Frequency between 10 and 100 Hz (µV2/Hz) |
Frequency between 100 and 1515 Hz (µV2/Hz) |
| average |
SE |
average |
SE |
average |
SE |
Saltiness
(sodium chloride) |
s1 |
0.40 |
1.49.E-03 |
4.16.E-04 |
1.82.E-02 |
2.21.E-03 |
1.67.E-02 |
2.65.E-03 |
| s2 |
0.67 |
1.43.E-03 |
3.26.E-04 |
1.90.E-02 |
2.38.E-03 |
1.48.E-02 |
1.99.E-03 |
| s3 |
1.12 |
1.49.E-03 |
2.47.E-04 |
2.06.E-02 |
2.63.E-03 |
1.50.E-02 |
2.19.E-03 |
| s4 |
1.87 |
3.16.E-03 |
1.21.E-03 |
2.75.E-02 |
6.25.E-03 |
1.74.E-02 |
2.71.E-03 |
| s5 |
3.12 |
3.12.E-03 |
9.00.E-04 |
2.25.E-02 |
2.57.E-03 |
1.70.E-02 |
1.76.E-03 |
| Sweetness (sucrose) |
w1 |
2.47 |
1.19.E-03 |
2.52.E-04 |
1.79.E-02 |
2.65.E-03 |
1.38.E-02 |
2.10.E-03 |
| w2 |
4.85 |
8.38.E-04 |
1.48.E-04 |
1.94.E-02 |
4.24.E-03 |
1.45.E-02 |
2.40.E-03 |
| w3 |
9.54 |
1.17.E-03 |
2.26.E-04 |
2.03.E-02 |
4.72.E-03 |
1.45.E-02 |
2.41.E-03 |
| w4 |
18.77 |
1.16.E-03 |
2.77.E-04 |
1.94.E-02 |
4.69.E-03 |
1.39.E-02 |
2.47.E-03 |
| w5 |
36.92 |
8.94.E-04 |
2.01.E-04 |
1.97.E-02 |
3.99.E-03 |
1.29.E-02 |
1.82.E-03 |
| Bitterness (anhydrous caffeine) |
b1 |
0.05 |
1.24.E-03 |
2.28.E-04 |
1.90.E-02 |
3.22.E-03 |
1.62.E-02 |
2.49.E-03 |
| b2 |
0.07 |
1.00.E-03 |
1.84.E-04 |
2.19.E-02 |
3.86.E-03 |
1.33.E-02 |
1.66.E-03 |
| b3 |
0.11 |
1.02.E-03 |
2.59.E-04 |
1.50.E-02 |
1.40.E-03 |
1.21.E-02 |
1.48.E-03 |
| b4 |
0.16 |
1.31.E-03 |
2.81.E-04 |
1.74.E-02 |
2.45.E-03 |
1.57.E-02 |
3.04.E-03 |
| b5 |
0.23 |
1.15.E-03 |
1.93.E-04 |
1.74.E-02 |
2.20.E-03 |
1.51.E-02 |
2.67.E-03 |
Sourness
(citric acid) |
o1 |
0.13 |
8.38.E-04 |
1.12.E-04 |
2.60.E-02 |
5.90.E-03 |
1.73.E-02 |
2.55.E-03 |
| o2 |
0.27 |
9.98.E-04 |
2.13.E-04 |
1.96.E-02 |
3.01.E-03 |
1.62.E-02 |
2.41.E-03 |
| o3 |
0.57 |
9.28.E-04 |
1.59.E-04 |
2.82.E-02 |
4.28.E-03 |
2.06.E-02 |
4.15.E-03 |
| o4 |
1.19 |
1.42.E-03 |
2.32.E-04 |
3.24.E-02 |
6.02.E-03 |
1.96.E-02 |
2.49.E-03 |
| o5 |
2.51 |
1.51.E-03 |
2.99.E-04 |
2.65.E-02 |
4.51.E-03 |
1.78.E-02 |
2.81.E-03 |
Umami
(monosodium glutamate) |
u1 |
0.10 |
9.76.E-04 |
2.66.E-04 |
2.28.E-02 |
4.38.E-03 |
1.52.E-02 |
2.17.E-03 |
| u2 |
0.1 |
81.21.E-03 |
2.02.E-04 |
2.30.E-02 |
4.84.E-03 |
1.47.E-02 |
2.19.E-03 |
| u3 |
0.31 |
1.33.E-03 |
2.41.E-04 |
2.57.E-02 |
6.09.E-03 |
1.65.E-02 |
2.96.E-03 |
| u4 |
0.55 |
1.33.E-03 |
2.12.E-04 |
2.12.E-02 |
3.44.E-03 |
1.37.E-02 |
2.19.E-03 |
| u5 |
0.98 |
1.81.E-03 |
4.91.E-04 |
1.55.E-02 |
2.11.E-03 |
1.16.E-02 |
1.62.E-03 |
| Taste (Compound) |
sample |
(%) |
Low-frequency component |
High-frequency component |
Minimum value (mV) |
Miximum value (mV) |
| average |
SE |
average |
SE |
average |
SE |
average |
SE |
Saltiness
(sodium chloride) |
s1 |
0.40 |
0.127 |
0.0173 |
0.403 |
0.0179 |
0.194 |
0.0145 |
1.01 |
0.0733 |
| s2 |
0.67 |
0.185 |
0.0336 |
0.356 |
0.0279 |
0.197 |
0.0202 |
1.06 |
0.0790 |
| s3 |
1.12 |
0.198 |
0.0282 |
0.340 |
0.0283 |
0.218 |
0.0186 |
1.12 |
0.0836 |
| s4 |
1.87 |
0.190 |
0.0276 |
0.337 |
0.0244 |
0.229 |
0.0206 |
1.25 |
0.1127 |
| s5 |
3.12 |
0.247 |
0.0377 |
0.330 |
00254 |
0.210 |
0.0186 |
1.32 |
0.0843 |
Sweetness
(sucrose) |
w1 |
2.47 |
0.123 |
0.0305 |
0.377 |
0.0314 |
0.207 |
0.0142 |
1.03 |
0.0886 |
| w2 |
4.85 |
0.114 |
0.0243 |
0.383 |
0.0268 |
0.198 |
0.0129 |
1.02 |
0.0993 |
| w3 |
9.54 |
0.136 |
0.0263 |
0.371 |
0.0285 |
0.183 |
0.0119 |
1.00 |
0.0874 |
| w4 |
18.77 |
0.110 |
0.0209 |
0.381 |
0.0273 |
0.199 |
0.0139 |
0.945 |
0.0907 |
| w5 |
36.92 |
0.110 |
0.0258 |
0.372 |
0.0220 |
0.192 |
0.0105 |
0.943 |
0.0913 |
Bitterness
(anhydrous caffeine) |
b1 |
0.05 |
0.0906 |
0.0148 |
0.413 |
0.0227 |
0.196 |
0.0147 |
0.962 |
0.0690 |
| b2 |
0.07 |
0.100 |
0.0288 |
0.358 |
0.0263 |
0.199 |
0.0194 |
1.01 |
0.0982 |
| b3 |
0.11 |
0.101 |
0.0149 |
0.390 |
0.0205 |
0.186 |
0.0141 |
0.877 |
0.0367 |
| b4 |
0.16 |
0.0870 |
0.00946 |
0.414 |
0.0208 |
0.177 |
0.0129 |
0.923 |
0.0740 |
| b5 |
0.23 |
0.0943 |
0.0151 |
0.400 |
0.0247 |
0.193 |
00178 |
1.00 |
0.0610 |
Sourness
(citric acid) |
o1 |
0.13 |
0.0792 |
0.0157 |
0.397 |
0.0325 |
0.205 |
0.0136 |
1.08 |
0.1033 |
| o2 |
0.27 |
0.0940 |
0.0172 |
0.413 |
0.0303 |
0.219 |
0.0157 |
1.00 |
0.0685 |
| o3 |
0.57 |
0.0847 |
00131 |
0.389 |
0.0241 |
0.231 |
0.0172 |
1.14 |
0.0861 |
| o4 |
1.19 |
0.104 |
0.0136 |
0.372 |
0.0243 |
0.208 |
0.0138 |
1.21 |
0.1034 |
| o5 |
2.51 |
0.125 |
0.0175 |
0.366 |
0.0220 |
0.203 |
0.0149 |
1.19 |
0.1018 |
Umami
(monosodium glutamate) |
u1 |
0.10 |
0.128 |
0.0409 |
0.374 |
0.0310 |
0.204 |
0.0180 |
1.11 |
0.0997 |
| u2 |
0.18 |
0.138 |
0.0344 |
0.358 |
0.0281 |
0.189 |
0.0150 |
1.09 |
0.0954 |
| u3 |
0.31 |
0.153 |
0.0383 |
0.355 |
0.0279 |
0.215 |
0.0176 |
1.10 |
0.1135 |
| u4 |
0.55 |
0.180 |
0.0426 |
0.334 |
0.0286 |
0.207 |
0.0176 |
1.12 |
0.1013 |
| u5 |
0.98 |
0.182 |
0.0501 |
0.359 |
0.0346 |
0.196 |
0.0236 |
1.01 |
0.0995 |
| Taste (Compound) |
sample |
(%) |
Vp-p (mV) |
PSD (µV2/Hz) |
Integrated EMG (mV · s) |
Mean value (mV/s) |
| average |
SE |
average |
SE |
average |
SE |
average |
SE |
Saltiness
(sodium chloride) |
s1 |
0.40 |
0.819 |
0.0758 |
0.0399 |
0.00533 |
1778 |
147 |
0.567 |
0.0365 |
| s2 |
0.67 |
0.863 |
0.0735 |
0.0430 |
0.00544 |
2062 |
202 |
0.588 |
0.0374 |
| s3 |
1.12 |
0.899 |
0.0843 |
0.0446 |
0.00533 |
2029 |
149 |
0.602 |
0.0313 |
| s4 |
1.87 |
1.03 |
0.108 |
0.0552 |
0.0102 |
2128 |
190 |
0.640 |
0.0524 |
| s5 |
3.12 |
1.11 |
0.0800 |
0.0541 |
0.00559 |
2300 |
152 |
0.659 |
0.0369 |
Sweetness
(sucrose) |
w1 |
2.47 |
0.827 |
0.0883 |
0.0361 |
0.00413 |
1629 |
115 |
0.543 |
0.0273 |
| w2 |
4.85 |
0.820 |
0.101 |
0.0376 |
0.00605 |
1681 |
160 |
0.539 |
0.0313 |
| w3 |
9.54 |
0.820 |
0.0869 |
0.0403 |
0.00748 |
1821 |
194 |
0.552 |
0.0396 |
| w4 |
18.77 |
0.746 |
0.0870 |
0.0372 |
0.00733 |
1549 |
183 |
0.530 |
0.0400 |
| w5 |
36.92 |
0.751 |
0.0923 |
0.0363 |
0.00582 |
1758 |
207 |
0.534 |
0.0342 |
Bitterness
(anhydrous caffeine) |
b1 |
005 |
0.766 |
0.0682 |
0.0387 |
0.00545 |
1770 |
154 |
0.559 |
0.0305 |
| b2 |
0.07 |
0.814 |
0.0874 |
0.0411 |
0.00692 |
1870 |
175 |
0.564 |
0.0408 |
| b3 |
0.11 |
0.691 |
0.0376 |
0.0304 |
0.00295 |
1663 |
83 |
0.508 |
0.0255 |
| b4 |
0.16 |
0.747 |
0.0735 |
0.0364 |
0.00554 |
1805 |
135 |
0.530 |
0.0329 |
| b5 |
0.23 |
0.811 |
0.0544 |
0.0363 |
0.00506 |
1952 |
139 |
0.538 |
0.0339 |
Sourness
(citric acid) |
o1 |
0.13 |
0.874 |
0.0969 |
0.0471 |
0.00838 |
1936 |
188 |
0.597 |
0.0437 |
| o2 |
0.27 |
0.781 |
0.0600 |
0.0396 |
0.00503 |
1878 |
183 |
0.569 |
0.0347 |
| o3 |
0.57 |
0.913 |
0.0792 |
0.0528 |
0.00794 |
2123 |
218 |
0.636 |
0.0410 |
| 04 |
1.19 |
1.00 |
0.0960 |
0.0577 |
0.00846 |
2111 |
178 |
0.657 |
0.0465 |
| o5 |
2.51 |
0.984 |
0.101 |
0.0512 |
0.00755 |
2276 |
190 |
0.622 |
0.0396 |
Umami
(monosodium glutamate) |
u1 |
0.10 |
0.905 |
0.0955 |
0.0451 |
0.00705 |
1753 |
160 |
0.593 |
0.0453 |
| u2 |
0.18 |
0.903 |
0.0953 |
0.0434 |
0.00699 |
1918 |
175 |
0.574 |
0.0380 |
| u3 |
0.31 |
0.886 |
0.105 |
0.0501 |
0.00949 |
1784 |
206 |
0.615 |
0.0510 |
| u4 |
0.55 |
0.915 |
0.0972 |
0.0432 |
0.00602 |
1869 |
158 |
0.583 |
0.0389 |
| u5 |
0.98 |
0.815 |
0.0933 |
0.0360 |
0.00609 |
1633 |
121 |
0.532 |
0.0448 |
Multiple comparisons of the concentration solutions for each taste were performed by the Steel-Dwass test. Yellow boxes show significantly different values with p < 0.05. The number of subjects was sweetness N = 19, bitterness N = 20, saltiness N = 18, acidity N = 19, and umami N = 17. Sample names and concentrations correspond to Table 1 and Fig. 2.
Relationship between the sensory evaluation values and myoelectric potential parameters The objective variable for each taste was set to palatability or ease of deglutition; the explanatory variable was set to the 14 sEMG measurement parameters, and the stepwise PLS-VIP method was applied for each taste. After repeating variable selection of important factors with a variable VIP > 0.8 as the threshold, a prediction model was constructed using the parameters with a VIP > 1.0 at the final stage. VIP is an indicator of the importance of explanatory variables in modeling. Figure 3 shows the VIP of the importance of the parameters for each taste, and the coefficient W shows the direction and contribution.
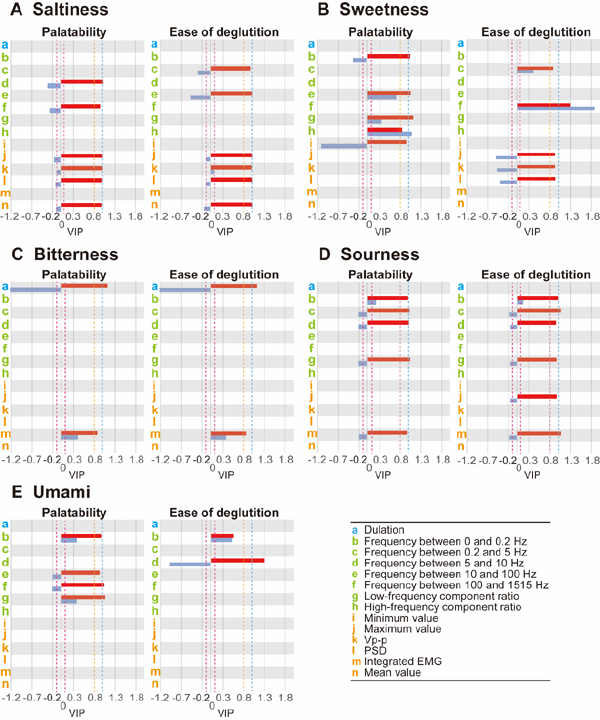
Regarding the factors that contribute to the prediction of palatability and ease of deglutition by PLS-VIP using the myoelectric potential factor, some specific information was obtained. For saltiness, frequency and quantitative factors were commonly selected as important factors for both palatability and ease of deglutition (Fig. 3A). Conversely, the contribution coefficient W of the individual frequency band differed between palatability and ease of deglutition. Regarding sweetness, a quantitative factor was involved in palatability, and a frequency factor was involved in ease of deglutition (Fig. 3B). Bitterness was explained by duration for both palatability and ease of deglutition. This appeared to have a negative effect due to the long duration of the stimulus, and it represents the “backtracking” phenomenon of bitter taste expression (Fig. 3C). As for sourness, the prediction of ease of deglutition was affected by the maximum value of the quantitative factor, which is an index of muscle contraction, although that of palatability was not affected (Fig. 3D). Regarding umami, frequency factors appeared to be greatly involved in both palatability and ease of deglutition, but the frequency bands were different (Fig. 3E). The prediction formulas of palatability and ease of deglutition were constructed using a VIP > 1.0 and coefficient W ≤ −0.1 and W ≥ 0.1. For each taste, R2 was high and RMSE was low, indicating highly accurate prediction (Table 3).
Table 3.
Accuracy of predicting formula constructed by VIP < 1.0, W ≦ −0.1and W ≧ 0.1.
| Taste |
Saltiness |
Sweetness |
Bitterness |
Sourness |
Umami |
| Palatability |
R2 |
0.99 |
0.91 |
0.86 |
0.97 |
0.95 |
| RMSE |
0.04 |
0.19 |
0.28 |
0.17 |
0.09 |
| Ease of deglutition |
R2 |
0.98 |
0.90 |
0.89 |
0.84 |
0.85 |
| RMSE |
0.17 |
0.23 |
0.24 |
0.51 |
0.05 |
The accuracy of each prediction formula was determined by R2 and RMSE based on the linear relation between the measured and predicted values of the sample concentration. Each numerical value is described up to the last two digits.
Preference maps for the five basic tastes constructed with PLS regression From the PLS regression analysis with palatability, ease of deglutition, and intensity as the objective variables (Y) and 14 myoelectric potential parameters as the explanatory variables (X), a load amount correlation diagram (i.e., a preference map) was obtained by superimposing the X load and Y load for each taste. As a result, the correlation between X-variables, Y-variables, and variables for each taste can be visualized on the coordinates, and the similarities and differences in each variable between each of the tastes can be visually compared (Fig. 4). The preference maps for saltiness and sourness indicated that palatability and ease of deglutition had a highly positive correlation, and were correlated with the frequency factor. There was a highly negative correlation with intensity. The low frequency component ratio, which is an index of fast muscle movement, was found to have a different correlation from the other three tastes (sweetness, umami, and bitterness). This may indicate a difference in the muscles used during swallowing for each taste. Similarity between the saltiness and sourness preference maps was also seen with the sensory evaluation (Fig. 2), suggesting that the sensory evaluation results could be predicted from the surface myoelectric potential value. In the sweetness preference map, preference and ease of deglutition had a positive correlation, and ease of deglutition had a highly positive correlation in the frequency band of 100–1500 Hz. Sweetness, saltiness, and sourness were similar in that they were correlated with frequency factors, but their frequency bands differed. The results of the sensory evaluation of sweetness indicated that in comparison to saltiness and sourness, sweetness does not become biased toward the repellent side even when the concentration is changed. In this way, it was suggested that the difference in sensory evaluation could be explained using sEMG measurements. In the bitterness preference map, there was a highly positive correlation between palatability and ease of deglutition, and the positions of these two parameters on the preference map were almost the same. In addition, an inverse correlation between palatability/ease of deglutition and duration was found. Regarding bitterness, the palatability and ease of deglutition predicted by sEMG parameters were almost the same with duration. A study by Leow et al. using gelatin samples to measure the sEMG of the submental muscle showed that the duration of swallowing a bitter sample was longer than the duration of swallowing a sweet, salty, or sour sample (Leow et al., 2007). In their study, the duration increased as the concentration increased. In addition, they used quinine as the solute for bitterness, but the time required for swallowing a quinine sample should be similar to that required for swallowing caffeine, which was used in this study. Bitterness is a taste that induces a repellent reaction at all concentrations, and it is different from other taste qualities in this respect. With umami, the correlation between palatability and ease of deglutition was low, and it was in the opposite position on the factor-1 axis. From this result, it is considered that umami is the only taste among the five tastes that differs in terms of the palatability and ease of deglutition. This is because palatability increased as the concentration of umami increased, but the ease of deglutition did not change significantly in the sensory evaluation.

As noted, the relationship between palatability/ease of deglutition and myoelectric potential parameters was different for each taste quality. Moreover, by measuring the myoelectric potential during swallowing, it was clarified that swallowing may not be easy even when the degree of preference is high.
In this study, taste palatability and ease of deglutition could be accurately predicted from the myoelectric potential parameters for all tastes. The myoelectric potential elements used as explanatory variables comprised time, frequency, and quantitative factors. The time factor is the time required for swallowing, and the quantitative factor is an index of muscle contraction. Regarding frequency factors, the frequency component ratio changes depending on the muscle fibers of skeletal muscles, which include fast and slow muscles. Fast muscles consist of muscle fibers with a small diameter and are susceptible to fatigue, and slow muscles consist of muscle fibers with a large diameter and are less susceptible to fatigue. In addition, it is known that fast muscles are involved in the increase of low frequency factors in myoelectric potential measurements, and conversely, when slow muscles are active, high frequency factors increase (Tscharner et al., 2003; Wakeling et al., 2002). Both fast and slow muscles are involved in the operation of all muscles in the body, including swallowing (Burkhead et al., 2007; Kent, 2004). On the other hand, there have been many papers showing that a frequency change is related to fatigue (Hägg, 1992; Jero and Ramakrishnan, 2019; Palla and Ash, 1981; Rochester, 1985; Ward and Robertson, 2000), but the physiological relationship between taste and sEMG data of the submental muscle during swallowing has not been clarified.
Conclusion
This is the first report that palatability and ease of deglutition could be determined by sEMG measurements of the submental muscle. We succeeded in quantifying specific myoelectric potential parameters related to ease of deglutition and palatability, which were not understood by sensory evaluation. The correlation between these myoelectric potential parameters and the sensory evaluation values was analyzed using partial least squares regression analysis. By modeling the taste palatability and ease of deglutition for the five basic tastes with myoelectric potential factors, we found that there were no simple relations between them, e.g., we cannot say simply that preferred tastes are easy to swallow or that repellent ones are not from the physiological response. In the future, sensory evaluations using other biological response factors, such as electroencephalography, is expected to provide new insights on food selection for ingestion.
Funding This work was supported by the Cross-ministerial Strategic Innovation Promotion Program [grant number 14532924; K.A.]; a Grant-in-Aid for Scientific Research B from the Society for the Promotion of Science in Japan [grant number 19300248; T.A.]; and the Adaptable and Seamless Technology Transfer Program Through Target-driven R&D (A-STEP) from the Japan Science and Technology Agency [grant number JPMJTR194F; T.A.].
Conflict of interest There are no conflicts of interest to declare.
References
- Agudelo, S.R., Vasco, S.R., Arbelaez, L.R., Arboleda, S.C., Giraldo, E.P., and Duque, A.O. (2017). Improving surface EMG burst detection in infrahyoid muscles during swallowing using digital filters and discrete wavelet analysis. J Electromyogr. Kinesiol., 35, 1-8.
- Araujo, I.E., Kringelbach, M.L., Rolls, E.T., and McGlone, F. (2003a). Human cortical responses to water in the mouth, and the effects of thirst. J. Neurophysiol., 90, 1865-76.
- Araujo, I.E., Rolls, E.T., Kringelbach, M.L., McGlone, F., and Phillips, N. (2003b). Taste-olfactory convergence, and the representation of the pleasantness of flavour, in the human brain. Eur. J. Neurosci., 18, 2059-2068.
- Burkhead, L.M., Sapienza, C.M., and Rosenbek, J.C. (2007). Strength-training exercise in dysphagia rehabilitation: Principles, procedures, and directions for future research. Dysphagia, 22, 251-265.
- Cazal, M.S., Silva, A.M.B.R., Galo, R., Junior, W.M., and Silva, M.A.M.R. (2016). Comparison of dynamic electromyographic analysis of masticatory capsules with materials of different textures. Cranio., 34, 105-111.
- Chi-Hyuck, J., Lee, S.H., Park, H.S., and Lee, J.H. (2009). Use of partial least squares regression for variable selection and quality prediction. 2009 International. Conference on Computers & Engineering. Troyes, France, 2009. 1302-1307.
- Chong, I.G. and Jun, C.H. (2005). Performance of some variable selection methods when multicollinearity is present. Chemom. Intell. Lab. Syst.. 78, 103-112.
- Ding, R., Logemann, J.A., Larson, C.R., and Rademaker, A.W. (2003). The Effects of taste and consistency on swallow physiology in younger and older healthy individuals: A surface electromyographic study. J. Speech. Lang. Hear. Res., 46, 977-989.
- Endo, H., Ohmori, N., Chikai, M., Miwa, H., and Ino, S. (2020). Effects of age and gender on swallowing activity assessed by electromyography and laryngeal elevation. J. Oral Rehabil., 47, 1358-1367.
- Eriksson, L., Johansson, E., Kettaneh-Wold, N., Trygg, J., Wikstrom, C., and Wold, S. (2006). “Multi- and Megavariate Data Analysis Basic Principles and Applications (Part I)”. Chapter 4. Umetrics..
- Ertekin, C. (2011). Voluntary versus spontaneous swallowing in man. Dysphagia, 26, 183-192.
- Hägg, G.M. (1992). Interpretation of EMG spectral alterations and alteration indexes at sustained contraction. J. Appl. Physiol., 73, 1221-1217.
- Jero, S.E. and Ramakrishnan, S. (2019). Analysis of muscle fatigue conditions in surface EMG signal with a novel Hilbert marginal spectrum entropy method. 2019 41st Annual International Conferences of the IEEE Engineering in Medicine and Biology Society(EMBC), Berlin, Germany, 2019. 2675-2678.
- Kayanuma, Y., Ueda, R., Minami, M., Abe, A., Kimura, K., Funaki, J., Ishimaru, Y., and Asakura, T. (2016). A predictive model based on surface electromyography to assess the easiness of deglutition dysphagia diets. J. Food Process Technol., 7, 604-610.
- Kent, R. (2004). The uniqueness of speech among motor systems. Clin. Linguist. Phon., 18, 495-505.
- Kern, M., Birn, R., Jaradeh, S., Jesmanowicz, A., Cox, R., Hyde, J., and Shaker, R. (2001). Swallow-related cerebral cortical activity maps are not specific to deglutition. Am. J. Physiol. Gastrointest. Liver Physiol., 280, G531-G538.
- Kohyama, K., Gao, Z., Ishihara, S., Funami, T., and Nishinari, K. (2016). Electromyography analysis of natural mastication behavior using varying mouthful quantities of two types of gels. Physiol. Behav., 161, 174-182.
- Leow, LP., Huckabee, M.L., Sharma, S., and Tooley, T.P. (2007). The influence of taste on swallowing apnea, oral preparation time, and duration1 and amplitude of submental muscle contraction. Chem. Senses, 32, 19-128.
- Malandraki, G.A., Sutton, B.P., Perlman, A.L., Karampinos, D.C., and Conway, C. (2009). Neural activation of swallowing and swallowing-related tasks in healthy young adults: An attempt to separate the components of deglutition. Hum. Brain Mapp., 30, 3209-3226.
- Manda, Y., Kodama, N., Maeda, N., and Minagi, S. (2019). Effect of food properties and chewing condition on the electromyographic activity of the posterior tongue. J. Oral Rehabil., 46, 511-517.
- Mehmood, T., Martens, H., Sæbø, S., Warringer, J., and Snipen, L. (2011). A partial least squares based algorithm for parsimonious variable selection. Algorithms Mol Biol., 6, 27.
- Miura, Y., Morita, Y., Koizumi, H., and Shingai, T. (2009). Effects of taste solutions, carbonation, and cold stimulus on the power frequency content of swallowing submental surface electromyography. Chem Sense, 34, 325-331.
- Morell, P., Tarrega, A., Foegeding, E.A., and Fiszman, S. (2018). Impact of composition and texture of protein-added yogurts on oral activity. Food Funct., 9, 5443-5454.
- Mori, K., Manda, Y., Kitagawa, K., Nagatsuka, H., Furuta, H., Kodama, N., and Minagi, S. (2021). Coordination of surface electromyography activity in the posterior tongue region during mastication of differently textured foods. J. Oral Rehabil., 48, 403-410.
- Morita, A., Araki, T., Ikegami, S., Okaue, M., Sumi, M., Ueda, R., and Sagara, Y. (2015). Coupled stepwise PLS-VIP and ANN modeling for identifying and ranking aroma components contributing to the palatability of Cheddar cheese. Food Sci. Technol. Res., 21, 175-186.
- Onozuka, M., Fujita, M., Watanabe, K., Hirano, Y., Niwa, M., Nishiyama, K., and Saito, S. (2002). Mapping brain region activity during chewing: A functional magnetic resonance imaging study. J. Dent. Res., 81, 743-746.
- Palla, S. and Ash, M.M. (1981). Power spectral analysis of the surface electromyogram of human jaw muscles during fatigue. Arch. Oral. Biol., 26, 547-553.
- Reverend, B.L., Saucy, F., Moser, M., and Loret, C. (2016). Adaptation of mastication mechanics and eating behaviour to small differences in food texture. Physiol. Behav., 165, 136-145.
- Rochester, D.F. (1985). The diaphragm: contractile properties and fatigue. J. Clin. Invest., 75, 1397-1402.
- Toóth, E., Faragoó, P., Kiraály, A., Szaboó, N., Vereéb, D., Kocsis, K., Kincses, B., Sandi, D., Bencsik, K., Vécsei, L., and Kincses, Z.T. (2019). The contribution of various MRI parameters to clinical and cognitive disability in multiple sclerosis. Front Neurol., 9, 1172.
- Tscharner, V.V., Goepfert, B., and Nigg, B.M. (2003). Changes in EMG signals for the muscle tibialis anterior while running barefoot or with shoes resolved by non-linearly scaled wavelets. J. Biomech., 36, 1169-1176.
- Vaiman, M., Nahlieli, O., and Eliav, E.. (2006). Oynophagia in patients after dental extraction: surface electromyography study. Head Face Med., 2, 34.
- Vaiman, M. (2007). Standardization of surface electromyography utilized to evaluate patients with dysphagia. Head Face Med., 3, 26.
- Vasco, S.R., Agudelo, S.R., Martinez, V., and Duque, A.O. (2018). Automatic detection of oral and pharyngeal phases in swallowing using classification algorithms and multichannel EMG. J. Electromyogr. Kinesiol., 43, 193-200.
- Wakeling, J.M., Kaya, M., Temple, G.K., Johnston, L.A., and Herzog, W. (2002). Determining patterns of motor recruitment during locomotion. J. Exp. Biol., 205, 359-369.
- Wang, Z.X., He, O., and Wang, J. (2014). Comparison of different variable selection methods for partial least squares soft sensor development. 2014 American Control Conference. 3116-3121.
- Ward, A.R. and Robertson, V.J. (2000). The variation in fatigue rate with frequency using kHz frequency alternating current. Med. Eng. Phys., 22, 637-646.
- Wold, S. (1995). PLS for Multivariate Linear Modeling. Chemometric Methods in Molecular Design. 195-218.
- Wold, S., Sjostrom, M., and Eriksson, L. (2001). PLS-regression: a basic tool of chemometrics. Chemometr. Intell. Lab., 58, 109-130.
