Original papers
Factors underlying the differential properties of gluten- and additive-free rice bread following rice flour pulverization
2022 Volume 28 Issue 2 Pages 151-158

Details
2022 Volume 28 Issue 2 Pages 151-158
This study aimed to identify factors required for making high-quality rice flour and bread; six cultivars with various kernel appearances and amylose content from 10% to 28% were used. Flour samples with small particle sizes and low damaged-starch content were obtained from rice cultivars with high proportions of opaque-kernel grains, probably due to low hardness. Rice cultivars with high amylose content produced bread with high specific loaf volume (> 5.5). The specific loaf volume of gluten- and additive-free rice bread was significantly correlated with amylose content and moderately correlated with opaque-kernel grain proportion. Protein content was not significantly correlated with rice flour and bread properties. Thus, rice cultivars with high amylose content and high proportions of opaque-kernel grains would be suitable for making high-quality rice flour and bread.
Gluten-free foods are recommended for people with celiac disease or wheat allergies. Rice can be used to make gluten-free foods, since it contains no gliadin and glutenin, which are primary components of gluten (Amagliani et al., 2017). Many methods of making gluten-free rice bread have been developed to date (Masure et al., 2016). In most cases, a thickening agent, such as xanthan or hydroxypropyl methylcellulose, is used as a substitute for gluten. Recently, gluten- and additive-free rice bread (100% rice bread) has also been developed (Yano et al., 2016, 2017, 2020). A negative correlation was found between the damaged starch content and specific loaf volume of 100% rice bread (Yano et al., 2017). Damaged starch is produced by mechanical or heat stress in the process of pulverizing, and the high content of damaged starch destabilizes the foam in the dough by absorbing a lot of water. One hundred percent rice bread with high specific loaf volume can be obtained when the damaged starch content of the flour is less than 5% (Yano et al., 2017, 2020). In our previous report, we had shown that amylose content plays a crucial role in the volume of 100% rice bread (Aoki et al., 2020). ‘Mizuhochikara,’ whose amylose content was the highest among all cultivars used in the study, had shown the highest specific loaf volume of 100% rice bread. However, further improvement in bread expansion is desirable because the specific loaf volume of 100% rice bread made from ‘Mizuhochikara’ is still lower than that of wheat bread.
The relationship between damaged starch and loaf volume implies that rice cultivars that can make flour with lower damaged starch content are promising candidates for making rice bread. Ashida et al. (2010) had previously reported that rice flour with low damaged starch content can be obtained using mutants with milky-white grains. However, the relationship between rice flour quality and grain characteristics of common rice cultivars has yet to be clarified. The amylose content of ‘Mizuhochikara’ is approximately 22%, which is higher than that of the major cultivars in Japan (Nakaura et al., 2011). However, many cultivars, such as some indica rice cultivars, have amylose contents higher than 25% (Horibata et al., 2004). Using such cultivars with high amylose contents, the specific loaf volume of 100% rice bread could be higher than that made from ‘Mizuhochikara.’
This study aimed to clarify the factors underlying the production of high-quality rice flour and 100% rice bread. We report the importance of white-kernel grains and amylose content in making rice flour with low damaged starch content and rice bread with high specific loaf volume by exploring the effects of grain qualities, rice flour components, flour properties, and 100% rice bread properties.
Rice samples All rice cultivars (Table 1) were grown in a paddy at Kyushu Okinawa Agricultural Research Center (33°12′ N, 130°30′ E) in Chikugo, Fukuoka, Japan in 2019. Each cultivar was grown under two nitrogen fertilizer application rates (Normal nitrogen fertilizer rate: 8 g/m2, High nitrogen fertilizer rate: 12 g/m2). The plants were grown under the same conditions until maturity. Rice samples were polished thrice using an experimental rice polisher, VP-32T (Yamamoto Co. Ltd, Tendo, Japan). Milling recovery was calculated as percentage of the weight of milled rice with respect to that of brown rice.

Grain appearance and hardness Appearance quality of the rice grain was analyzed with a grain quality analyzer (RGQI20A, Satake Co. Ltd., Hiroshima, Japan). Five hundred grains were analyzed in triplicate; rice grains were sorted into perfect grains, immature grains, dead grains, pigmented grains, broken grains, and other grains by the analyzer.
The hardness of brown rice grains was determined using a single kernel characterization system (SKCS) (model 4100, Perten Instruments AB, Huddinge, Sweden); 300 grains were studied in triplicate for each sample, and 100 sorted grains were measured in triplicate. All grains were used when the number of sorted grains was less than 100.
Preparation of rice flour Dry pulverization and three kinds of wet pulverization were conducted. For dry pulverization, polished rice grains were pulverized in a jet mill (SPM-R290; Nishimura Machine Works, Osaka, Japan) at 5 300 rpm. For wet pulverization, polished white rice was washed five times with water and then soaked in fresh water for 0 min, 30 min, or > 12 h at room temperature (15–20 °C). The soaked rice was drained and then pulverized under the same condition as in dry pulverization. Finally, the flour was dried in a dryer at a controlled temperature of 60 °C overnight.
Rice flour quality The moisture content of rice was calculated considering the amount of water removed from the flour after incubation in a drying oven at 130 °C for 1 h. Flour particle size was measured using a laser diffraction particle size analyzer (LS 13 320; Beckman Coulter, Brea, CA, USA), and damaged starch content was determined using a starch damage assay kit (Megazyme International Ireland, Wicklow, Ireland). Amylose content was determined by the iodine absorption method (Juliano, 1971) while nitrogen content was determined using an Elementar Vario EL CHNS analyzer (Elementar Analysensysteme GmbH, Hanau, Germany) with acetanilide as a standard; the amount of protein was calculated by multiplying the nitrogen content by 5.95 (Jones, 1941). All the values were determined in triplicate.
Preparation of 100% rice bread and evaluation The ingredients of 100% rice bread were as follows: 230 g rice flour (14% moisture basis), 20.7 g sugar, 4.6 g salt, 5.75 g olive oil, 4.6 g dry yeast, and 195.5 g water. The bread was made using a bread maker (KBD-X100; TIGER, Osaka, Japan); the preset program for gluten- and additive-free rice bread was selected. The bread making time was approximately 2 h.
Specific loaf volume was calculated as the volume/weight ratio (mL/g). It was measured using the rapeseed displacement method described in Approved Method 10-05.01 (AACC International, 2000). Bread hardness was evaluated with a compression test using a model RE2-3305C creep meter (Yamaden, Tokyo, Japan). A 2-cm-thick bread slice was compressed to 40% of its original thickness at a speed of 5.0 mm/s using a 16-mm-diameter plunger with a flat surface. The stress at 25% thickness was reported as bread firmness. It was measured two days after baking. Both specific loaf volume and bread firmness were measured in duplicate.
Statistical analysis Analysis of variance, regression analysis, t-tests, and Tukey's tests were performed using R statistical softwarei). Statistical significance for the comparative tests was defined as p < 0.05.
Components in rice The amylose and protein contents of rice are shown in Table 1. The amylose content ranged from 10.0% to 28.3%, and the protein content ranged from 6.0% to 7.8%. The protein content of rice grown under high nitrogen rate was higher than that of rice grown under normal nitrogen rate for each cultivar, and four cultivars showed significant differences. Analysis of variance showed that nitrogen fertilizer had a significant effect on protein content but no significant effect on amylose content (data not shown). There was no significant correlation between amylose content and protein content (r = −0.17, p > 0.05).
Characteristics of rice grain Table 2 shows the characteristics of grain appearance. ‘Emitawawa’ and ‘Mizuhochikara’ showed low proportions of perfect grains and high proportions of dead grains (opaque-kernel grains) compared to the other cultivars. Neither amylose nor protein content showed significant correlation with the proportion of each feature of grain appearance (i.e., perfect grain, immature grain, dead grain, and other grains, p > 0.05).
| Cultivar | Nitrogen fertilizer application rate | Perfect grain proportion (%) | Immature grain proportion (%) | Dead grain proportion (%) | Other grain proportion (%) | Milling recovery (%) |
|---|---|---|---|---|---|---|
| Pikamaru | Normal | 54.0 ± 3.7 bc | 42.1 ± 3.5 de | 2.4 ± 0.8 ef | 1.6 ± 0.5 c | 90.0 |
| High | 46.0 ± 2.9 cd | 49.9 ± 3.2 bc | 1.5 ± 0.3 f | 2.7 ± 0.7 c | 89.3 | |
| Hinohikari | Normal | 33.4 ± 5.1 ef | 61.0 ± 4.1 a | 2.6 ± 0.4 ef | 3.1 ± 0.7 c | 88.6 |
| High | 41.7 ± 1.2 d | 53.7 ± 2.2 b | 1.6 ± 0.6 f | 3.1 ± 0.8 c | 88.8 | |
| Nipponnbare | Normal | 64.9 ± 4.0 a | 26.8 ± 2.4 g | 4.6 ± 0.6 def | 3.7 ± 1.1 bc | 87.2 |
| High | 54.3 ± 2.1 b | 35.3 ± 2.0 f | 6.7 ± 0.7 ce | 3.7 ± 0.9 bc | 87.0 | |
| Mizuhochikara | Normal | 39.0 ± 1.7 de | 40.9 ± 1.9 df | 9.3 ± 1.1 c | 10.8 ± 2.3 a | 83.2 |
| High | 29.6 ± 2.5 f | 46.9 ± 0.1 cd | 10.1 ± 1.6 c | 13.5 ± 1.4 a | 81.9 | |
| Emitawawa | Normal | 21.0 ± 4.7 g | 44.8 ± 2.3 cde | 22.2 ± 5.1 b | 12.1 ± 1.7 a | 82.1 |
| High | 12.5 ± 1.2 h | 46.6 ± 3.6 cde | 27.6 ± 1.8 a | 13.4 ± 2.5 a | 81.3 | |
| Fukunoko | Normal | 66.5 ± 4.6 a | 27.3 ± 3.3 g | 2.6 ± 0.9 bc | 3.6 ± 0.6 bc | 88.2 |
| High | 46.1 ± 3.3 bd | 40.0 ± 1.4 ef | 7.2 ± 2.1 b | 6.7 ± 0.6 b | 86.7 |
Means ± standard deviation are shown for characteristics of rice appearance (n=3).
Means with the same letter in each column are not significantly different (P < 0.05, Tukey's test).
Milling recovery was determined without replication.
Table 3 shows the hardness index measured in all grains and in those sorted by a quality analyzer. The grain hardness of ‘Emitawawa’ was the lowest among all the cultivars and that of ‘Mizuhochikara’ was the second lowest when all the grains were measured together. However, when comparing the data obtained from sorted grains, there was no clear difference across the cultivars. There was no significant difference between the grain hardness of rice grown under normal nitrogen fertilization rate and that of rice grown under high nitrogen fertilization rate.
| Cultivar | Nitrogen fertilizer application rate | All grains (HI) | Perfect grains (HI) | Immature grains (HI) | Dead grains (HI) | Other grains (HI) |
|---|---|---|---|---|---|---|
| Pikamaru | Normal | 82.3 ± 15.2 a | 81.2 ± 18.2 a | 80.9 ± 17.7 a | 70.9 ± 18.1 ab | 80.7 ± 18.2 ab |
| High | 81.4 ± 14.8 ab | 82.3 ± 15.6 a | 76.7 ± 16.4 ab | 72.9 ± 18.7 a | 82.4 ± 17.4 a | |
| Hinohikari | Normal | 83.0 ± 16.4 a | 84.2 ± 16.3 a | 78.4 ± 15.7 ab | 60.5 ± 16.3 c | 79.4 ± 15.4 ab |
| High | 81.5 ± 15.3 ab | 83.3 ± 15.5 a | 77.4 ± 16.0 ab | 67.7 ± 16.3 ac | 83.2 ± 15.1 ab | |
| Nipponnbare | Normal | 75.3 ± 15.5 de | 79.6 ± 12.4 a | 74.6 ± 14.7 ab | 67.1 ± 17.0 ac | 74.3 ± 16.7 b |
| High | 79.6 ± 15.1 ad | 79.5 ± 17.0 a | 75.7 ± 15.3 ab | 70.3 ± 15.9 ab | 78.5 ± 16.1 ab | |
| Mizuhochikara | Normal | 76.7 ± 16.6 cd | 80.7 ± 15.4 a | 77.8 ± 14.6 ab | 61.9 ± 17.2 c | 76.0 ± 16.7 ab |
| High | 75.7 ± 18.6 d | 86.0 ± 15.7 a | 76.6 ± 16.1 ab | 65.9 ± 15.7 ac | 78.8 ± 14.2 ab | |
| Emitawawa | Normal | 71.3 ± 18.1 f | 85.2 ± 14.3 a | 72.2 ± 16.7 b | 62.5 ± 15.1 c | 75.9 ± 15.9 ab |
| High | 70.6 ± 17.7 ef | 82.5 ± 15.4 a | 73.1 ± 15.0 b | 63.2 ± 14.8 bc | 75.9 ± 15.1 ab | |
| Fukunoko | Normal | 80.9 ± 14.4 abc | 83.8 ± 12.4 a | 78.1 ± 12.5 ab | 70.9 ± 13.4 ab | 80.3 ± 16.8 ab |
| High | 77.7 ± 15.4 bd | 79.7 ± 16.8 a | 76.1 ± 15.9 ab | 67.8 ± 19.5 ac | 76.2 ± 15.9 ab |
Means ± standard deviation are shown (n = 3).
Means with the same letter in each column are not significantly different (P < 0.05, Tukey's test).
There was a significant positive correlation between milling recovery and the proportion of perfect grains (r = 0.72, p < 0.05), and a significant negative correlation between milling recovery and the proportion of dead grains (r = −0.86, p < 0.05).
Rice flour properties There were differences in particle size and damaged starch content across samples and pulverizing methods (Tables 4 and 5). In wet pulverization, the longer the rice was soaked, the less the particle size and damaged starch content was in the rice flour. The proportion of dead grains significantly correlated with the average particle size and damaged starch content of the rice flour made by wet pulverization (particle size: r = −0.61 to −0.78, damaged starch: −0.66 to −0.78, p < 0.05). However, the proportion of perfect grain and immature grain had no significant correlation with the average particle size or damaged starch content of the rice flour (p > 0.05, data not shown).
| Cultivar | Nitrogen fertilizer application rate | Dry pulverization (µm) | Wet pulverization (µm) | ||
|---|---|---|---|---|---|
| 0 min soaking | 30 min soaking | Overnight soaking | |||
| Pikamaru | Normal | 109.9 ± 8.1 bce | 40.6 ± 0.2 c | 22.0 ± 0.5 a | 21.5 ± 0.9 a |
| High | 130.3 ± 5.4 ab | 47.4 ± 0.6 b | 22.0 ± 0.1 a | 21.1 ± 0.2 a | |
| Hinohikari | Normal | 133.8 ± 11.1 a | 40.3 ± 0.1 c | 20.3 ± 0.6 b | 20.1 ± 0.1 b |
| High | 106.9 ± 1.7 ce | 54.7 ± 1.3 a | 20.8 ± 0.4 b | 21.3 ± 0.2 a | |
| Nipponnbare | Normal | 122.4 ± 6.3 ac | 34.5 ± 0.3 d | 19.3 ± 0.2 c | 18.3 ± 0.6 cd |
| High | 122.3 ± 3.7 ac | 29.3 ± 0.2 e | 19.3 ± 0.4 cd | 19.5 ± 0.1 b | |
| Mizuhochikara | Normal | 113.2 ± 5.3 acd | 23.9 ± 0.2 f | 17.9 ± 0.2 ef | 17.2 ± 0.1 de |
| High | 111.3 ± 8 bcd | 21.4 ± 0.2 g | 18.4 ± 0.1 de | 18.0 ± 0.2 cd | |
| Emitawawa | Normal | 98.8 ± 3.6 de | 21.7 ± 0.3 g | 16.2 ± 0.3 gh | 16.5 ± 0.3 ef |
| High | 90.5 ± 11.7 e | 20.0 ± 0.0 h | 15.7 ± 0.4 h | 16.9 ± 0.3 f | |
| Fukunoko | Normal | 101.6 ± 1.7 de | 29.2 ± 0.6 e | 17.4 ± 0.2 de | 17.1 ± 0.2 de |
| High | 110.2 ± 8.6 bce | 23.7 ± 0.3 f | 17.1 ± 0.1 f | 15.8 ± 0.2 f | |
| Correlation with mean grain hardness measured for all grains |
r = 0.60 * | r = 0.74 ** | r = 0.79 ** | r = 0.72 ** | |
Means ± standard deviation are shown (n = 3).
Means with the same letter in each column are not significantly different (P < 0.05, Tukey's test).
| Cultivar | Nitrogen fertilizer application rate | Dry pulverization (%) | Wet pulverization (%) | ||
|---|---|---|---|---|---|
| 0 min soaking | 30 min soaking | Overnight soaking | |||
| Pikamaru | Normal | 10.9 ± 0.3 g | 11.5 ± 0.1 a | 2.9 ± 0.1 a | 2.5 ± 0.0 a |
| High | 9.8 ± 0.0 cf | 11.6 ± 0.1 a | 2.8 ± 0.0 a | 2.5 ± 0.0 ab | |
| Hinohikari | Normal | 12.3 ± 0.8 ac | 11.0 ± 0.2 a | 2.4 ± 0.0 bc | 2.3 ± 0.0 b |
| High | 11.6 ± 0.2 bce | 11.0 ± 0.7 a | 2.5 ± 0.0 b | 2.2 ± 0.0 c | |
| Nipponnbare | Normal | 10.8 ± 0.1 ef | 7.8 ± 0.4 bc | 2.1 ± 0.0 e | 2.0 ± 0.1 d |
| High | 11.1 ± 0.1 def | 8.2 ± 0.2 b | 2.2 ± 0.1 e | 2.1 ± 0.0 cd | |
| Mizuhochikara | Normal | 11.8 ± 0.0 bcd | 6.0 ± 0.3 d | 2.2 ± 0.0 de | 2.1 ± 0.0 cd |
| High | 12.4 ± 0.3 ab | 5.0 ± 0.1 e | 2.4 ± 0.0 cd | 2.2 ± 0.0 c | |
| Emitawawa | Normal | 11.4 ± 0.2 cf | 4.5 ± 0.1 ef | 1.7 ± 0.0 g | 1.8 ± 0.0 ef |
| High | 10.6 ± 0.2 fg | 3.7 ± 0.0 f | 1.8 ± 0.0 fg | 1.7 ± 0.0 f | |
| Fukunoko | Normal | 13.1 ± 0.4 a | 7.1 ± 0.0 c | 1.9 ± 0.1 f | 1.8 ± 0.1 ef |
| High | 13.0 ± 0.2 a | 5.1 ± 0.6 e | 1.9 ± 0.1 f | 1.9 ± 0.1 e | |
| Correlation with mean grain hardness measured for all grains |
r = 0.12 | r = 0.86 ** | r = 0.72 ** | r = 0.71 ** | |
Means ± standard deviation are shown (n = 3).
Means with the same letter in each column are not significantly different (P < 0.05, Tukey's test).
There was significant positive correlation between the grain hardness and particle size of the rice flour, regardless of the pulverizing method (Table 4). However, there were significant positive correlations between grain hardness and damaged starch content of the rice flour obtained only by wet pulverization (Table 5). ‘Emitawawa,’ which had the highest proportion of dead grains and lowest grain hardness among all the cultivars (Table 3), showed the lowest particle size and damaged starch content.
Rice bread properties Rice flour samples from the three kinds of wet pulverization (soaking time: 0 min, 30 min, and > 12 h) were used for making 100% rice bread. There was no significant difference between the amylose content and damaged starch content calculated from the combined data of the three pulverization times (r = −0.30, p > 0.05).
The shapes of 100% rice bread were different across samples (Fig. 1). The bread made from the rice flour of ‘Fukunoko,’ pulverized after soaking for >12 h, showed the highest specific loaf volume (5.6 mL/g) among the samples. There were significant correlations of specific loaf volume with amylose content (r = 0.78, p < 0.01) and damaged starch content (r = −0.74, p < 0.01). Multiple regression analysis revealed both amylose content and damaged starch content to be significantly correlated with the specific volume of the 100% rice bread (R2 = 0.879, p < 0.01). Figure 2 shows the relationship between damaged starch content and specific loaf volume. The absolute value of the correlation coefficient for each cultivar was more than 0.90 (data not shown). Rice bread made from ‘Pikamaru,’ whose amylose content was the lowest among all the cultivars (Table 1), showed low specific loaf volume regardless of the damaged starch content of the flour (Fig. 2). The specific loaf volume of rice bread made from ‘Fukunoko,’ whose amylose content was the highest among all the cultivars, was the highest when the damaged starch content was low. There were significant correlations between the specific loaf volume and proportion of dead grains (r = 0.48, p < 0.01) and between the specific loaf volume and grain hardness value (r = −0.54, p < 0.01). Multiple regression analysis showed that specific loaf volume was significantly correlated with the amylose content (p < 0.01) but not with the proportion of dead grains or grain hardness value (proportion of dead grains: p = 0.081, grain hardness: p = 0.082). However, specific loaf volume was significantly correlated with both the proportion of dead grains and grain hardness value when the data of rice flour pulverized after soaking for 0 h were used for analysis (p < 0.01). The average particle size, protein content, and water content of rice flour were not significantly correlated with the specific loaf volume (p > 0.05, data not shown).

Shapes of gluten- and additive-free rice bread
A: Normal nitrogen fertilizer application rate, and B: High nitrogen fertilizer application rate.
Rice flour samples obtained by wet milling after > 12 h of soaking in water were used.

Relationship between damaged starch content and specific loaf volume of gluten- and additive-free rice bread
There was a significant positive correlation between amylose content and bread firmness (Fig. 3). The bread firmness of ‘Fukunoko’ was the highest among the cultivars even though loaf volume was also the highest. Moreover, there was a significant negative correlation between bread firmness and damaged starch content (r = −0.71, p < 0.01). Protein content, average particle size, and water content of the rice flour were not significantly correlated with bread firmness (p > 0.05, data not shown).
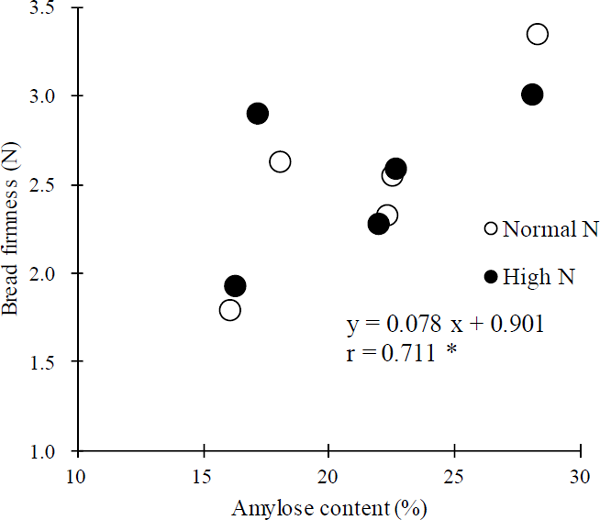
Hardness of gluten- and additive-free rice bread 2 days after making the rice bread from rice flour by pulverization after > 12 h of soaking
The data of bread samples made from ‘Pikamaru’ are not shown due to low specific loaf volumes.
Rice bread is best suited for people with gluten sensitivity and for those who preferably avoid additives in foods. In this study, we revealed two factors, high amylose content (> 25%) of the cultivar and high percentage of opaque kernels in grains, to be necessary for preparation of 100% rice bread with the highest loaf volume. This information would be useful for selecting rice cultivars and rice flour suitable for making rice bread.
The major challenges with gluten-free bread are the lower loaf volume and higher bread firmness than that in wheat bread (Kadan et al., 2001; Różyło et al., 2015). This study showed that there were significant positive correlations between specific loaf volume and amylose content and that the high-amylose rice cultivar ‘Fukunoko’ could make rice bread with the highest volume when the damaged starch content in the flour was low (Figs. 1 and 2). To our knowledge, the bread made from ‘Fukunoko’ showed the highest specific loaf volume among reported 100% rice breads.
High amylose content caused high firmness of the bread (Fig. 3), and the bread firmness of ‘Fukunoko’ was the highest. Amylopectin, another component of starch, is also associated with the firming of bread during storage by partial recrystallization of linear chains (Bosmans et al., 2013). Although amylopectin structure of the samples was not investigated in this study, there is supporting evidence that the bread firmness of ‘Fukunoko’ is not due to differences in amylopectin structure. The alkali solubility of ‘Fukunoko’ is high and equivalent to that of ‘Hinohikari’ (Shigemune et al., 2019), and alkali solubility is correlated with amylopectin structure (Umemoto and Aoki, 2005). These results indicate that the amylopectin structure of ‘Fukunoko’ is equivalent to that of other common cultivars. At present, considering the balance between bread volume and firmness, the rice cultivars with intermediate amylose content (approximately 22%), such as ‘Mizuhochikara’ and ‘Emitawawa,’ would be better suited for making 100% rice bread. Aoki et al. (2015) showed that shorter amylopectin chains led to slower firming of rice bread. If a cultivar with high amylose content and short amylopectin chains could be bred, both high loaf volume and low firmness of the bread could be achieved.
The current study showed that rice flour with a low amount of damaged starch can be obtained when rice grains with a high proportion of opaque-kernel grains (Tables 4 and 5) are used, probably due to lower hardness of the grain compared to that of perfect grains. Opaque-kernel grains contain air spaces and irregular cells, and amyloplasts in the cell are not tightly packed (Lisle et al., 2000), indicating that the air spaces in the grains are the main cause of low hardness. A low proportion of perfect grains is not desirable for cooked rice, due to their poor appearance and texture (Kim et al., 2000). However, it may be a good feature for making high-quality rice flour for preparing rice bread, especially when using pulverizing conditions that increase damaged-starch content, such as wet pulverization after 0 min soaking (Table 5), which could lower the cost of pulverization. A very high proportion of opaque kernels would cause low milling recovery (Table 2), probably because grains would be broken during the milling process due to low hardness. The results collectively indicate that improvements in the rice milling process would be necessary to make the best use of rice samples with high proportions of opaque-kernel grains for making rice flour.
The present price of rice flour is higher than that of wheat flour due to its higher cultivation cost compared to that of wheat. One of the measures to reduce the cost would be to utilize high-yield cultures with high levels of fertilizer application. However, high levels of nitrogen fertilizer often lead to cooked rice with bad palatability owing to the high protein content of the grain, resulting in its firming (Okadome et al., 1999). In this study, higher nitrogen application, however, had little effect on the rice flour and bread quality (Tables 4 and 5, Figs. 1, 2, and 3), although the protein content increased due to nitrogen application (Table 1). This indicates that high nitrogen fertilizers do not have a negative influence on the quality of rice flour. When high-amylose cultivars are grown under high rates of fertilizer application, both cost reduction and better quality may be achieved.
Acknowledgements We would like to thank Dr. Umemoto and Dr. Araki for technical help regarding the preparation of rice flour, and Dr. Koga and Dr. Ihara for technical help regarding protein analysis. This research was supported by grants from the Project of the Bio-oriented Technology Research Advancement Institution, NARO (special scheme project on advanced research and development for next-generation technology), and NARO Cross-Sectional Research Project.
Conflict of interest There are no conflicts of interest to declare.