Abstract
The molecular interaction of black tea components with phospholipid vesicles has been investigated to elucidate the various functions of black tea infusions, such as astringency, inhibition of cholesterol absorption, and inactivation of viruses. We have developed a simple method to analyze the turbidity of phospholipid vesicle solutions reacted with black tea infusions or components as an indicator of the molecular interaction. Using a portable visible spectrophotometer, the dose-dependency of catechins, theaflavins, thearubigins, and black tea infusions on turbidity was analyzed. The results indicate that authentic catechins and theaflavins independently caused aggregation of the phospholipid vesicles; however, their concentrations in the tea infusions were insufficient. Meanwhile, thearubigins prepared from black tea leaves caused aggregation at the concentration found in the tea infusions. It is concluded that thearubigins, instead of theaflavins, mainly contribute to the interaction with phospholipid vesicles.
Introduction
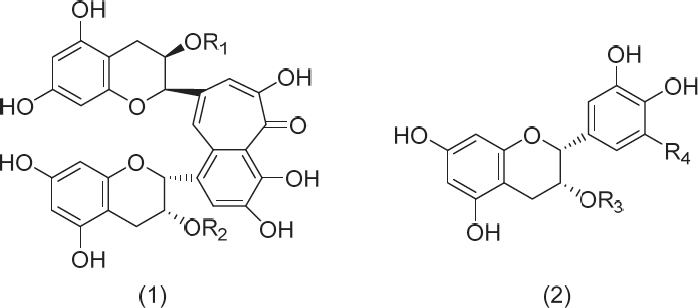
The molecular interaction of tea polyphenols with phospholipid vesicles has been attracting attention, as some of these polyphenols, e.g., theaflavins (TFs) in black tea, exert physiological effects even without being absorbed through the small intestine. TFs, such as theaflavin (TF1), theaflavin-3-O-gallate (TF2A), theaflavin-3′-O-gallate (TF2B), and theaflavm-3,3′-di-O-gallate (TF3) (Fig. 1), are red-colored polyphenols formed during the process of black tea production. Typical functions of black tea polyphenols include the sensation of astringency felt in the oral cavity (Reis et al., 2020), reduction of cholesterol incorporation into bile acid micelles (Vermeer et al., 2008), hepatic cholesterol-lowering activity (Miyata et al., 2011), inhibition of cholesterol absorption through the small intestine (Ikeda et al., 2010), inhibition of apical sodium-dependent bile acid transporter activity (Takashima et al., 2021), elevation of cremasteric blood flow (Saito et al., 2016), inhibition of infectivity of influenza virus (Nakayama et al., 1993), and inactivation of severe acute respiratory syndrome coronavirus 2 (Ishimoto et al., 2021). It was suggested that TF1 could be a potential anti-SARS-CoV-2 RNA-dependent RNA polymerase in a molecular docking study (Lung et al., 2020), and the antiviral activities of green tea and black tea polyphenols in COVID-19 prophylaxis have been reviewed (Mhatre et al., 2021). It has been reported that black tea extracts from different production areas showed aggregation of liposomes containing cholesterol as a viral membrane model and that the aggregation strength was correlated with the respective anti-influenza A virus activity (Iijima et al., 2022). Recently, various functions of thearubigins, high molecular weight polyphenol mixtures with a reddish-brown color that are abundantly contained in black tea infusions, have been attracting scientific interest (Zhu et al., 2021). However the extent of involvement of the respective polyphenols in black tea infusions in molecular interactions with membranes in the various biological activities mentioned above has not been examined. We have investigated the molecular interaction of these polyphenols with micelles and phospholipid vesicles (Narai-Kanayama et al., 2018). Among the four kinds of catechins (Fig. 1), galloyl catechins, such as epicatechin gallate (ECg) and epigallocatechin gallate (EGCg), exerted stronger activities than non-galloyl catechins, such as epicatechin (EC) and epigallocatechin (EGC). Similarly, galloyl TFs, such as TF2A, TF2B, and TF3, exerted stronger activities than TF1, a non-galloyl TF. These galloyl catechins and galloyl TFs reacted with egg phosphatidylcholine (PC) vesicles, resulting in increased turbidity of the mixture in the absence of taurocholate. On the other hand, TF2A elevated the turbidity of the vesicles and micelles even in the presence of taurocholate. Theaflavins were not observed to be transported across the jejunum membrane, instead they were incorporated into the apical side of the membrane (Nguyen et al., 2019). Since the molecular weights of the respective compounds in thearubigins are much higher than those of TFs, this suggests that they are neither transported across the jejunum membrane nor incorporated into the apical side of the membrane. Consequently, the molecular interaction of thearubigins with phospholipids on the surfaces of epithelial cells, bile acid micelles, and envelopes of various viruses is suggested to be important in exerting the various functions. The purpose of this study is to elucidate the dose-dependency of catechins, TFs, and thearubigins in the turbidity of PC vesicle solutions as an indicator of the molecular interaction with phospholipid membranes and to clarify which components in the black tea infusions are involved in the molecular interactions with phospholipid membranes.
Materials and Methods
Materials EC, EGC, ECg, EGCg, and TFs as standards for HPLC analysis were kindly provided by Mitsui Norin (Shizuoka, Japan). TFs for the turbidity experiments were prepared as described previously (Matsuura et al., 2014). Dipalmitoyl phosphatidylcholine (DPPC) was purchased from NOF Corporation (Tokyo, Japan). Sri Lankan Broken Orange Pekoe Fannings (BOPF) black tea for tea bags (provided by several black tea brands in Japan) was blended by the Japan Tea Association.
A single batch of the blended black tea leaves was used throughout the study. Thearubigins were prepared by excluding caffeine and polyphenols from the tea extract according to the method of Wang et al. (2018), an isolation method considered to be appropriate for structural analysis and functional studies (Zhu et al., 2021). Briefly, 20 g of black tea leaves was soaked in 200 mL of 50 % methanol at room temperature for two days. The same procedure was repeated twice. The combined extracts were concentrated by a rotary evaporator to remove methanol and the resulting aqueous solution was freeze-dried. The obtained powder (total 7.8 g) was kept in a desiccator as the black tea extract. One gram of the black tea extract was added to boiling water (60 mL) containing 40 mM of caffeine to form the complex of caffeine and black tea polyphenols. The resulting solution was allowed to stand at 4°C for 1 h. The turbid solution was centrifuged at 6 000 g for 5 min. Next, the precipitate was suspended in 90 % ethanol and applied to a Sephadex LH-20 column (17 × 1.4 cm) obtained from Sigma-Aldrich (St. Louis, MO, USA). Substances other than thearubigins were eluted using 90 % ethanol (170 mL). The dark brown substances remaining in a layer in the upper portion of the column were eluted with 50 % aqueous acetone as the thearubigin fractions. It was confirmed that the fractions showed a peak like a hump, and no other peaks ascribed to catechins or theaflavins appeared in the chromatogram under the HPLC conditions for theaflavins (Wang et al., 2018). Then, the fractions were completely dried by evaporation and weighed. The dried substances were dissolved and diluted with water at predetermined concentrations (µg/mL) and applied to the turbidity analysis. All other reagents used were of analytical grade.
Preparation of DPPC vesicles DPPC was dissolved in a small amount of chloroform in a round-bottomed flask and dried with a vacuum pump. The thin film of DPPC was suspended in 15 mM Na-phosphate buffer, pH 6.5, containing 132 mM NaCl in an ultrasonic bath, and then the suspension was sonicated with the ultrasonic disruptor model Branson Digital Sonifier SFX 250 (Emerson Electric Co., St. Louis, MO, USA) at 25 °C with 15 sets of sonication for 3 s with a 3-s interval (30 % amplitude). The sonicated solution was centrifuged at 15 000 g for 15 min to remove any potential remaining vesicular aggregates. The PC concentration in the supernatant containing small unilamellar vesicles (liposomes) was determined with a test kit from FUJIFILM Wako Pure Chemical (Osaka, Japan) and adjusted to 2.5 mM by dilution with the same buffer.
Turbidity analysis after incubation of small DPPC vesicles with tea polyphenols or diluted tea infusions An aliquot (40 µL) of the respective polyphenol solutions or the diluted tea infusions was mixed with 160 µL of the small DPPC vesicle solution (2.5 mM, final 2.0 mM of the PC concentration). After the mixture was vortexed and incubated for 1 min, the optical density (OD) of the mixture was measured with a portable visible spectrophotometer, PiCOEXPLORER LED detection system, purchased from Yamato Scientific Co., Ltd., at 575–660 nm (maximum wavelength at 615 nm in turbidity mode). The results of triplicate measurements were expressed as the average ± standard deviation. Statistical analysis was performed with the software Easy R (EZR) (Kanda, 2013). The adjusted p-values are provided in the supplemental tables (Tables S1 and S2).
Preparation and fractionation of tea infusions Tea infusions were prepared in triplicate. A solid-phase extraction (SPE) column (InertSep C18, 200 mg, 3 mL) purchased from GL Sciences (Tokyo, Japan) was conditioned successively with methanol (1 mL), methanol-water (1:1, 1 mL), and 0.05% phosphoric acid (1 mL). The tea was brewed with black tea leaves (2 g) and boiling water (100 mL) in an insulated cup for 2 min, with gentle stirring every 20 s. The obtained tea infusion was immediately filtered with a tea strainer, and then with a disk syringe filter (Millex-HV, 0.45 µm, Merck Millipore Ltd., Tullagreen, Ireland). The resulting solution was passed through the conditioned SPE column, and then 1 mL of 0.05 % phosphoric acid was passed through the column. The combined colorless effluent was discarded. The remaining fraction appeared as a dark brown band in the SPE column. After 1 mL of the mobile phase in the following HPLC analysis, 28 % acetonitrile solution containing 0.05 % phosphoric acid or 16% acetonitrile solution containing 0.05% phosphoric acid, was added to the column, the dark brown effluent was obtained and immediately applied to the following HPLC analysis.
HPLC analysis of theaflavins and catechins The concentrations of the four TFs (TF1, TF2A, TF2B, TF3) and the four catechins (EGC, EC, EGCg, ECg) in the black tea infusions were measured with an HPLC system (Narai-Kanayama et al., 2018). The HPLC analysis of polyphenols was performed using a Jasco HPLC system (Tokyo, Japan) equipped with a photodiode array detector and a reversed phase column (Synergi 4 µm Polar-RP, 80 Å, 150 × 4.6 mm; Phenomenex, Torrance, CA, USA). The flow rate was 1.0 mL/min, the injection volume was 1.0 µL, and the oven temperature was 40 °C. TFs were eluted with a 28 % acetonitrile solution containing 0.05 % phosphoric acid at a flow rate of 1 mL/min under isocratic conditions with detection at 254 nm. Catechins were eluted with a 16 % acetonitrile solution containing 0.05 % phosphoric acid at a flow rate of 1 mL/min under isocratic conditions with detection at 280 nm. The results obtained from triplicate experiments with individually prepared infusions were expressed as the average ± standard deviation.
Results and Discussion
Characteristics of the turbidity analysis It has been reported that TF2A specifically interacts with a small PC vesicle solution, resulting in increased turbidity as measured by absorbance at 595 nm (Narai-Kanayama et al., 2018). In that study, PC from egg yolk was used to prepare the small vesicle solutions, and the turbidity of the 620 µL mixture was measured for 60 min in a UV-transparent disposable cuvette. In the present study, DPPC composed exclusively of saturated palmitic acid was used as the material for the vesicles instead of egg PC. Furthermore, the turbidity of the mixture containing the DPPC vesicle solution and TFs or black tea solution in 200 uL PCR tubes was measured after 1 min incubation, using a portable visible spectrophotometer with an LED detection system at 575–660 nm (maximum wavelength at 615 nm in turbidity mode) at the following settings: LED output, 20 %;sensor integration time, 100 ms.
Structure-activity relationship of tea polyphenols in the turbidity analysis An aliquot (40 µL) of the aqueous polyphenol solutions was mixed with 160 µL of the DPPC vesicle solution (2.5 mM). The degree of aggregation of the respective polyphenols was determined as OD and found to greatly differ among the TFs. Aggregation was compared at each concentration and significant differences were observed among the TFs. Figure 2 shows the dose-dependency with turbidity of the mixtures of the three galloyl TFs and DPPC vesicle solution. TF2A and TF3 caused aggregation of the DPPC vesicles with significantly higher ODs than TF2B at concentrations of 40, 80, and 120 µM (Fig. 2, Table S1). TF1 caused obvious aggregation at concentrations higher than 240 µM (Fig. 3). Among the four catechins, EGCg and ECg caused aggregation of the DPPC vesicles with significantly higher ODs than EC and EGC at concentrations of 360, 480, and 600 µM (Fig. 3, Table S2). These results indicate that the presence of galloyl moieties is an important factor in the molecular interaction of these polyphenols with phospholipid membranes. It is not, however, a requirement, as the non-galloyl TF1 also caused aggregation at higher concentrations (Fig. 3) than the galloyl TFs. It is suggested that the basic structure of TFs with high lipophilicity contributes to the interaction with vesicles. The dose-dependency of TF2A was almost the same as observed for TF3. On the other hand, the aggregation activity of TF2B was lower than that of TF2A. It is suggested that the location of the galloyl moiety of TFs is also a factor in the aggregation activity. In other words, the galloyl moiety of the tropolone ring side of TF2A (R1) might lead to a stronger interaction than that of the benzene ring side of TF2B (R2) (Fig. 1). In the case of TF3 with both galloyl moieties, that of the tropolone ring side could mainly interact with the phospholipid membrane, and consequently its dose-response curve was almost the same as that of TF2A. The reported log Pow values of theaflavins are as follows: TF1, 0.09; TF2A, 0.90; TF2B, 1.31; TF3, 2.39 (Narai-Kanayama et al., 2018). These values were obtained with an octanol/water system, which does not reflect the steric effects of interactions between TFs and liposomes as assemblies of phospholipids. Therefore, the structure-activity relationship in this study is supposed to reflect the steric effects in addition to the simple partition coefficients.

Effect of diluted black tea solutions on turbidity An aliquot (40 µL) of the diluted tea solutions prepared with black tea leaves under the same conditions was mixed with 160 µL of the small DPPC vesicle solution (2.5 mM). Since the addition of the intact black tea infusions without dilution to the DPPC vesicle solution resulted in obvious sedimentation, the tea infusions were diluted 50 to 250 times to evaluate the concentration dependency. In Fig. 4, the relative concentration means the reciprocal of the dilution factor. For example, when the relative concentration is 0.020, the dilution factor is 50. The tea infusions caused a dose-dependent increase in turbidity at the relative concentrations from 0.004 to 0.02.

Concentrations of TFs and catechins in tea infusions Table 1 shows the concentrations of TFs and catechins in the tea infusions prepared in this study. Since the total concentration of TFs in the intact black tea infusion is 36 µM, the total concentration of TFs in the diluted infusion at 0.016 relative concentration with OD 0.99 ± 0.03 in Fig. 4 was calculated as 0.58 µM. Even if the total value of TFs is ascribed to TF2A, it is obviously insufficient to cause aggregation (Fig. 2). Similarly, since the total concentration of catechins in the intact black tea infusion is 1411 µM, the concentration of catechins in the diluted infusion at 0.016 relative concentration was calculated as 22 µM. Even if the entire value is ascribed to EGCg, it is also insufficient to cause aggregation (Fig. 3). In conclusion, although the authentic TFs and catechins independently cause aggregation of phospholipid vesicles, their concentrations in the infusions were too low to explain the dose-dependent effects of the black tea infusions. These results suggest that polyphenols other than TFs and catechins in the tea infusions might interact with phospholipid vesicles to show high activities.
Table 1
Concentration of theaflavins (µM) and catechins (µM) in the black tea infusions.
| TF1 |
TF2A |
TF2B |
TF3 |
total |
| 7.4 ± 0.7 |
9.6 ± 0.2 |
4.2 ± 0.2 |
14.8 ± 0.7 |
36.0 |
| EC |
EGC |
ECg |
EGCg |
total |
| 183 ± 17 |
226 ± 28 |
649 ± 92 |
353 ± 43 |
1411 |
Data are shown as average ± SD for triplicate experiments
Effects of thearubigins on turbidity Thearubigins, mixtures of structurally unidentified polyphenols, were reported to comprise up to 60 % of the solids in a black tea infusion (Zhu et al., 2021). In the present study, the dry weight in 5 mL of the tea infusion was 30.0 ± 0.6 mg. Hence, the concentration of thearubigins in the tea infusion is roughly estimated to be 3.6 mg/mL. In a typical experiment, the OD of the reaction mixture at 0.016 relative concentration was 0.99 ± 0.03 according to the turbidity analysis (Fig. 4). Based on the weight after complete evaporation, the concentration of thearubigins in the final reaction mixture was estimated as 58 ug/mL. Figure 5 shows that thearubigins at 30 µg/mL resulted in aggregation with an OD of 0.98 ± 0.05. At greater than 40 µg/mL of thearubigins, the sediments were coagulated and spaces were produced in the solutions, resulting in apparent reduced aggregation activity. These results indicate that thearubigins in the black tea infusions were sufficient to singly cause aggregation after interaction with phospholipid vesicles. In conclusion, it will be possible to evaluate the roles of thearubigins in astringency, inhibition of cholesterol absorption, and viral inactivation at the estimated concentrations of thearubigins in the black tea infusions, from the viewpoint of molecular interaction with phospholipid vesicles. Future studies should take into account the conditions of daily diets and the gastrointestinal tract, such as pH, ionic strength, and the presence of food components.

Acknowledgements This work was supported in part by the Japanese Society for the Promotion of Science (KAKENHI 18K05525 to T.N.). We thank the Japan Tea Association for financial support and preparation of the black tea leaves from Sri Lanka. Mitsui Norin Co., Ltd. (Shizuoka, Japan) is acknowledged for providing the authentic catechins and TFs.
Conflict of interest There are no conflicts of interest to declare.
Abbreviations
BOPF
Broken Orange Pekoe Fannings
EC
epicatechin
EGC
epigallocatechin
ECg
epicatechin gallate
EGCg
epigallocatechin gallate
EZR
easy R
DPPC
dipalmitoyl phosphatidylcholine
OD
optical density
PC
phosphatidylcholine
SPE
solid-phase extraction
TFs
theaflavins
TF1
theaflavin
TF2A
theaflavin-3-O-gallate
TF2B
theaflavin-3′-O-gallate
TF3
theaflavin-3,3′-di-O-gallate
Table S1 Adjusted p-values for ODs in Fig. 2
| Concentration (µM) |
|
Adjusted p-value |
|
|
TF2A-TF2B |
TF2A-TF3 |
TF2B-TF3 |
| 0 |
0.102 |
0.491 |
0.449 |
| 20 |
0.106 |
0.002 |
0.019 |
| 40 |
0.036 |
0.042 |
0.001 |
| 80 |
0.000 |
0.555 |
0.000 |
| 120 |
0.021 |
0.294 |
0.004 |
| 160 |
0.428 |
0.320 |
0.060 |
Table S2 Adjusted p-values for ODs in Fig. 3
| Concentration |
|
|
|
|
Adjusted p-value |
|
|
|
|
|
| (µM) |
EGC-EC |
EGC-EGCg |
EGC-ECg |
EGC-TF1 |
EC-EGCg |
EC-ECg |
EC-TF1 |
EGCg-ECg |
EGCg-TF1 |
ECg-TF1 |
| 0 |
0.758 |
0.013 |
0.011 |
0.995 |
0.082 |
0.071 |
0.919 |
1.000 |
0.023 |
0.020 |
| 120 |
0.953 |
0.020 |
0.256 |
0.007 |
0.059 |
0.585 |
0.019 |
0.484 |
0.946 |
0.191 |
| 240 |
0.464 |
0.001 |
0.819 |
0.000 |
0.000 |
0.108 |
0.000 |
0.005 |
0.000 |
0.000 |
| 360 |
0.003 |
0.000 |
0.000 |
0.000 |
0.000 |
0.000 |
0.000 |
0.010 |
0.008 |
0.000 |
| 480 |
0.998 |
0.000 |
0.000 |
0.000 |
0.000 |
0.000 |
0.000 |
0.042 |
0.608 |
0.358 |
| 600 |
0.995 |
0.000 |
0.000 |
0.000 |
0.000 |
0.000 |
0.000 |
0.000 |
0.053 |
0.015 |
References
- Iijima, M., Kawaguchi, A., Ogura, Y., Yoshimoto, R., Kaneda, M., Kera, K., Kuroda, S., and Nakayama, T. (2022). Nano-visualization of the in vitro antiviral activity of black tea based on production area using a liposome-based virus membrane model. Biosci. Biotechnol. Biochem., 86, 1658–1669.
- Ikeda, I., Yamahira, T., Kato, M., and Ishikawa, A. (2010). Black-tea polyphenols decrease micellar solubility of cholesterol in vitro and intestinal absorption of cholesterol in rats. J. Agric. Food Chem., 58, 8591–8595.
- Ishimoto, K., Hatanaka, N., Otani, S., Maeda, S., Xu, B., Yasugi, M., Moore, J.E., Suzuki, M., Nakagawa, S., and Yamasaki, S. (2021). Tea crude extracts effectively inactivate severe acute respiratory syndrome coronavirus 2. Lett. Appl. Microbiol., 74, 2–7.
- Kanda, Y. (2013). Investigation of the freely available easy-to-use software “EZR” for medical statistics. Bone Marrow Transplant., 48, 452–458.
- Lung, J., Lin, Y.S., Yang Y.H., Chou, Y.L., Shu, L.H., Cheng, Y.C., Liu, H.T., and Wu, C.Y. (2020). The potential chemical structure of anti-SARS-CoV-2 RNA-dependent RNA polymerase. J. Med. Virol., 2020, 1–5.
- Matsuura, K., Usui, Y., Kan, T., Ishii, T., Nakayama, T. (2014). Structural specificity of electric potentials in the coulometric array analysis of catechins and theaflavins. J. Clin. Biochem. Nutr., 55, 103–109.
- Mhatre, S., Srivastava, T., Naik, S., and Patravale, V. (2021). Antiviral activity of green tea and black tea polyphenols in prophylaxis and treatment of COVID-19: A review, Phytomedicine, 85, 153286.
- Miyata, Y., Tanaka, T., Tamaya, K., Matsui, T., Tamaru, S., and Tanaka, K. (2011). Cholesterol-lowering effect of black tea polyphenols, theaflavins, theasinensin A and thearubigins, in rats fed high fat diet. Food. Sci. Technol. Res., 17, 585–588.
- Nakayama, M., Suzuki, K., Toda, M., Okubo, S., Hara, Y., and Shimamura, T. (1993). Inhibition of the infectivity of influenza virus by tea polyphenols. Antiviral Res., 21, 289–299.
- Narai-Kanayama, A., Saruwatari, K., Mori, N., and Nakayama, T. (2018). Theaflavin-3-gallate specifically interacts with phosphatidylcholine, forming a precipitate resistant against the detergent action of bile salt. Biosci. Biotechnol. Biochem., 82, 466–475.
- Narai-Kanayama, A., Uekusa, Y., Kiuchi, F., and Nakayama, T. (2018). Efficient synthesis of theaflavin 3-gallate by a tyrosinase-catalyzed reaction with (-)-epicatechin and (-)-epigallocatechin gallate in a 1-octanol/buffer biphasic system. J. Agric. Food Chem., 66, 13464–13472.
- Nguyen, H.N., Tanaka, M., Li, B., Ueno, T., Matsuda, H., and Matsui, T. (2019). Novel in situ visualisation of rat intestinal absorption of polyphenols via matrix-assisted laser desorption/ionisation mass spectrometry imaging. Sci. Rep., 9, 3166.
- Reis, A., Soares, S., Sousa C.F., Dias, R., Gameiro, P., Soares, S., and De Freitas, V. (2020). Interaction of polyphenols with model membranes: Putative implications to mouthfeel perception. Biochim. Biophys. Acta, 1862, 183133.
- Saito, A., Nakazato, R., Suhara, Y., Shibata, M., Fukui, T., Ishii, T., Asanuma, T., Mochizuki, K., Nakayama, T., Osakabe, N. (2016). The impact of theaflavins on systemic-and microcirculation alterations. The murine and randomized feasibility trials. Journal of Nutritional Biochemistry, 32, 107–114.
- Takashima, Y., Ishikawa, K., Miyawaki, R., Ogawa, M., Ishii, T., Misaka, T., and Kobayashi, S. (2021). Modulatory effect of theaflavins on apical sodium-dependent bile acid transporter (ASBT) activity. J. Agric. Food Chem., 69, 9585–9596.
- Vermeer, M.A., Mulder, T.P.J., and Molhuizen, H.O.F. (2008). Theaflavins from black tea, especially theaflavin-3-gallate, reduce the incorporation of cholesterol into mixed micelles. J. Agric. Food Chem., 56, 12031–12036.
- Wang, W., Zhang, S., Lv, L., and Sang, S. (2018). A new method to prepare and redefine black tea thearubigins. J. Chromatogr. A., 1563, 82–88.
- Zhu, K., Ouyang J., Huang, J., and Liu, Z. (2021). Research progress of black tea thearubigins: a review. Crit. Rev. Food Sci. Nutr., 61, 1556–1566.

