Original papers
Pyroglutamylproline purified from fermented barley extract increases ABCG2 expression in Caco-2 cells
2023 Volume 29 Issue 4 Pages 309-318

Details
2023 Volume 29 Issue 4 Pages 309-318
Fermented barley extract P (FBEP) prepared from barley shochu distillation by-product has been reported to lower serum uric acid (UA) by increasing urinary excretion of UA. ATP-binding cassette subfamily G member 2 (ABCG2) is a transporter responsible for UA efflux from the intestinal tract and kidneys. This study aimed to identify, among the compounds isolated from FBEP using high-performance liquid chromatography, the components that promote ABCG2 expression in Caco-2 cells. Pyroglutamylproline (pEP) increased the expression of ABCG2 in Caco-2 cells at the gene and protein levels. These results suggest that the pEP contained in FBEP may decrease serum UA levels by increasing the expression of urate efflux transporters in the intestinal epithelium and promoting UA excretion.
The theoretical limit of serum uric acid (UA) solubility is 6.8 mg/dL (Saito et al., 2021). Hyperuricemia is diagnosed when the serum UA level exceeds 7.0 mg/dL (Kojima et al., 2019). Uric acid is a metabolite of purines. Meat and seafood contain high levels of purines, which, if consumed in excess, can lead to hyperuricemia (Choi et al., 2005). Hyperuricemia is followed by gout, a disease in which insoluble UA crystallizes in the blood (UA crystals) and is deposited in joints, causing severe pain (Clebak et al., 2020).
The causes of hyperuricemia can be classified broadly as involving increased UA production, decreased UA excretion, or a combination of the two (Sun et al., 2014). Of the UA excreted, 70 % is excreted by the kidneys and the remaining 30 % by the intestinal tract (Eckenstaler and Benndorf, 2021). The main urate transporter in the kidney is urate transporter (URAT) 1, while that in the kidney and intestinal tract is ATP-binding cassette subfamily G member 2 [ABCG2, BCRP (breast cancer resistance protein), Ichida et al., 2012]. It has been reported that the administration of Smilax glabra Roxb., a Chinese herbal remedy for gout, in rats with UA nephropathy promotes UA excretion by increasing the expression of ABCG2 (Wan et al., 2019).
When fermented barley extract P (FBEP), which is the supernatant of barley shochu distillation residue, was administered to a hyperuricemic rat model, serum UA levels were decreased by promoting UA elimination (Hokazono et al., 2010a). In addition, when humans with serum UA levels of 6.0 to 7.9 mg/dL were provided with a drink containing 2 g/day of FBEP, the serum UA level in the test group changed by −0.21 ± 0.56 mg/dL compared to the placebo group (+ 0.02 ± 0.54 mg/dL) after 12 weeks, a significant decrease (Hokazono et al., 2010b). Therefore, we screened for the active component in FBEP that promotes UA elimination.
Human colon carcinoma-derived cells (Caco-2) have been widely used to study the function of ABCG2 in the intestinal tract (Ogura et al., 2012). In this study, we evaluated the effects of the purified fractions and compounds from FBEP on ABCG2 gene and protein expression in Caco-2 cells.
Materials A barley shochu distillation by-product was provided by Sanwa Shurui Co., Ltd. (Oita, Japan). FBE was produced by filtering the by-product as described previously (Hokazono et al., 2010a).
After passing 600 L of FBE through a Diaion® HP-20 column, the adsorbed substances (FBEP20, 40, and 60) were eluted by sequentially adding 120 L of 20, 40, and 60 % (v/v) ethanol (Maruoka et al., 2020). FBEP20, 40, and 60 were evaporated under reduced pressure to remove ethanol and the samples were then lyophilized before storage at 4 °C in a refrigerator.
After applying 10 L of FBE to an Amberlite FPX66TM column, trapped material was eluted with 1 % (w/v) sodium hydroxide (Hokazono et al., 2010a). Eluted fractions were applied to an Amberlite IRC76 TM hydrogen-form column (Hokazono et al., 2010a). The pass-through fraction was FBEP. FBEP powder was produced by drying the fraction in a vacuum drum dryer and the resulting powder was stored at room temperature.
High-performance liquid chromatography (HPLC) separation of ABCG2 expression- promoting fractions FBEP60 was subjected to HPLC analysis using a Prominence System with an SPD-20A ultraviolet detector (Shimadzu Corporation, Kyoto, Japan) equipped with a Synergi® 4 µm Hydro-RP 80 Å column (250 × 21.2 mm; Phenomenex, Inc., Torrance, CA, USA). The mobile phase consisted of 0.1 % trifluoroacetic acid (A) and acetonitrile (B). Gradient elution was achieved with 10% B, which was increased to 30 % by 60 min. Then, 1 g of FBEP60 dissolved in 5 mL of ultrapure water was filtered through a 0.45-µm filter (Minisart Syringe Filter S6555FMQ, Sartorius AG, Göttingen, Germany) and injected into the HPLC at a flow rate of 10 mL/min. Purification was performed by UV absorbance detection at 210 nm. A total of seven fractions were collected.
FBEP60-4 was also subjected to HPLC analysis, but gradient elution was achieved with 10 % B, increasing to 15 % by 40 min. Then, 50 mg of FBEP60-4 dissolved in 1 mL of ultrapure water was injected. A total of six fractions were collected.
These fractions were evaporated under reduced pressure to remove the mobile phase and dried. The dried sample for HPLC was dissolved in 1 mL of ultrapure water and the sample for the cell experiments was dissolved in 1 mL of PBS (-).
Liquid chromatography-tandem mass spectrometry (LC-MS) analysis of the purified ABCG2 expression-promoting single compound The purified ABCG2 expression-promoting single compound (FBEP-60-4-6, 1 mg) was prepared for LC-MS analysis by dissolving in 300 µL ultrapure water. An ACQUITY ultra high performance liquid chromatography (UPLC) system (Waters Corporation, Milford, MA, USA) was used. The column was a Unison UK-C18 UP 2 × 100 mm (Imtakt Corporation, Kyoto, Japan), heated to 40 °C. The mobile phase consisted of 0.1% formic acid solution (A) and acetonitrile (B). Gradient elution was achieved using B at a concentration of 5 % at the start of the analysis, 12.5 % after 5 min, and 100 % from 6 to 10 min. The flow rate was 0.4 mL/min, and 0.1 µL of the sample was injected. A Synapt G2-S (Waters Corporation) was used as the MS apparatus, with the electrospray ionization method.
Nuclear magnetic resonance (NMR) analysis of the purified ABCG2 expression-promoting single compound For NMR analysis, the purified ABCG2 expression-promoting single compound (1 mg) was prepared by dissolving in 700 µL deuterium oxide (99.8 %, FUJIFILM Wako Pure Chemical Corporation, Osaka, Japan). The NMR analysis was performed using a liquid-phase cryoporometry NMR system (AVANCE NEO 600, Bruker Corporation, Billerica, MA, USA). The measurement nucleus was 1H, 13C, and the measurement solvent was deuterium oxide (99.8 %, FUJIFILM Wako Pure Chemical Corporation). Trimethylsilylpropanoic acid was used as an external reference (0 ppm). Similarly, chemically synthesized pyroglutamylproline (pEP, 99.2 % purity, GenScript Corp., Jiangsu, China) was also subjected to NMR analysis.
LC-MS/MS analysis of pEP concentration in FBEP powder Chemically synthesized pEP (99.2% purity, GenScript Corp.) was used as a standard. A 10-mg portion of pEP standard was weighed precisely, dissolved in water, and diluted to 100 mL (100 mg/L). Then, 1 mL of the standard stock solution was diluted in water to a constant volume of 100 mL (1 mg/L), and standard solutions for measurements of 0.1, 0.05, 0.025, 0.012 5, and 0.006 25 mg/L were prepared by diluting the solution with water.
A 0.15-g portion of FBEP powder was weighed precisely and placed in a 50 mL volumetric female flask. A 25-mL volume of water was added and the mixture was sonicated for 5 min to dissolve the powder. The volume was adjusted to 50 mL with water, filtered through a 0.20-µm filter (Minisart Syringe Filter SM16534K, Sartorius AG), and diluted accordingly to make the test solutions.
An LC-2030 (Shimadzu Co., Ltd.) liquid chromatography system was used. The column was a TSKgel ODS-100V (φ2.0 × 150 mm, 3 µm, TOSOH Corporation, Tokyo, Japan) heated to 40 °C. The mobile phase consisted of 0.1 % formic acid solution (A) and acetonitrile solution containing 0.1 % formic acid (B). Gradient elution was achieved with B at a concentration of 5 % at the beginning of the analysis, 10 % after 5 min, 10 % during 5–7 min, and 95 % during 7.5–12 min. The flow rate was 0.25 mL/min, and 2 µL of the sample was injected. pEP concentrations were determined by multiple reaction monitoring mode scans with electrospray ionization using an LCMS-8050 spectrometer (Shimadzu Co., Ltd.).
The peak in the test solution that corresponded to the retention time of pEP in the standard solution was designated as pEP, and the concentration of pEP in FBEP powder (g/100 g) was determined.
Cells and cell culture Fractions and pEP samples were dissolved in PBS (-) and filtered through a 0.20-µm filter (Minisart Syringe Filter SM16534K).
Caco-2 cells were purchased from KAC Co., Ltd. (Kyoto, Japan).
For the cell proliferation assay, the cells were seeded at a density of 1.5 × 10⁴/cm2 in 0.1 mL of Dulbecco's modified Eagle's medium - low glucose D6046 (DMEM, Sigma-Aldrich, St. Louis, MO, USA) supplemented with 10 % fetal bovine serum (Sigma-Aldrich) and 1 % penicillin-streptomycin-glutamine (100×, Thermo Fisher Scientific, Waltham, MA, USA), which was used as the growth medium, in 96-well plates Cells were universally cultured at 37 °C and 5 % CO2. After reaching cell confluence, the medium was replaced with DMEM containing 0.5 % fetal bovine serum and 1 % penicillin-streptomycin (the evaluation test medium) in all evaluation tests. pEP dissolved in PBS (-) was added to the evaluation test medium at final concentrations of 0.1, 1, 10, and 100 µg/mL. The final concentration of PBS (-) in the evaluation test medium was 10 % (v/v) in all evaluation tests. The evaluation test medium containing the samples was changed every 24 h in all tests. After 5 d of daily changes of the pEP-containing medium, cells were used for cell proliferation studies.
For RNA analysis and Western blotting, the cells were seeded at a density of 2 × 10⁴/cm2 containing 1 mL of the growth medium in 24-well plates. After reaching cell confluence, FBEP20, 40, and 60 dissolved in PBS (-) were added to the evaluation test medium at a final concentration of 2 000 µg/mL. Similarly, after reaching cell confluence, FBEP60-1, 2, 3, 4, 5, 6, and 7 dissolved in PBS (-) were added to the evaluation test medium at final concentration of 100 µg/mL. FBEP60-4-1, 2, 3, 4, 5, and 6 dissolved in PBS (-) were added to the evaluation test medium at final concentration of 0.5 µg/mL. pEP dissolved in PBS (-) was added to the evaluation test medium at final concentrations of 0.1, 1, and 10 µg/mL. After 5 d of daily changes of the sample-containing medium, cells were used for mRNA analysis. After 7 d of daily changes of the sample-containing medium, the samples were used for Western blotting.
For immunohistochemical analysis, the cells were seeded at a density of 2 × 10⁴ /cm2 containing 0.2 mL of the growth medium in a Labtech II chamber slide system 154534JP (Thermo Fisher Scientific). After reaching cell confluence, pEP dissolved in PBS (-) was added to the evaluation test medium at final concentrations of 0.1, 1, and 10 µg/mL. After 7 d of daily changes of the sample-containing medium, the cells were subjected to immunofluorescent staining.
Cell proliferation assay Cell viability was determined using a Cell Counting Kit-8 (Dojindo, Kumamoto, Japan) and performed according to the manufacturer's instructions. The absorbance of each well was measured at 450 nm using a 2 300 EnSpire Multilabel Plate Reader (PerkinElmer, Waltham, MA, USA), normalized to the control.
Real-time quantitative polymerase chain reaction (PCR) Total RNA was isolated from cells using a TRIzol Plus RNA Purification kit (Thermo Fisher Scientific) according to the manufacturer's instructions. Reverse transcription was carried out using SuperScript IV VILO Master Mix with ezDNase Enzyme (Thermo Fisher Scientific) and random primers, and the resulting single-stranded cDNA was PCR-amplified using gene-specific primers. For mRNA quantification, real-time PCR was performed using a LightCycler® 96 System (Roche, Basel, Switzerland). The thermal cycler conditions consisted of 1 cycle at 95 °C for 10 min, and 45 cycles at 95 °C for 10 s, 60 °C for 10 s, and 72 °C for 10 s. The relative mRNA expression levels were normalized to the GAPDH gene using the comparative threshold cycle method. The sets of primers used in this study were as follows: GAPDH forward, 5′-GGTGAAGGTCGGAGTCAACGGA-3′; GAPDH reverse, 5′-GAGGGATCTCGCTCCTGGAAGA-3′, and ABCG2 forward, 5′- CAGGTGGAGGCAAATCTTCGT-3′; ABCG2 reverse, 5′-ACCCTGTTAATCCGT TCGTTTT-3′.
Western blotting Cell supernatants were removed, and proteins were extracted with M-PER™ Mammalian Protein Extraction Reagent supplemented with a protein and phosphatase inhibitor cocktail (Thermo Fisher Scientific). The protein content was measured by the Bradford assay (Thermo Fisher Scientific). The sample volume was determined to contain 20 µg of protein per well. After adding the Bolt LDL Sample Buffer and Reducing Agent, the protein extracts were heated at 70 °C for 10 min. A Bolt™ 4–12 % Bis-Tris Mini Protein Gel was loaded with protein extracts and electrophoresed using Bolt MES SDS Running Buffer (200 V, 22 min, Thermo Fisher Scientific). The gel was transferred onto a polyvinylidene fluoride membrane (PVDF, iBlot2 drive-rotating system, Thermo Fisher Scientific). Using the iBind Western System (Thermo Fisher Scientific), GAPDH and ABCG2 proteins were subjected to antigen-antibody reactions. The primary antibodies were GAPDH polyclonal antibody 10494-1-AP (Proteintech Group Inc., Rosemont, IL, USA) and ABCG2 antibody (B-1): sc-377176 (Santa Cruz Biotechnology, Inc., Dallas, TX, USA). The secondary antibodies were goat anti-rabbit or anti-mouse IgG (H + L) (HRP, Thermo Fisher Scientific). The concentration of each antibody used was determined based on the manufacturer's instructions. After washing with deionized water, the membrane was reacted with the two reagents from the SuperSignal West Dura kit (Thermo Fisher Scientific) for 5 min. The membrane was then inserted into a ChemiDoc XRS+ system for imaging (Bio-Rad Laboratories, Hercules, CA, USA), and the detected bands were quantified using Image Lab™ 5.0 software (Bio-Rad Laboratories). Relative protein expression levels were normalized to the GAPDH protein.
| (A) | |||||||
| Control | FBEP20 | FBEP40 | FBEP60 | ||||
| 1.051 ± 0.356b | 0.798 ± 0.250b | 0.97 ± 0.480b | 1.631 ± 0.369a | ||||
| (B) | |||||||
| Control | FBEP60-1 | FBEP60-2 | FBEP60-3 | FBEP60-4 | FBEP60-5 | FBEP60-6 | FBEP60-7 |
| 1.006 ± 0.119b | 1.001 ± 0.087b | 0.971 ± 0.084b | 0.767 ± 0.074c | 1.309 ± 0.093a | 1.032 ± 0.094b | 1.065 ± 0.178b | 1.006 ± 0.134b |
| (C) | |||||||
| Control | FBEP60-4-1 | FBEP60-4-2 | FBEP60-4-3 | FBEP60-4-4 | FBEP60-4-5 | FBEP60-4-6 | |
| 0.952 ± 0.115b | 0.909 ± 0.113b | 0.991 ± 0.092b | 0.972 ± 0.152b | 0.969 ± 0.074b | 0.974 ± 0.132b | 1.139 ± 0.053a | |
The fraction (A), (B), and (C) dissolved in PBS (-) were added to the medium at final concentrations of 2 000 mg/mL, 100 mg/mL, and 0.5 mg/mL, and the final concentration of PBS (-) in the medium was 10 % (v/v). Cells were cultured for 5 d, changing the medium every 24 h. The expression level of ABCG2 transcripts was analyzed using real-time PCR, normalized to the GAPDH gene. (A) shows the results of FBEP20, 40 and 60. (B) shows the results of FBEP60-1, 2, 3, 4, 5, 6 and 7. (C) shows the results of FBEP60-4-1, 2, 3, 4, 5 and 6. Each value is expressed as the mean ± SD of three independent experiments. Different letters (a, b, or c) indicate significant differences (p < 0.05) in each experiment.
Immunohistochemical analysis Adherent cells on the slide were fixed with 1 % (v/v) formalin in PBS (-) for 10 min at room temperature. After washing with PBS (-), the cells were blocked with Blocking One Histo (Nacalai Tesque, Osaka, Japan) for 5 min at room temperature. After washing with PBS (-), cells were permeabilized with 0.5 % Triton X-100 for 3 min at room temperature. After removal of 0.5 % Triton X-100, the primary antibody, ABCG2 antibody (B-1): sc-377176 (Santa Cruz Biotechnology) was added at 0.2 mL/well and allowed to react for 1 h at room temperature. The primary and secondary antibody concentrations were determined based on the manufacturer's instructions. The negative control was incubated with Blocking One Histo instead of the ABCG2 antibody. After washing with PBS (-), all wells were incubated with 0.2 mL/well of goat anti-mouse IgG (H + L) (GOAT) cross-adsorbed secondary antibody (Alexa Fluor 488, Thermo Fisher Scientific) and left for 30 min at room temperature. After washing with PBS (-), the gasket was removed and the cells were mounted using ProLong Gold Antifade Mountant (Thermo Fisher Scientific) with 2-(4-Amidinophenyl)-1H-indole-6-carboxamidine (DAPI) for counterstaining of cell nuclei. Cells were covered with glass cover slips and left overnight, and ABCG2 localization was visualized under a fluorescence microscope (BX-53, EVIDENT Corp., Tokyo, Japan) with Lumina Vision Ver.3.7.4.2 imaging software (MITANI Corp., Tokyo, Japan).
Statistical analysis All of the results are presented as means ± standard deviations of three independent experiments. The Shapiro-Wilk test was used to estimate the distribution of variables. The Bartlett test was used to check for equal variances. The Tukey-Kramer test was applied to evaluate significant differences with normal data distributions for equal variances (Ludbrook, 1998). The Steel-Dwass test was used in the other cases. P values < 0.05 were considered to be statistically significant. All calculations were performed using R v4.2.1 (R Development Core Team, New Zealand, Ihaka and Gentleman, 1996).
Identification of fractions that promote ABCG2 expression To identify fractions containing the ABCG2 mRNA expression promoter, the effects of FBEP20, 40, and 60 on ABCG2 mRNA expression in Caco-2 cells were confirmed by real-time PCR. FBEP60 showed about 1.6-fold higher expression than the control, FBEP20, and 40 [Table (A)], which was a significant increase (p < 0.05).
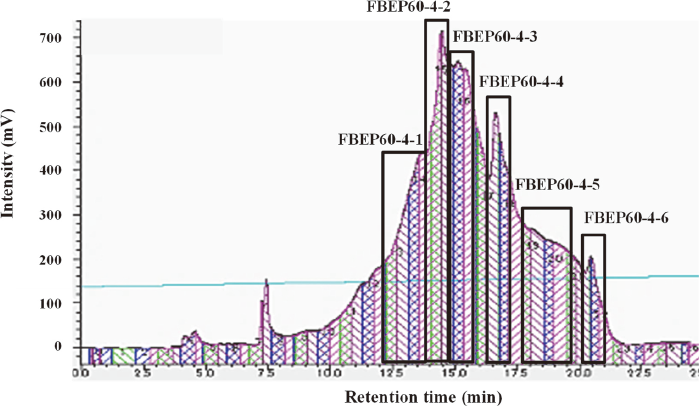
For further refinement, FBEP60 was subjected to HPLC and fractionated into 7 fractions (FBEP60-1, 2, 3, 4, 5, 6, and 7) which were collected as shown in Fig. 1. FBEP60-4 showed about 1.3 times higher ABCG2 mRNA expression than the control and the other fractions [Table (B)], which was a significant increase (p < 0.05).

High-performance liquid chromatography (HPLC) chromatogram of FBEP60.
FBEP60 was subjected to HPLC. The mobile phase consisted of 0.1 % trifluoroacetic acid (A) and acetonitrile (B). Gradient elution was achieved with 10 % B, increasing to 30 % by 60 min. The flow rate was 10 mL/min and 1 g of FBEP60 was injected. Purification was performed by UV absorbance detection at 210 nm. Seven fractions (FBEP60-1, 2, 3, 4, 5, 6, and 7) were collected, as indicated by boxes.
FBEP60-4 was further separated into 6 fractions (FBEP60-4-1, 2, 3, 4, 5, and 6) by HPLC (Fig. 2). FBEP60-4-6 showed about 1.1 times higher ABCG2 mRNA expression than the control and the other fractions [Table (C)], which was a significant increase (p < 0.05). FBEP60-4-6 was subjected to HPLC under the same conditions and a single peak was confirmed. Therefore, FBEP60-4-6 was determined to be the ABCG2 mRNA expression promoter.
High-performance liquid chromatography (HPLC) chromatogram of FBEP60-4.
FBEP60-4 was subjected to HPLC. The mobile phase consisted of 0.1 % trifluoroacetic acid (A) and acetonitrile (B). Gradient elution was achieved with 10 % B, increasing to 15 % by 40 min. The flow rate was 10 mL/min and 50 mg of FBEP60-4 dissolved in 1 mL of ultrapure water was injected. Purification was performed by UV absorbance detection at 210 nm. Six fractions (FBEP60-4-1, 2, 3, 4, 5, and 6) were collected, as indicated by boxes.
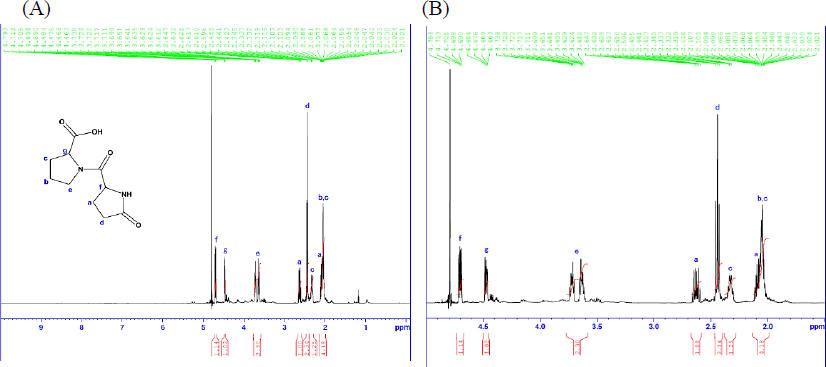
Identification of component that promotes ABCG2 expression To identify purified ABCG2 expression-promoting single compounds, FBEP60-4-6, was analyzed using LC-MS; the resulting mass spectrum (Supplemental Fig. 1) revealed (M + H)+ and (2M + H)+ values of 227.103 7 and 453.198 7, respectively. From the product ion spectrum (Supplemental Fig. 2), the precursor ion was found to be 227.103 2. From the exact mass, it was estimated to be pEP, the compositional formula of which is C10H15N2O4. The structure of the purified ABCG2 expression-promoting single compound was also determined by MS/MS product ion spectroscopy, and the results were consistent with those for pEP. Next, based on the compositional formula estimated by LC-MS, we performed structural analysis using various NMR techniques. Assignment of 1H and 13C NMR signals (Supplemental Fig. 3 and 4) was based on 1H-1H correlation spectroscopy (Supplemental Fig. 5, “COSY”), heteronuclear single quantum coherence (Supplemental Fig. 6, “HSQC”), and heteronuclear multiple bond correlation (Supplemental Fig. 7, “HMBC”). The presumptive structure of the purified ABCG2 expression-promoting single compound is shown in Fig. 3. Furthermore, NMR signals of the chemically synthesized pEP (Supplemental Figs. 8 and 9) were compared to those of the purified pEP. Based on these results, we concluded that pEP is the component in FBEP that promotes ABCG2 expression.

Putative structure of the purified ABCG2 expression-promoting single compound identified by nuclear magnetic resonance analysis.
Concentration of pEP in FBEP powder Analysis was performed by LC-MS/MS to confirm the pEP concentration contained in the FBEP powder. The concentration of pEP was found to be 0.6 g/100 g. The pEP concentration of the fractions FBEP20, 40, and 60 was not determined.
Effect of pEP on Caco-2 cell proliferation To clarify the cytotoxicity of pEP, we examined its growth inhibitory effect on Caco-2 cells. The proliferation rate after addition of pEP to cells at concentrations of 0.1–100 µg/mL was expressed as absorbance at 450 nm (Fig. 4). The values obtained for all concentrations of pEP were not statistically different from those of the control.

Effect of pyroglutamylproline (pEP) on Caco-2 cell proliferation.
Cells were cultured for 5 d with 0.1–100 µg/mL pEP, changing the medium every 24 h. Absorbance at 450 nm was measured using a commercial kit, normalized to the control and quantified. Each data point represents the mean ± SD of three independent experiments.
Effect of pEP on ABCG2 mRNA expression in Caco-2 cells To confirm the effect of pEP on the ABCG2 gene, we examined ABCG2 mRNA expression using Caco-2 cells. We exposed Caco-2 cells to 0.1–10 µg/mL of pEP and measured the expression levels of ABCG2 mRNA by real-time PCR (Fig. 5). Concentrations of more than 1 µg/mL pEP significantly promoted the gene expression of ABCG2 (p < 0.05).

Effects of pEP on ABCG2 mRNA expression in Caco-2 cells.
Cells were cultured for 5 days with 0.1–10 µg/mL of pEP, changing the medium every 24 h. The expression level of ABCG2 transcripts was analyzed using real-time PCR, normalized to the GAPDH gene. Each data point represents the mean ± SD of three independent experiments. Different letters (a or b) above the columns indicate significant differences (p < 0.05).
Effect of pEP on ABCG2 protein expression (Western blotting) in Caco-2 cells To confirm the effect of pEP on ABCG2 protein expression, we exposed Caco-2 cells to 0.1–10 µg/mL of pEP and measured the expression levels of ABCG2 protein by Western blotting (Fig. 6). Concentrations of more than 1 µg/mL pEP significantly promoted the protein expression levels of ABCG2 (p < 0.05).

Effects of pEP on ABCG2 protein expression in Caco-2 cells by Western blotting.
Cells were cultured for 7 d with 0.1–10 µg/mL of pEP, changing the medium every 24 h. ABCG2 protein levels in Caco-2 cells were analyzed by Western blotting. The relative protein expression levels were normalized to the GAPDH protein. Each data point represents the mean ± SD of three independent experiments. Different letters (a or b) above the columns indicate significant differences (p < 0.05).
Effect of pEP on ABCG2 protein expression by immunohistochemical analysis in Caco-2 cells To visually confirm the expression of ABCG2 protein in native Caco-2 cells, immunostaining was performed. Caco-2 cells were exposed to 0.1–10 µg/mL pEP, then immunostained and observed using fluorescence microscopy. As shown in Fig. 7 (DAPI staining image), the presence of cells was confirmed by nuclear staining. The expression of ABCG2 protein in Caco-2 cells was visually confirmed (Fig. 7, ABCG2 staining image). In the composite image of nuclear and ABCG2 imaging (Fig. 7, merged image), ABCG2 protein was expressed both on and outside the nucleus, confirming its expression on the cell membrane. In the negative control, imaging detected only nuclei, i.e., ABCG2 staining was negative, with merged images showing only nuclei (Fig. 7). Moreover, it was confirmed that the secondary antibody does not bind to cell components in a non-specific manner; thus, false positives and non-specific binding did not occur.

Effects of pEP on ABCG2 protein expression in Caco-2 cells by immunohistochemical analysis.
Cells were cultured for 7 d with 0.1–10 µg/mL of pEP, changing the medium every 24 h. Cells were immunostained and observed by fluorescence microscopy. The negative control was determined using only the secondary antibody. Cells were stained with 2-(4-Amidinophenyl)-1H-indole-6-carboxamidine (DAPI) for nuclear counterstaining, with anti-ABCG2 antibody (ABCG2), and merged (merge). Scale bar, 50 µm.
In cell experiments to determine ABCG2 expression-promoting fractions, the relative expression levels of ABCG2 mRNA were (A) FBEP60; 1.631, (B) FBEP60-4; 1.309, and (C) FBEP60-4-6; 1.139. The promoting effect of ABCG2 expression decreased as the fractionation progressed from (A) to (B) and from (B) to (C). The final concentrations of FBEP20, 40, and 60 powders (A) and HPLC fractionated powders (B) and (C) exposed to cells were (A) 2 000 µg/mL, (B) 100 µg/mL, and (C) 0.5 µg/mL, implying that the concentrations of each fractional dry powder, not the concentrations of pEP. Caco-2 cells were exposed to decreased as the degree of purification increased. As a result, it is speculated that the higher the degree of purification, the lower the amount of ABCG2 expression-promoting component contained in the fraction, resulting in a lower ABCG2 expression-promoting effect.
It has been reported that the intake of FBEP lowers serum UA levels (Hokazono et al., 2010b). Therefore, we screened for urate excretion-promoting substances in FBEP using the expression level of ABCG2, one of the transporters involved in UA excretion, as an evaluation index. The results showed that the ABCG2 expression-promoting component in FBEP was pEP, and FBEP powder contained 0.6 % (w/w) pEP. pEP was discovered as a key compound in the Maillard reaction of peanut peptides and has been reported to have high umami intensity and umami enhancing activity (Zhang et al., 2019). It has also been reported that pEP purified from hydrolyzed mushroom proteins enhances the taste of saltiness (Moore et al., 2021). However, there are no reports on the physiological functionality of pEP.
Pyroglutamylleucine (pEL), a peptide found in fermented foods, attenuates dysbiosis by increasing host antimicrobial peptides (Shirako et al., 2019). It has also been reported that 19 pyroglutamyl peptides have been identified in sake, with pEL and pyroglutamylglutamine being particularly abundant (Kiyono et al., 2013). Although pEL was not produced by yeast inoculated into preheated mash, digestion of steamed rice using Aspergillus oryzae proteases increased the pEL content (Kiyono et al., 2013). On the other hand, the FBEP used in this study was derived from a barley koji-fermented liquid, which is digested by Aspergillus luchuensis mut. kawachii proteases. In other words, like pEL, pEP might be one of the compounds produced when barley is digested by koji mold proteases. However, the mechanism of pEP formation needs to be explored in future studies.
It has been reported that ABCG2 is expressed in unstimulated Caco-2 cells (Gheytanchi et al., 2021). In the present study, pEP at 0.1–100 µg/mL did not affect Caco-2 cell proliferation, which means that pEP did not show cytotoxicity at these concentrations. Therefore, additional experiments were performed using these concentrations. Next, the effect of pEP exposure (0.1–10 µg/mL) to unstimulated Caco-2 cells on the expression levels of ABCG2 was assessed. The results showed that 1–10 µg/mL pEP promoted ABCG2 mRNA and protein expression. In 5/6 nephrectomy model rats, there was decreased urinary UA excretion, no increase in serum UA, and overexpression of ABCG2 in the ileum (Yano et al., 2014). Yano et al. (2014) concluded that the fact that serum UA did not increase despite decreased urinary UA excretion was due to increased ABCG2 expression in the ileum, an extrarenal excretion pathway that supports UA excretion. In this study, pEP increased ABCG2 expression in Caco-2 cells, suggesting that the urate excretion promoter contained in FBEP is pEP and that it acts to increase urate excretion by intestinal ABCG2.
Immunohistochemical analysis in this study visually confirmed the expression of ABCG2 protein on the plasma membrane of Caco-2 cells. Mozner et al. (2019) reported that human ABCG2 is a key plasma membrane transporter involved in urate excretion. On the other hand, for orally ingested peptides to be absorbed, they must be transported across the plasma membrane of intestinal epithelial cells (Ramanathan et al., 2001). However, since ABCG2 is a transporter that is present in the plasma membrane of intestinal epithelial cells, it may promote ABCG2 expression regardless of pEP permeability.
In this study, we confirmed that pEP increases ABCG2 gene and protein expression in Caco-2 cells. These results suggest that pEP may promote UA excretion in the intestinal tract. Double-blind studies need to be undertaken in the future to confirm the effects of oral intake of pEP in humans.
Conflict of interest There are no conflicts of interest to declare.

Mass spectrum and composition result estimated by accurate mass of purified ABCG2 expression-promoting single compound.

Product ion spectrum and putative cleavage of purified ABCG2 expression-promoting single compound.
1H-NMR spectrum of purified ABCG2 expression-promoting single compound (A) and its enlarged view (B).

13C-NMR spectrum of purified ABCG2 expression-promoting single compound.

Cosy spectrum of purified ABCG2 expression-promoting single compound.

HSQC spectrum of purified ABCG2 expression-promoting single compound (1) and enlarged view of (1) A–G (2).

HMBC spectrum of purified ABCG2 expression promoting single compound (1) and enlarged view of each site (2)–(4).

1H-NMR spectrum of chemically synthesized pyroglutamylproline [pEP, (A)] and its enlarged view (B).

13C-NMR spectrum of chemically synthesized pyroglutamylproline (pEP).
ATP-binding cassette subfamily G member 2