Introduction
Difficulties in swallowing are often accompanied by aging and contribute to the development of aspiration pneumonia, which is a common cause of death. To enhance the well-being and health of the elderly, it is essential to conduct research on food safety and the mechanisms of swallowing disorders. Traditional methods of assessing food safety in individuals with swallowing difficulties involve trial-and-error food testing, which can increase the risk of choking and aspiration problems. The force perceived by individuals during eating is considered an important factor related to the ease of mastication and swallowing.
Previous studies have reported high-resolution manometry in the field of biomechanical measurements related to mechanical quantities. These studies have focused on capturing pressure variations due to the contact of organs over time (Fox et al., 2007; Takasaki et al., 2008; Cock et al., 2017) and measuring pressure changes resulting from differences in the type of food, physical properties, and quantities (Park et al., 2015; Ota et al., 2019). Some reports have also discussed the correlation between the food bolus position and pressure by simultaneously measuring swallowing using videofluoroscopy and high-resolution manometry (Cook et al., 1989). Similarly, tongue-pressure measurements were conducted using pressure sensor sheets during mastication and swallowing (Ono et al., 2004; Hori et al., 2009). Furthermore, studies have reported the simultaneous measurement of mastication and swallowing movements by combining tongue-pressure sensors with high-resolution manometry (Yano et al., 2014). It is important to combine multiple evaluation techniques to comprehensively capture eating behaviors from various perspectives.
Several studies have investigated the effects of biomechanical measurements. Two-dimensional motion analysis has enabled the assessment of variations in specific areas of food materials based on changes in brightness, structural variations, and the position of the food bolus (Yamamoto et al., 2010). VF images obtained using a full-scale model of the oropharyngeal cavity considered the viscosity of the food bolus and the swallowing position (Iida et al., 2009). However, these models are limited to qualitative evaluations and do not consider time-dependent transformations caused by falling food boluses.
Several simulations have focused on specific aspects of swallowing, such as the transformation of jelly-like configurations among organs using the finite element method (FEM) (Mizunuma et al., 2004) or the forced transformation of the pharyngeal wall using Newtonian and non-Newtonian fluids (Meng et al., 2005). Simulations were performed using accurate 3D organ models (Shimokasa and Mizunuma, 2006) and gelatinous food boluses (Mizunuma et al., 2009). However, only a few simulations have comprehensively addressed the coupled transformations of organs, liquid boluses, and splashes of liquid (Sonomura et al., 2011). Mainstream numerical simulations of swallowing have been performed using the finite element method (FEM) and recently using particle methods, which allow for the calculation of fluid splashes and large transformations. Moving-particle simulations (MPSs) were first applied to the entire swallowing action by the authors (Michiwaki et al., 2011), but our first version of the simulator did not consider the validity of the results. The simulation model was subsequently improved, and the calculation results of the validated model using the MPS method were reported (Michiwaki et al., 2018).
Other particle-based methods, such as smoothed particle hydrodynamics (SPH), have also been applied to swallowing (Ho et al., 2014; Farazi et al., 2015). In recent years, swallowing with different material properties was analyzed using the cumulant lattice Boltzmann method (Ohta et al., 2019). However, details on the validity of the simulation results have not been reported.
Validated 3D MPS with organs and food boluses may suitably describe the flow configuration around the epiglottis and validate the simulation results of Newtonian and non-Newtonian fluids or extracted values of several physical properties, such as velocity, shear rate and viscosity, for healthy individuals (Kikuchi et al., 2017; Kamiya et al., 2019; Michiwaki et al., 2020).
There have been few reports of mechanical indicators during swallowing using numerical analysis methods. In previous studies using two-dimensional particle analysis, the power exerted on the organs during swallowing has been computed; however, the validity of these values has not been discussed (Ishida et al., 2011). In our previous study, we implemented manometry into a simulation model that defined the organs as elastic (Kikuchi et al., 2018). Although the simulation results showed similar trends to the measured values regarding the pressure during contact with the organ, some differences were observed, suggesting the need for further improvement of the analysis model.
The objective of this study is to examine the behavior of food boluses and the forces exerted on organs during swallowing. In a previous study by the authors, an elastic body model was employed in a swallowing simulator. While this model allowed for the calculation of forces exerted on organs, it was unable to separate the forces applied by the food bolus on the organs and the forces occurring when different organs came into contact. Therefore, in the present study, we adopted a simulation methodology based on a rigid body deformation model that enables the extraction of forces solely exerted by the food bolus on the organs. The information obtained from the extracted forces can be utilized as a new evaluation index for ease of eating and drinking by investigating its correlation with sensory evaluation during ingestion.
Materials and Methods
VF imaging of swallowing VF images were used to create a simulation model and validate the 3D human swallowing simulator. The subject for VF imaging was a healthy volunteer (a 25-year-old male) who provided informed consent to participate in this study. VF imaging was approved by the Ethics Committee of the Japanese Red Cross Musashino Hospital (Approval No. 116). A VF image was taken every 1/30 s from the front and side views.
Accurate human swallowing model and definition of moving objects An accurate human swallowing model was designed based on the computed tomography (CT) images shown in Fig. 1A. The jawbone, vertebrae, hyoid, tongue, soft palate, and space of the pharynx were depicted semiautomatically by changing the brightness (Fig. 1B). These parts were used to guide the modeling of other organs, which were traced manually based on anatomical knowledge and the structural relationships between the organs (Fig. 1C). The detailed modeling is reported in Michiwaki et al.(2018). The moving objects of the 3D swallowing model were defined by five objects (i.e., tongue, hard palate, soft palate, pharynx, and larynx), as shown in Fig. 2.


Measurements of the contact angle, surface tension, and viscosity In general, the main food properties required for the simulation are the viscosity and density. In our commercial software, the wet conditions and deformation properties near the organ wall were set as potential coefficient which was calculated by the functions of the contact angle and the surface tension, respectively (Prometech Software, 2012). An edible pig tongue purchased from a market was used to measure the contact angle between the organs and the liquid. The density was measured using a density hydrometer (DA-130 N, Kyoto Electronics Manufacturing Co., Ltd., Kyoto, Japan), and viscosity was measured using a rheometer (MCR301, Anton Paar GmbH, Austria). The surface tension was measured using a surface tensiometer (Drop Master 500; needle diameter, 0.4 mm, Kyowa Interface Science Co., Ltd., Saitama, Japan).
Solver and simulation The MPS method developed by Koshizuka et al. (1998) is well-known for the study of free surfaces or large fluid transformations. A 3D numerical simulator was developed using specialized commercial software (ParticleWorks 2.5; Prometech Software, Inc., Tokyo, Japan). Preprocessing resulted in a distance function file containing the distance functions, and a customized solver was used for the analysis. The simulation required a precise time interval of 1/300 s to accurately describe human swallowing. More than 700 distance function files were produced for each body part to cover the entire period of each swallow. Thus, the total number of files was approximately 2 800. These time-dependent files were used to represent the forced transformation of the organs during swallowing. Details of the simulation theory have been reported by Michiwaki et al. (2018).
Force on organs The pressure obtained from biometric measurements, such as manometry and tongue-pressure sensors, cannot be separated to assess the pressure exerted directly by the bolus on the sensors, spatial pressure, and pressure during direct contact between organs. Therefore, in this study, the organs were defined as rigid bodies and subjected to forced deformation at each time step to calculate and extract only the forces from the bolus acting on the rigid bodies. Among the rigid body defined objects, the hard palate employed the same shape model throughout all computation intervals. Conversely, other rigid body defined objects loaded different shapes of rigid body models at each calculation step. While being rigid, these models simulate the deformation of shapes over time, mimicking the behavior of deformation despite their rigid nature. Consequently, the calculated forces did not consider the influence of the forces between the organs in contact with each other. It should also be noted that the calculated forces represent the forces acting on the entire rigid-body object and not just a specific point of the rigid body.
Materials and properties The simulated food model was a non-Newtonian fluid [2 % (w/w) thickener aqueous solution (Toromake SP, Meiji Co., Ltd., Tokyo, Japan); hereafter, “thickener” for simplicity] that included a contrast medium (OYPALOMIN; Fuji Pharma Co., Ltd., Tokyo, Japan). The mixing ratio of the thickener and contrast medium was set at 1:1. The properties of the food samples, input data, and solver settings are listed in Table 1. The particle diameter, which influenced the resolution of the food bolus, was 2 mm. For the model, a standing posture during swallowing was assumed, and the quantity of the food bolus was fixed at 5.0 mL. We assumed that the food was put into the mouth and swallowed immediately considering a uniform sample temperature of 25 °C and neglecting any variation in temperature during swallowing. The effective radius which was a dimensionless number obtained by dividing the particle distance by the particle diameter was a fitting parameter in the analysis. It was determined to be 4.1 (Kamiya et al., 2023).
Table 1. Physical properties of simulation sample.
| Food model |
Thickener model |
| : Non-Newtonian fluid |
| [2 % (w/w) thickener** aqueous solution with contrast medium*] |
Swallowing volume
mL |
5.0 |
Surface tension
N/m |
0.024 |
| Viscosity |
Power law model  |
| mPa · s |
C1 = 5.636, C2 = −0.724 |
|
Contact angle*** deg. |
Potential Coefficient |
| Pharynx |
76.1 |
0.443 |
| Larynx |
85 |
0.388 |
| Soft palate |
76.1 |
0.443 |
| Tongue |
71.6 |
0.47 |
| Fluid |
90 |
0.715 |
Density 1 000 kg/m3, particle diameter 2 nm, effective radius 4.1
* Contrast medium: OYPALOMIN 370, Fuji Pharma Co., Ltd., Tokyo, Japan.
** Thickener: Toromake SP, Meiji Co., Ltd., Tokyo, Japan.
*** Measurement by pig's organs. Bold are fitting parameter.
Results and Discussion
Graph matrix for force-time analysis The force exerted on the bolus by the five organs (i.e., tongue, hard palate, soft palate, pharynx, and larynx) results in a four-dimensional information set comprising three spatial dimensions and one temporal dimension. Individual graphs provide temporal changes in the one-dimensional (unidirectional) or two-dimensional force vectors without temporal information, which make it difficult to grasp the overall dynamics of swallowing. Therefore, in this study, we proposed a graph matrix (Fig. 3) that relates the force and time in a two-dimensional graph to interpret the spatial and temporal relationships. The resultant forces in each plane are indicated by the bold red boxes.

Information about the timing of peak expressions and other temporal aspects of these resultant force graphs can be obtained by referring to the far left or bottom graphs of each respective force graph. By utilizing the graph matrix, it becomes feasible to comprehensively observe the temporal evolution of resultant forces and changes in direction while minimizing the duplication of graphs. The figure numbers are indicated in the lower-left corner of each segmented graph within the graph matrix. Each graph displays characteristic peaks corresponding to the respective organs, which are represented by alphabetical symbols. Uppercase letters indicate peaks associated with the tongue, while lowercase letters represent peaks associated with the other organs. If multiple peaks occur simultaneously, a prime symbol is added to the corresponding letter. As the bolus is transported, the peaks labeled A–E (a–e, e′) move in the temporal direction. Additionally, the time and force vector scales in each graph of the graph matrix are consistent. The colors of the organs shown in the upper-right corner of the graph matrix match the colors of the waveform, and the force direction is also indicated within the graph. To discuss the relationship between the bolus shape before and after the peaks, we compare it with the time variation in the bolus shown in Fig. 4.

In the following discussion, we present information on the force and time in the order of the Z-Y-t diagram (temporal change with the force in the ZY direction), X-Y-t diagram (temporal change with the force in the XY direction), and Z-X-t diagram (temporal change with the force in the ZX direction) to analyze their characteristics.
Discussion on the Z-Y-t diagram We considered the integrated information of the central graph (Fig. 3-3) along with the left (Fig. 3-1) and bottom (Fig. 3-2) graphs within the graph matrix.
Fig. 3-1 represents the temporal variation in the forces in the vertical direction (Z-t graph). The peaks of the Z-directional forces occurred in pairs, with forces applied in opposite directions at specific timings. This indicates a coordinated action of the organs during swallowing. Further, the waveform of the tongue indicates that the tongue initially transfers the bolus in coordination with other organs in the order of A, B, and C while receiving downward forces (-Z-direction). However, from D to E, the force direction is reversed, and the tongue receives an upward force (+Z-direction). Individually examining the organs shows that, with the progression of time, the force peaks in the order of hard palate (a, b), soft palate (c), pharynx (d, e), and larynx (d′, e′).
Fig. 3-2 illustrates the temporal variation in forces in the anterior-posterior direction (t-Y graph) when viewed from the front of the face to the back of the head. The vertical axis represents the time, and the time scale is the same as that in the horizontal axis in Fig. 3-1. The forces in the Y-direction are generally stronger in the later phase of swallowing (D–E and d, d′-e, e′). In particular, the +Y-direction corresponds to the posterior wall of the pharynx, and the –Y-direction indicates a balance between the forces exerted by the tongue and the soft palate. Similar to the Z-directional force in Fig. 3-1, the Y-directional forces exhibited symmetrical peaks, indicating that the bolus was transported through the coordinated movements of the organs.
Fig. 3-3 is at the center of the graph matrix representation of the combined ZY-direction forces (defined as the Z-Y resultant force). This graph provides a profile of the resultant force vector when viewed from the side. It lacks time information as the Z-Y forces have been integrated. To examine the progression of time, we can refer to the alphabetical sequence. As the timing of each peak occurrence corresponds to Fig. 3-1 and 3-2, a detailed reference to time information can be made by comparing the respective horizontal (Fig. 3-1) and vertical (Fig. 3-2) graphs. From this graph, it can be observed that each peak of the Z-Y resultant force always has an opposite peak on the other side. The progression of the tongue peaks indicates that the forces move in the order of A-B-C-D-E in a clockwise manner. Furthermore, the magnitude and changes in forces indicate that the tongue plays a central role throughout the entire swallowing process, constantly receiving forces from various directions as if rotating clockwise. Other organs are believed to move in coordination, supporting the movement of the tongue. Previous studies in the oral region using tongue-pressure sensors have reported the order of tongue contact against the hard palate during bolus transportation (Ono et al., 2004; Ono et al., 2010). The progression of peaks in the oral region observed in this study (A-B-C, a-b-c) aligns with the findings of previous studies. This graph can also be utilized to discuss the sequence of events in the oral region by employing patient models that inhibit movement or simulate missing aspects of the organ shapes.
Discussion on the X-Y-t diagram We considered the combined information from the top two graphs (Fig. 3-4, Fig. 3-5) and the middle bottom graph (Fig. 3-2) of the graph matrix. Fig. 3-4 illustrates the temporal variation of the forces in the left-right direction (X-t graph). Overall, the forces in the X-direction were minimal. Slight peaks in the pharynx and larynx can be observed during the later stage of swallowing (e-e′). The reasons for these phenomena are discussed in relation to the position and shape of the bolus in Fig. 4. In the Y-direction, as shown in Fig. 3-2, the pharynx is subjected to +Y-direction forces, whereas the tongue and larynx experience -Y-direction forces in a symmetrical manner.
Fig. 3-5 represents the combined XY-direction force (defined as the X-Y resultant force) in the profile view when observed from the top. We can refer to this alphabetical sequence to confirm the progression of time. Because the timing of each peak occurrence corresponds to Fig. 3-2 and Fig. 3-4, a detailed reference to the time information can be made by comparing the respective horizontal (Fig. 3-4) and vertical (Fig. 3-2) graphs. The participant in this study, who was a healthy young individual, did not exhibit significant asymmetry in the X-Y resultant force in the X-direction (left-right direction). Previous studies of the oral region using tongue-pressure sensors have reported a loss of symmetry in patients with Parkinson's disease (Ono et al., 2010). This graph can be used to study not only the sequence but also the symmetry of events in the oral region by employing patient models that inhibit movement or simulate missing aspects of the organ shape.
Discussion on the Z-X-t diagram We considered the combined information from the two graphs on the right side (Fig. 3-6, Fig. 3-7) and the center-left graph (Fig. 3-1) within the graph matrix. Fig. 3-6 represents the t-X temporal variation in the forces derived from Fig. 3-4 (X-t diagram) by changing the orientation, and Fig. 3-1 has also already been discussed. Therefore, we focus on Fig. 3-7, which is located at the intersection of the two graphs. Fig. 3-7 represents the profile of the total resultant force in the vertical-horizontal direction (defined as the Z-X resultant force) when viewed from the front. In the Z-X diagram, the resultant Z-X force primarily transitioned along the midline. Although some X-direction forces were observed in the pharyngeal region around the later phase of swallowing (peak e), there is no specific balance of forces in this graph. These phenomena are discussed in the subsequent analysis of the bolus position and shape in Fig. 4.
In summary, the graph matrix used in this study offers the advantage of evaluating the three-dimensional force vectors and their temporal relationships by combining graphs arranged in a vertical-horizontal manner.
Bolus behavior Fig. 4 shows the behavior (position and shape) of the bolus calculated in the simulator. Time zero in the figure is defined as 0.100 s before the bolus enters the region of interest (ROI). The ROI is a solid rectangular area, as shown in Fig. 4 (X = 50 mm, Y = 40 mm, and Z = 80 mm), and the upper end of the ROI is set with respect to the uvula. Peaks A-a to E-e-e′ represent the peak values of the force vector-time graph matrix in Fig. 3. Comparing the peaks of the waveforms in Fig. 3 with the position and shape of the bolus allows us to analyze their relationships.
Before and after peak A-a (0.100 s) This peak represents the time at which the bolus begins to flow. The waveform of the Z-directional force vector in Fig. 3-1 shows that the center of the tongue rises from 0.04 s before peak A, and initially, the tongue and hard palate are under pressure. This indicates that the bolus is first caught between the tongue and hard palate, at which time the bolus is pushed and the force is transmitted to the front end of the bolus, initiating the flow of the bolus in the oral cavity. Around this time, when the soft palate starts moving toward the posterior wall of the pharynx (0.133 s), a bolus enters the pharyngeal space.
Before and after peak B-b (0.182 s) As seen in Fig. 3-1, this time region represents the state of Z-directional forces between the tongue and hard palate near the highest peak value. The bolus spreads slightly in the horizontal direction and flows down without any splatter, forming a coherent bolus along the surface of the tongue and descending toward the valleculae of the epiglottis. At this time, the tongue makes strong contact with the hard palate, reducing the space in the oral cavity; as a result, most of the bolus is pushed into the pharyngeal space. Comparing peaks B-b in Figs. 3–1 and 3-3 reveals that strong opposing forces are applied to the tongue and hard palate. At this time, both organs experience the highest force.
However, as shown in Figs. 3-2, 3-4, and 3-6, there are minimal forces in the X- and Y-directions at this time, and the forces are symmetric without dispersion in the X-direction. The transport of the bolus is primarily driven by the Z-directional force. As indicated by the force profile and position of the bolus, the bolus is securely held and transported by firmly placing it with vertical forces in coordination with the wave-like movement that occurs between the tongue and hard palate. Previous studies using measurements such as tongue-pressure sensors have reported that the tips of the tongue and the hard palate make strong contact and exhibit anchoring effects (Ono et al., 2013). The maximum value of the force between the tongue and hard palate in this study was similar to the results of previous studies.
Before and after peak C-c (0.270 s) This time region represents the time of the maximum Z and Y forces in the soft palate during swallowing. From approximately 0.233 s in Fig. 4, the bolus front reached the vicinity, the Z-directional force started to act on the pharynx. This is confirmed by the force profile of the pharynx in Fig. 3-1 before peak C-c. Although the bolus reached the valleculae, it coincided with the timing of vallecular lift and tilt (0.300 s). The bolus was distributed by the valleculae and flowed downward. From approximately 0.338 s, the bolus was caught between the base of the tongue and the pharynx, and the +Y-direction force started to increase, as shown in Fig. 3-2.
Before and after at peak D-d-d′ (0.438 s) This time region represents the second-largest peak in the +Y-direction of the pharynx and the maximum value in the −Y-direction of the tongue. The base of the tongue moves in the direction of the posterior wall of the pharynx, pushing out all the bolus present in the oropharynx and transporting it toward the open entrance of the esophagus. This was confirmed by the force profile of the pharynx and tongue in the Y-direction (Fig. 3-2). Almost no bolus was observed in the upper pharyngeal region, and the bolus was transported as a cohesive mass.
Near at peak E-e-e′ (0.501 s) This time region represents the maximum values in the -Z-direction and −Y-direction of the larynx and the +Y-direction of the pharynx. As can be seen from peaks E-e-e′ in Figs. 3-1 and 3-2, the +Y-direction of the pharynx, and the −Z-direction and −Y-direction of the larynx reach their maximum values. As shown in Figs. 3-4 or 3-6, there is a minimal force in the X-direction; only at this time, there is a force in the X-direction. This is when the pharyngeal space is at its minimum, and the bolus is pushed into the esophagus, causing forces to be exerted on the surrounding organs because the bolus lacks other pathways.
In summary, comparing the force vector-time graph matrix (Fig.3) with the behavior of the bolus (Fig. 4) allows us to analyze the magnitude and timing of the force vectors.
Relationship between the bolus position and working point of the resultant force vectors In this study, the force vectors acting on each organ and their resultant force vectors were considered in conjunction with the position. As is evident from Fig. 3, negligible forces were observed in the X-direction; thus, we focused on the resultant force vectors in the ZY direction. Fig. 5 shows the positions and shapes of the bolus along with the resultant Z-Y force vectors at each peak timing. This simulation extracted the forces exerted by the bolus on the organs, and we calculated the magnitude and direction of the average force exerted on the bolus by considering the resultant forces on the organs.
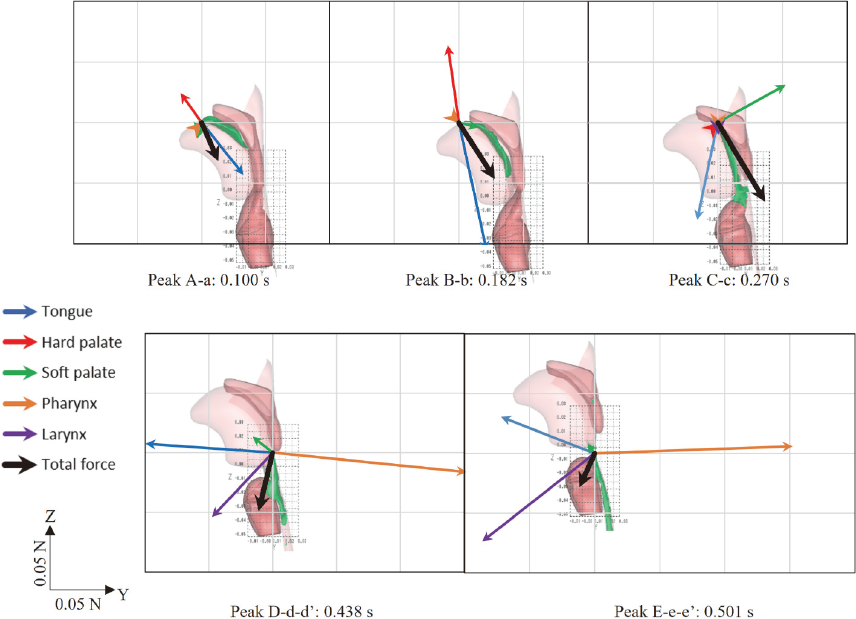
For peak A-a (0.100 s; see also Figs. 3-1 and 3-2), the primary forces were exerted by the tongue and hard palate. The position and shape of the bolus at this time indicate that the working point of the resultant force is located between the hard palate and tongue, suggesting that the working point of the resultant forces is at the rear end of the bolus. However, at this point, the bolus cannot move in the direction of the resulting force vector. Therefore, these forces are believed to propagate within the bolus, resulting in the actual movement of the bolus front. Thus, it was assumed that the working points of the resultant forces and the movement points were not the same.
Similarly, for peak B-b (0.182 s; see also Figs. 3-1 and 3-2), the main forces were exerted by the tongue and hard palate. Based on the position and shape of the bolus, the working point of the resultant force was inferred to be at the rear end of the bolus. The direction of the resultant force vector differed from the direction of movement of the rear end of the bolus. Previous studies using biomechanical measurements such as tongue-pressure sensors have reported that the tongue tip strongly contacts the hard palate and acts as an anchor (Ono et al., 2013). The point at which the maximum force is applied in the Z-direction of the tongue during swallowing is considered to confirm the anchoring function of the tongue.
For peak C-c (0.270 s; see also Figs. 3-1, 3-2, and 3-3), the main forces were exerted on the tongue and soft palate, with no significant force exerted on the hard palate. Considering the position and shape of the bolus, the working point of the resultant force vector at the rear end of the bolus corresponds to the direction of the bolus flow and the direction of the vector.
For peak D-d-d′ (see also Figs. 3-1, 3-2, and 3-3), four different forces were exerted by the tongue, soft palate, pharynx, and larynx. The direction of the resultant force, being in the Y-direction, differs from that in previous timings. The bolus is strongly pressed between the tongue and posterior pharyngeal wall, and the resultant force is directed towards the larynx. If the working point of the resultant force vector is set near the rear end of the bolus, then the direction of the vector corresponds to the bolus movement direction.
Similarly, for peak E-e-e′ (see also Figs. 3-1, 3-2, and 3-3), three different forces are exerted by the tongue, pharynx, and larynx. The pharynx experiences the largest force during swallowing, causing the epiglottis to turn over completely and the pharyngeal space to have the smallest volume. This indicates that a strong downward force was collectively applied by the organs to push the bolus downward. The posterior part of the tongue base experiences a +Z- and −Y-direction force as a reaction. The direction of the vector corresponds to the bolus transport direction by placing the working point of the resultant force vector near the rear end of the bolus.
Therefore, the direction of the resultant force vectors, calculated from the forces acting on each organ, represents the average direction of the bolus transport. The working point of the resultant force was considered to be the rear end of the bolus each time. Thus, during the bolus transport through the oropharyngeal space, the bolus was assumed to be pushed from the rear end. This behavior resembles the squeezing motion observed when extruding toothpaste from a tube and is consistent with previous reports suggesting that the bolus is transported while being squeezed.
Limitations of the simulation models and future work The following model improvements are necessary. First, the current food model utilizes a shear-thinning model without yield stress, owing to the limitations of commercial software. Therefore, future calculations should account for yield stress for a more accurate simulation.
Subsequently, other human models must be developed. Currently, only a few validated human models are available because manual and highly specialized processes are required for shape creation through region segmentation of medical images and capturing of temporal changes in shape. Although we are currently investigating simplification methods for region segmentation, once these techniques are employed, it will be possible to create models specific to different types of disorders, enabling individualized analysis.
Finally, in this study, rigid-body models were used for all organs to extract the forces exerted by the food on the organs, disregarding the contact forces between the rigid bodies. However, to extract the forces of inter-organ contact, it is necessary to utilize elastic models for organs similar to those used in our previous studies. In the future, we intend to develop a separate method for determining the forces exerted by food using elasticized organ models.
Moreover, to confirm the validity of computational methods, it is necessary to evaluate and compare them with studies involving measurements, such as manometry and tongue-pressure sensors. It is also important to investigate the relationship between the extracted force values and sensory evaluations.
