原著
末梢血塗抹標本スクリーニングにおける深層学習法を用いた幼若顆粒球認識の試み―血球形態分類における畳み込みニューラルネットワークを用いた人工知能モデルの可能性―
2024 年 73 巻 1 号 p. 69-77
詳細
2024 年 73 巻 1 号 p. 69-77
Deep learning is a machine learning technique using a multilayered neural network that mimics the neural circuits in the human brain. Deep learning models are capable of automatic identification of hidden features in data sets following numerous training iterations, ranging from dozens to hundreds, that result in the generation of an accurate and efficient decision model. The immature granulocyte or blast cell population in peripheral blood is a critical indicator for differentiating hematopoietic diseases. Thus, a highly accurate automated screening technology needs to be established. This study examined the training conditions in generating immature granulocyte recognition artificial intelligence models using convolutional neural networks. We examined the clinical potential of the generated artificial intelligence models. This study used five types of ResNet models with a layer count ranging from 18 to 152 layers. Transfer learning and fine-tuning were performed using 6727 labeled blood cell images and eight types of optimizers to generate immature granulocyte recognition artificial intelligence models with optimal weighting. Clinical assessments were performed on 25 healthy and 25 cases with the appearance of immature granulocytes using the trained artificial intelligence models. The minimum–maximum total accuracy ranges were 0.9131–0.9788 for the healthy cases and 0.8177–0.8812 for the immature granulocyte cases. Our convolutional neural network-based immature granulocyte recognition artificial intelligence model had an accuracy rate of 97% for healthy cases and a rate higher than 88% for cases with the appearance of immature granulocytes. These findings indicate that our artificial intelligence model is a useful morphological differentiation support technology for peripheral blood smear screening.
深層学習は人間の脳神経回路を模倣した多層のニューラルネットワークを持つ機械学習法の1つである。数十から数百回の反復学習によって,潜在的な特徴量を自動的に鑑別し,正確で効率的な判断モデルの生成を可能とする。末梢血中への幼若顆粒球や芽球の出現は造血器疾患鑑別の重要な指標であり,精度の高い自動スクリーニング技術の確立が必要とされる。本研究では,畳み込みニューラルネットワークを用いて幼若顆粒球認識人工知能モデルを生成する際の学習条件を検討し,生成した人工知能モデルの有用性を評価した。18層から152層までの5種類のResNetモデル,6727枚のラベル付き有核血球画像,8種類のOptimizerを用いて,転移学習とFine-tuningを行い,最適な重み付けがなされた幼若顆粒球認識人工知能モデルを生成した。転移学習後のモデルを用いて,健常人25例と幼若顆粒球症例25例を対象とした臨床評価を行った。全血球認識精度の最低-最大値は健常人症例で0.9131–0.9788,幼若顆粒球症例で0.8177–0.8812であった。畳み込みニューラルネットワークを用いた幼若顆粒球認識人工知能モデルは,健常人で97%,幼若顆粒球症例で88%以上の高い精度を有することが明らかとなった。本モデルは末梢血塗抹標本スクリーニングにおける形態鑑別支援技術として有用であると考えられる。
Machine learning (ML) is a data analysis technology that enables computers to find hidden features and regularities in data. In the process of generating a model, experts optimize the model by specifying and tuning the features to be measured, which improves the accuracy of recognition and prediction.1) The automated blood cell morphology classification system, which was pioneered as an alternative to the visual classification of blood morphology under a microscope, is an example of a blood testing technology using ML.2) The principle of this device is to recognize the shape of nuclei and cytoplasm by breaking down the color components of each blood cell image into red, green, and blue. The areas measured by each element are recognized as cell-specific features through an additive or subtractive process and classified into leukocyte categories based on predefined values. This approach has enabled highly accurate cell category prediction based on ML parameters in mature blood cells.3) On the contrary, cells with morphological changes, such as atypical or abnormal cells, show a wide variety of morphologies, which makes it difficult to define common parameters using ML.4) The immature granulocyte (IG) or blast cell population in peripheral blood is a critical indicator for differentiating hematopoietic diseases such as leukemia, myelodysplastic syndrome, and severe infections. Therefore, a highly accurate automated screening technology needs to be established. However, regarding the accuracy of blood cell recognition, automation with ML technology is still under development. Therefore, many cases of morphological abnormalities caused by hematological diseases require double-checking by hematologists, and technological breakthroughs using next-generation technology are needed in clinical laboratories. Recently, artificial intelligence (AI) technology has been rapidly developing as an automation technology within the field of medicine based on the thinking processes of medical experts. Deep learning (DL) is an ML technique in which an AI model is trained to perform tasks involving comprehension, reasoning, and prediction. DL models consist of multilayered neural networks that mimic the neural circuitry of the human brain and are capable of automatic identification of features contained in data sets following dozens to hundreds of training iterations. DL has been reported to be able to detect latent features that are overlooked by humans, thereby enabling more accurate and efficient judgments.5),6) In the medical field, disease diagnosis or prognosis prediction systems incorporating AI technology, particularly in the field of diagnostic imaging, have started to be developed, and some diagnostic technologies have already been put to practical use.7),8) Experiments in hematological testing have started to use DL to recognize atypical and abnormal blood cells, which are difficult to identify using ML algorithms such as k-nearest neighbor, support vector machines, Naïve Bayes, and decision trees.9)–11) Given this background, the present study aimed to examine the training conditions for generating IG recognition AI models using convolutional neural networks (CNNs) by performing clinical assessments of the generated AI models.
The study subjects for the supervised training were 100 healthy cases, 50 cases with the appearance of erythroblasts, 50 cases of reactive lymphocytosis, and 50 cases with the appearance of IGs (IG cases). IG cases were defined as having a cutoff value of 3% or higher for the appearance of IG in peripheral blood, whether neoplastic or reactive cases. Thin-layer blood smears were prepared from peripheral blood supplemented with ethylenediaminetetraacetic acid dipotassium salt dihydrate (EDTA-2K).
2. Subjects for Clinical AssessmentThe subjects for the clinical assessment were 25 healthy cases and 25 IG cases. Thin-layer blood smears were prepared from peripheral blood supplemented with EDTA-2K.
3. Hardware and Software for DLThe hardware used in this study consisted of a system equipped with an Intel Core i7-12700 3.6 GHz CPU and an NVIDIA GeForce RTX 3090 Ti GPU with 24 GB of VRAM. Neural Network Libraries v1.35.0 (Sony Network Communications), Anaconda 3.0, and Python 3.5 were used for the AI modeling. The Residual Neural Networks (ResNet) model was applied for DL.12)
The outline of this study is shown in Figure 1.
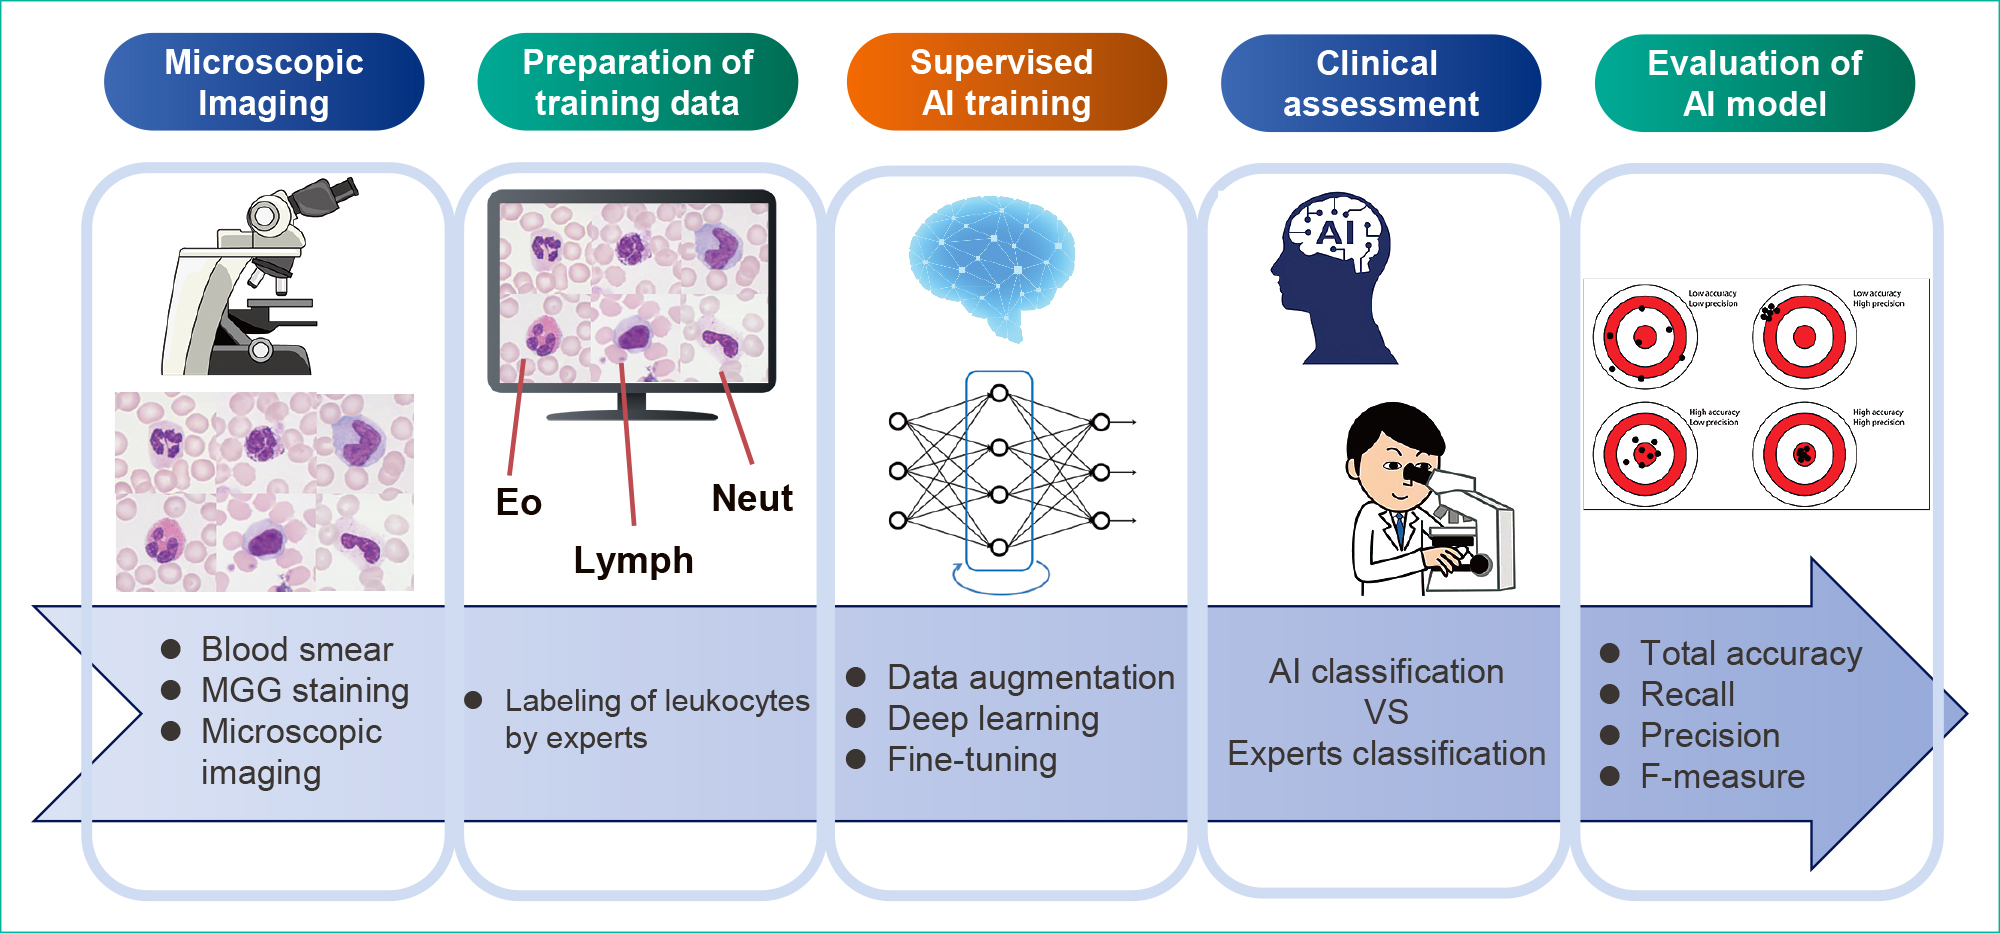
Thin-layer blood smears were subjected to May–Grünwald–Giemsa (MGG) staining. The May–Grünwald and Giemsa solutions were manufactured by Merck & Co.
2. Microscopic ImagingThe MGG-stained smears were observed under a microscope using an objective oil immersion lens (100×). Leukocytes or erythroblasts (100–200 images for healthy cases and 300–400 images for IG cases per smear slide) were captured using a microscope color camera (Axiocam ERc5s; Carl Zeiss) and saved in JPG format (1920 × 2560 pixels). These images were then trimmed to 750 × 750 pixels as one nucleated blood cell/image.
3. Labeling of Blood Cell ImagesAll microscopic images were classified into the following eight categories by three experts (hematologists or clinical laboratory technologists): neutrophil (Neut), eosinophil (Eo), basophil (Baso), monocyte (Mono), normal lymphocyte (Lymph), reactive lymphocyte (R-lymph), erythroblast (EB), or IG. The leukocyte classification criteria followed the “Shared standard range for leukocyte visual morphology classification” designated by the Japanese Society for Laboratory Hematology Committee for Standardization.13)
4. Preparation of Datasets for Supervised TrainingIn total, 50000 nucleated blood cell images were captured with a microscope for supervised training, among which, 6727 that showed typical morphology in each cell category were randomly selected to align the balance of the number of cell images for each category in the data sets. The blood cell configurations in the data set are shown in Table 1A. Next, 80% of the cell images randomly extracted from the data set were used for the training; these images were further reduced from a resolution of 750 × 750 pixels to a resolution of 480 × 480 pixels. The remaining 20% were used for validation experiments; these images were further reduced to a resolution of 320 × 320 pixels.
;%0A%09%09%09newWindow.document.open();%0A%09%09%09newWindow.document.write('<img src=%22./Graphics/73_23-72_t2.jpg%22>');%0A%09%09%09newWindow.document.close();%0A%09%09)
The structure of the CNNs for the recognition of IG is shown in Table 1B. This study used five types of ResNet models with 18 to 152 layers for DL. Data augmentation processing14),15) was performed to increase the number of training images in all ResNet models. Rotation, inversion, or slice processing was applied to the randomly selected original image. Transfer learning and fine-tuning were performed at 500 epochs using the training data set and eight types of optimizers. The hyperparameters are shown in Table 1C. We performed validation experiments with all layer models and calculated the total accuracy, recall, precision, and F-measure. The AI models that showed the highest total accuracy in the validation experiments were selected as the best models for the clinical assessments.
6. Clinical Assessments of AI Models for the Recognition of IGA total of 11240 nucleated blood cell images (3212 images of healthy cases and 8028 images of IG cases) were captured with a microscope for the clinical assessments. The blood cell configurations for the clinical assessments are shown in Table 1A. All images were reduced from a resolution of 750 × 750 pixels to a resolution of 320 × 320 pixels. We performed clinical assessments with all layer models. We calculated total accuracy, recall, precision, and F-measure. Each indicator was calculated according to the following formula.
Total accuracy = number of correct answers ÷ number of data
Recall = true positive ÷ (true positive + false negative)
Precision = true positives ÷ (true positives + false positives)
F-measure = 2 × Recall × Precision ÷ (Recall + Precision)
The classification concordance between the AI model and experts was calculated using the Copper coefficient. Statistical analysis was performed using IBM SPSS Statistics 29.
7. Visualization of IG Recognition Factors in Leukocyte Classification Using Explainable AIVisualization analysis using the Local Interpretable Model-agnostic Explanations (LIME) method was performed on images that matched or mismatched classifications in the clinical assessments.16)
The training and validation error curves obtained by training the ResNet-152 model are shown in Figure 2A, and the total accuracy distribution for every ResNet model using the validation images is shown in Figure 2B. The highest values for each layered model reached a range of 0.9304–0.9386. The F-measure distribution for the IG category is shown in Figure 2C. The highest values for each layer model reached a range of 0.8837–0.9006.

Recognition rates for all blood cells are shown in Table 2. The minimum–maximum total accuracy range was 0.9131–0.9788 for the healthy cases and 0.8177–0.8812 for the IG cases. The 34-layer model showed the highest accuracy, with no correlation between accuracy and the number of layers. The recognition accuracies of the Neut and IG categories are shown in Table 3. The minimum–maximum F-measure range was 0.9714–0.9977 in the Neut category for the healthy cases, and it was 0.8622–0.9240 in the Neut category and 0.7712–0.8381 in the IG category for the IG cases. The 34-layer model showed the highest accuracy, with no correlation between the number of layers and the F-measure. The confusion matrix for clinical assessments using the highest accuracy AI model is shown in Table 4. In the healthy cases, 1.3% (16/1229) and 1.8% (22/1229) of the Lymph images were misclassified into the Neut and EB categories, respectively. Those images were small to medium-sized Lymph with scant cytoplasmic areas. In addition, 19.0% (454/2384) of the IG images were misclassified into the Neut category, and 2.1% (84/3926) of the Neut images were misclassified into the IG category. Most misclassified cells belonged to the borderline region between metamyelocytes and rod-shaped neutrophils. In addition, 17.3% (91/525) of the Mono images were misclassified to the IG category; these Mono cells had nontypical and complex nuclear shapes. The kappa coefficients for the healthy cases were 0.852 for the lowest model and 0.962 for the highest model, while those for the IG cases were 0.725 for the lowest model and 0.765 for the highest model.
| Layer | Indicator |
Healthy cases |
IG cases | Average |
|---|---|---|---|---|
| 18 | Total accuracy | 0.9131 | 0.8421 | 0.8776 |
| Ave-Recall | 0.9438 | 0.8415 | 0.8926 | |
| Ave-Precision | 0.8026 | 0.8495 | 0.8261 | |
| Ave-F-measure | 0.8144 | 0.8291 | 0.8218 | |
| 34 | Total accuracy | 0.9785 | 0.8812 | 0.9298 |
| Ave-Recall | 0.9793 | 0.8691 | 0.9242 | |
| Ave-Precision | 0.9195 | 0.8949 | 0.9072 | |
| Ave-F-measure | 0.9454 | 0.8735 | 0.9095 | |
| 50 | Total accuracy | 0.9617 | 0.8177 | 0.8897 |
| Ave-Recall | 0.9754 | 0.8491 | 0.9122 | |
| Ave-Precision | 0.8626 | 0.8595 | 0.8610 | |
| Ave-F-measure | 0.8887 | 0.8410 | 0.8648 | |
| 101 | Total accuracy | 0.9620 | 0.8413 | 0.9017 |
| Ave-Recall | 0.9806 | 0.8495 | 0.9151 | |
| Ave-Precision | 0.8374 | 0.8293 | 0.8334 | |
| Ave-F-measure | 0.8735 | 0.8183 | 0.8459 | |
| 152 | Total accuracy | 0.9788 | 0.8477 | 0.9133 |
| Ave-Recall | 0.9842 | 0.8322 | 0.9082 | |
| Ave-Precision | 0.9113 | 0.8296 | 0.8705 | |
| Ave-F-measure | 0.9438 | 0.8137 | 0.8787 |
| Layer | Indicator | Healthy cases | IG cases | Average | |
|---|---|---|---|---|---|
| Neut | Neut | IG | |||
| 18 | Recall | 0.9520 | 0.8839 | 0.8470 | 0.8943 |
| Precision | 0.9917 | 0.9011 | 0.7476 | 0.8801 | |
| F-measure | 0.9714 | 0.8924 | 0.7942 | 0.8860 | |
| 34 | Recall | 0.9983 | 0.9771 | 0.7966 | 0.9240 |
| Precision | 0.9898 | 0.8765 | 0.8841 | 0.9168 | |
| F-measure | 0.9940 | 0.9240 | 0.8381 | 0.9187 | |
| 50 | Recall | 0.9663 | 0.8142 | 0.8788 | 0.8864 |
| Precision | 0.9994 | 0.9163 | 0.6870 | 0.8676 | |
| F-measure | 0.9826 | 0.8622 | 0.7712 | 0.8720 | |
| 101 | Recall | 0.9509 | 0.8727 | 0.8528 | 0.8921 |
| Precision | 1.0000 | 0.9105 | 0.7905 | 0.9003 | |
| F-measure | 0.9748 | 0.8912 | 0.8205 | 0.8955 | |
| 152 | Recall | 0.9971 | 0.9213 | 0.8465 | 0.9217 |
| Precision | 0.9983 | 0.8945 | 0.7924 | 0.8950 | |
| F-measure | 0.9977 | 0.9077 | 0.8186 | 0.9080 | |
| Experts/AI | Neut | Eo | Baso | Mono | Lymph | IG | R-lymph | EB | Recall |
|---|---|---|---|---|---|---|---|---|---|
| Neut | 1747 | 2 | 1 | 0 | 0 | 0 | 0 | 0 | 0.9983 |
| Eo | 0 | 48 | 0 | 0 | 0 | 0 | 0 | 0 | 1.0000 |
| Baso | 1 | 0 | 40 | 0 | 0 | 0 | 0 | 0 | 0.9756 |
| Mono | 1 | 0 | 0 | 139 | 3 | 0 | 0 | 0 | 0.9720 |
| Lymph | 16 | 13 | 5 | 3 | 1168 | 2 | 0 | 22 | 0.9504 |
| IG | 0 | 0 | 0 | 0 | 0 | 0 | 0 | 0 | — |
| R-lymph | 0 | 0 | 0 | 0 | 0 | 0 | 1 | 0 | — |
| EB | 0 | 0 | 0 | 0 | 0 | 0 | 0 | 0 | — |
| Precision | 0.9898 | 0.7619 | 0.8696 | 0.9789 | 0.9974 | — | — | — | |
| F-measure | 0.9940 | 0.8649 | 0.9195 | 0.9754 | 0.9733 | — | — | — |
| Experts/AI | Neut | Eo | Baso | Mono | Lymph | IG | R-lymph | EB | Recall |
|---|---|---|---|---|---|---|---|---|---|
| Neut | 3838 | 5 | 1 | 0 | 0 | 84 | 0 | 0 | 0.9771 |
| Eo | 0 | 95 | 0 | 0 | 0 | 0 | 0 | 0 | 1.0000 |
| Baso | 2 | 0 | 181 | 0 | 0 | 2 | 0 | 0 | 0.9784 |
| Mono | 24 | 3 | 0 | 377 | 11 | 91 | 19 | 0 | 0.7181 |
| Lymph | 61 | 21 | 5 | 17 | 626 | 71 | 11 | 29 | 0.7444 |
| IG | 454 | 2 | 3 | 5 | 3 | 1900 | 18 | 0 | 0.7966 |
| R-lymph | 0 | 0 | 0 | 3 | 9 | 1 | 16 | 0 | — |
| EB | 0 | 0 | 0 | 0 | 0 | 0 | 0 | 48 | — |
| Precision | 0.8765 | 0.7540 | 0.9526 | 0.9378 | 0.9646 | 0.8841 | — | — | |
| F-measure | 0.9240 | 0.8597 | 0.9653 | 0.8134 | 0.8403 | 0.8381 | — | — |
The visualization of the critical feature region using the LIME method is shown in Figure 3. In the classification-matched cells between experts and AI, the nucleus and cytoplasm were extracted as important feature regions in Neut (Figure 3A) and IG (Figure 3B). The mismatched cells that experts classified into IG and that AI classified into Neut were differentiated with cytoplasm as the critical feature region (Figure 3C). The mismatched cells classified into Mono by the experts and into IG by AI were differentiated with the nucleus as the critical feature region (Figure 3D).
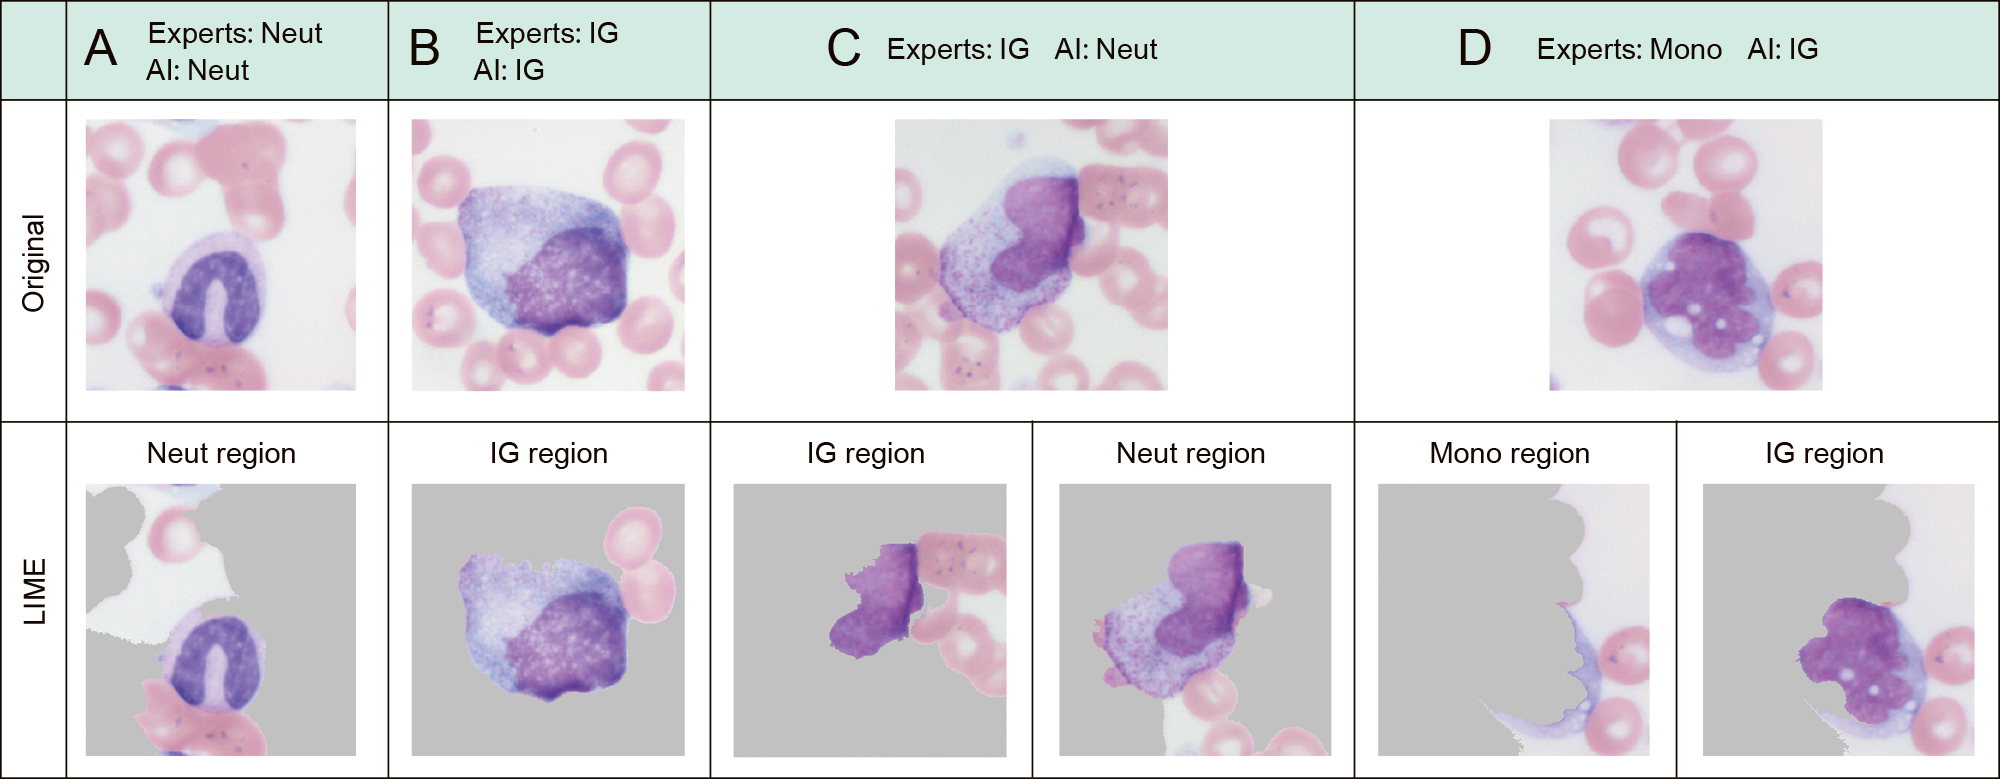
A, B: Leukocytes with matched decisions between experts and AI models
C, D: Leukocytes with mismatched decisions between experts and AI models
In this study, we approached IG recognition using single CNN models with different numbers of DL layers and assessed their clinical usefulness for automated classification at blood smear screening. The IG recognition AI models with the highest total accuracy (0.9386) and the lowest total accuracy (0.9304) had 34 and 152 layers, respectively, in the validation image evaluation. The models with the highest (0.8837) and lowest F-measures (0.9006) in the IG category had 18 and 50 layers, respectively. The differences between the highest and lowest models were 0.008 and 0.017 for the total accuracy and F-measure in the IG category, respectively. No improvement in recognition accuracy was found with an increase in the number of layers. This means that the morphological features critical for differentiating each blood cell category are relatively simple or few in number when generating blood morphology recognition AI models for use in screening. Therefore, it is presumed that appropriate weighting for eight-category classification was obtained even with a relatively shallow DL model. On the other hand, the differences among the eight optimizers considered were remarkable. The difference in F-measure values in the IG category for the 18-layer model was 0.1. Training in DL means adjusting the parameters so that the output result of computing the parameters between the input data and the layers of the training model is close to the correct data. The optimizer is an algorithm for achieving fast and efficient convergence of the training process.17)–19) The results showed that the optimization algorithm had a greater impact on recognition accuracy than on the number of layers. These results suggest that local optimization was achieved, but not global optimization, according to the algorithm selected. Regarding the influence of the selection of optimization algorithm for morphological recognition, Sukegawa et al.20) compared the Stochastic Gradient Descent and Sharpness-Aware Minimization (SAM) methods for oral exfoliative cytology diagnosis. They reported that a CNN with a SAM rate scheduler had the highest classification performance for oral exfoliative cytology. Thus, SAM may play an important role in the primary screening of the oral cytological diagnostic environment. The CNN model they used was VGG16, and our results are supported by the large accuracy differences between optimizers in that relatively shallow layered model. In the clinical assessment, the highest total accuracies were 0.9788 for the healthy cases and 0.8812 for the IG cases, and the highest F-measures were 0.9977 in the Neut category for the healthy cases, and 0.9240 in the Neut category and 0.8381 in the IG category for the IG cases. The healthy cases showed an accuracy above 0.95 for the model with more than 34 layers, while the IG cases showed an average accuracy of only 0.846. Many mismatches were seen for the IG cases in the IG and Neut categories, most of which had borderline morphological features. Although the ResNet model used in this study enables recognition based on hidden features through a convolution process, it is presumed to be very difficult to generate a linear model because metamyelocytes and rod-shaped neutrophils represent sequential stages in the development process of neutrophils and thus have similar morphological features. Regarding the AI classification of neutrophils, Tseng et al.21) used 10 CNNs trained to classify six blood cell types. They reported a recognition accuracy of 90% in six categories, from the most immature myeloblast to the most mature segmented neutrophil; thus, the effectiveness of ensemble models in which multiple AI models are parallelized has been suggested. However, their study was limited to the neutrophilic cell category, and its availability for screening applications involving other cell categories remains unclear. Therefore, it may be necessary to apply different AI models in stages, such as performing the main category classification in the first stage and then parallelizing multiple AI models as an ensemble model in the second stage. Meanwhile, as a method to confirm misclassified cells, Abir et al.22) proposed the implementation of explainable AI (XAI) technology, and other studies have reported the usefulness of visualizing the causes of leukocyte misclassification by XAI.23)–26) The results of LIME analysis showed that leukocytes were classified into three patterns: (1) recognition of both the nucleus and cytoplasm as the region of interest (ROI), (2) recognition of the nucleus only as the ROI, and (3) recognition of the cytoplasm or background cells as the ROI. It was confirmed that recognition of the nucleus and cytoplasm as ROIs is an indispensable condition for classification agreement, and it is considered that AI can avoid misclassification by excluding the cells with patterns (2) or (3) as indicative of doubtful recognition.
In the present study, the CNN-based IG recognition AI model had an accuracy rate of 97% for healthy cases and a rate higher than 88% for IG cases. Therefore, our AI model is considered a useful morphological differentiation support technology for peripheral blood smear screening. It is expected that ensemble or tandem modeling can help establish an automated technology with higher accuracy in the future.
This work was presented at the 35th World Congress of the International Federation of Biomedical Laboratory Science on October 5–9, 2022 in Suwon, Korea.
Institutional Review Board Statement: This study was conducted in accordance with the Declaration of Helsinki. It was approved by the Committee of Medical Ethics of Hirosaki University Graduate School of Medicine (Approval No.: 2021-044) and carried out according to the ethical guidelines for medical and biological research involving human subjects.
Informed Consent Statement: Informed consent was obtained from all subjects in the form of an online opt-out (https://www.med.hirosaki-u.ac.jp/hospital/outline/resarch.html).
Acknowledgments: The authors would like to thank Sayaka Souma, Shizuku Hirano, Suzuka Kaga, Niina Sakaiya, and Shou Kimura for their technical assistance with the experiments. We are also grateful to the referees and clinical laboratory technologists of Hirosaki University Hospital for their helpful comments.
Funding: This study was supported by Grants-in-Aid for Scientific Research (JSPS KAKENHI; Grant Nos.: 19K21737, 21H00894, 22K18573, and 22K02799).
There is no potential conflict of interest to disclose.