近年の薬学入学希望者の過剰な受け入れを起因とした教育の質の低下が懸念されている.それを回避するため,教学マネジメントの見直しが推進されている.その見直し策の一つとして「教育成果の可視化」が挙げられる.しかし,その可視化の方法についてはあまり議論されていない.我々はその可視化方法として小テストと検索クエリを組み合わせたシステムを考案した.この論文では,このシステムを運用して得られた知見をまとめた.また,テキストマイニングデータを問題形式ごとに多変量解析した.その結果,問題形式ごとに検索対象が異なることや,検索頻度と正答率の関係性に違いがあることが示された.これら知見は,この検索クエリシステムおよびそこから可視化される学習成果を活用することで,講義内容の改善点が明確化されることが示唆される.我々のアイデアおよびその成果は薬学教育の質の確保への貢献が期待される.
The over-enrollment in pharmacy schools has led to concern over the quality of pharmacy education and an oversupply of pharmacists. A review of educational management focused on learning outcomes visualization as a learning methodology with short tests and search queries. “Search queries” were used in Internet search engines to answer these small tests. The aggregated text data was mined and processed into a co-occurrence network diagram that revealed the “unlearned knowledge” of the learning population. Additionally, multivariate analysis based on the question categories was performed on the text-mined data. The results indicated that search targets differed by question type, and there were variations in the relationship between search frequency and correct response rate. These findings suggested that this search query system and its visualized learning outcomes could be used to identify areas for improvement in lecture contents and the quality of pharmacy education.
The educational system in Japanese pharmacy schools follows a standardized core curriculum. Universities and colleges can incorporate academic traditions into their pharmacy programs. This approach led to the development of pharmacists from diverse educational backgrounds. These efforts contribute to the optionality of prospective pharmacy students, the satisfaction of current pharmacy students, and the improvement of pharmacist quality. However, there are concerns that excessive admission of applicants may cause a decline in the quality of education. Thus, we conducted a review of education and learning management. Specifically, it includes measures such as “correcting the approach of excessive comprehensiveness and activity-based learning,” “establishing educational institutional research,” and “visualizing learning outcomes.” Through these initiatives, universities can ensure the quality of pharmacy education. Grasping the learning outcomes of student groups through a lecture is crucial for enhancing the efficiency of the plan–do–check–act (PDCA) cycle. Therefore, it is natural that universities are expected to visualize learning outcomes. However, little discussion on methods exists to achieve such visualization. Learning outcomes are obtained primarily after the completion of lectures and practical training. The ideal learning outcome is for all the content covered in lectures to be fully understood and applied by learners. However, a “gap” often arises between the teacher’s intentions (such as key learning points or concepts) and the students’ responses (points they understood). This gap in recognition and understanding is a form of communication error. In one-on-one teaching, the communicable environment, which depends on physical proximity, allows for the resolution of such gaps through active dialogue1). However, in lectures, the structure is that of a teacher addressing a large audience. Dialogue becomes difficult due to physical and psychological distances, and communication tends to be one-way. Consequently, resolving this gap using real-time communication is challenging. Small tests, which also serve as reviews, are commonly used to measure student understanding2,3). Since the rate of correct answers directly reflects a student’s level of comprehension, it becomes easier to identify gaps in recognition and understanding. The national pharmacist examination cannot be ignored in Japanese pharmacy education programs. Some criticize pharmacy education for being overly focused on exam preparation. Thus, small tests conducted in pharmacy-related classes often use questions from the national pharmacist’s examination or modified versions. For single answer questions, such as those in the required section of the exam, the correct answer rate is expected to correlate with the level of understanding. However, for theoretical questions, students are often asked about multifaceted knowledge related to a single technical term. Additionally, multiple pieces of knowledge may be required to judge the correctness of a single statement. When students answer such questions incorrectly, assessing their level of understanding is challenging because there are many potential stumbling factors.
A web search query refers to words or phrases entered while searching web search engines. Generally, web search queries have been used in search engine optimization to improve visibility and ranking and to increase access opportunities. Several educational studies focusing on the relationship between web search and the learning process have been reported4–6). In particular, a study focusing on learners’ understanding of web-searched information and its applications is ahead of the pack7). Thus, the learner’s search process is optimized only for acquiring factual knowledge, such as in look-up tasks. However, it is less successful in facilitating other types of learning, such as comprehension, analysis, application, and synthesis in Bloom’s taxonomy8). Since the main goal of look-up tasks is to find and acquire existing information, a receptive learning mode is often involved. Current search systems are optimized for look-up tasks and are not considered suitable for learning or research tasks9). If so, why is it not used to understand the current status of students instead of seeking to improve their academic performance? Therefore, we devised a method to identify students’ underachievement topics by combining small tests and web search queries (Fig. 1). Small tests are administered “with a web search.” Students searched for questions about knowledge that they did not fully understand (arbitrarily). To obtain active search query data, we use a system in which search words do not identify searchers. By aggregating these active data, we observed the students’ approaches to small tests. We inferred that the top keywords obtained from the aggregate are likely communication errors in the class. This information can be used to explain what the students “did not understand” and their learning outcomes. We use this information to understand topics related to students’ underachievement through group lectures. This information can be used to identify areas for improvement in the content of the class. It can contribute to improving the efficiency of the PDCA cycle and the student’s level of understanding. This report discusses the results of operating a web search query system and its contribution to understanding learning outcomes. We also discussed the problems and issues that we noticed during the operation of the system.
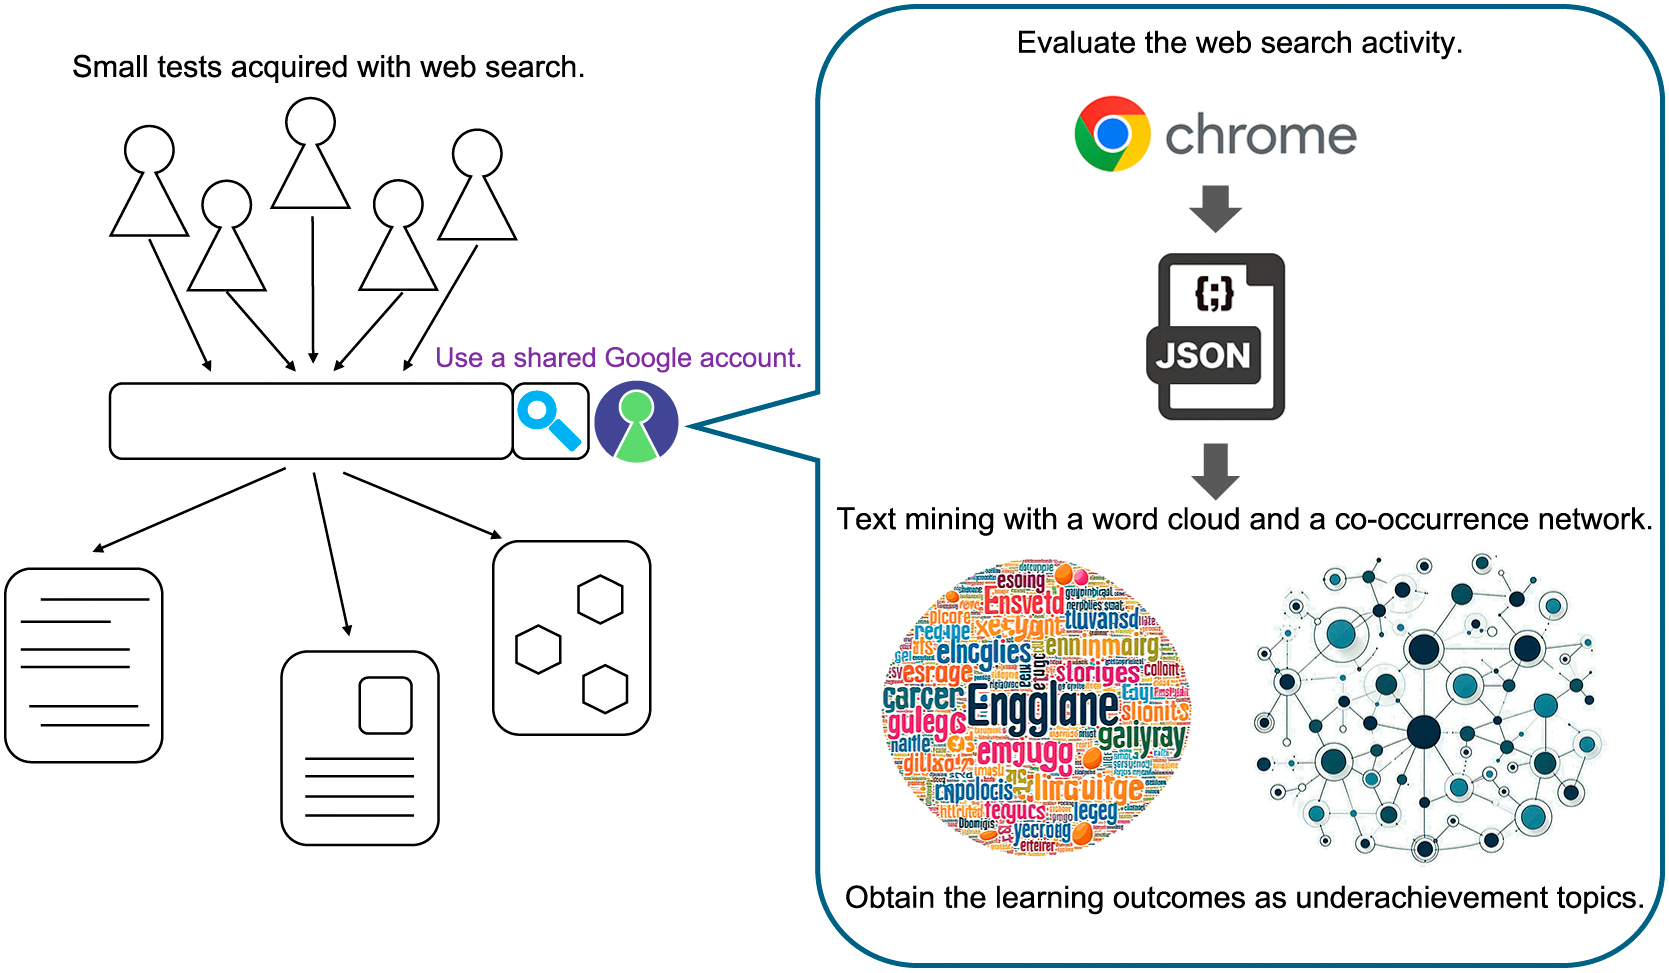
Diagram of a learning outcome system using search query analysis.
Students who took Pharmacokinetics I in the fall semester of 2023 and Pharmacokinetics II in the spring semester of 2024 at the Doshisha Women’s College of Liberal Arts were included in the study.
2. Obtaining active data for search queriesAt the beginning of each class, a four-question test was administered to review the previous lesson. The time limit for the test was set to five minutes. Students were informed that the test results would be factored into their course grades. A shared Google account was provided to the students to ensure anonymity and protect their personal information, as the searcher and search queries would not be linked to the individuals. Students were allowed to use the provided Google account to look-up information and complete their answers to improve their scores. However, using the provided Google account was optional. In addition, students were allowed access to textbooks. After the test, students who used the provided Google account were instructed to log out. Test results were collected using the class support system, manaba (Ver. 2.975, Asahi Net, Inc.). To maintain anonymity, the instructor removed personal identifiers from the test results before passing the data to analysts for further examination. Due to the operational procedures, the study was exempt from ethical review regarding “research involving human subjects.”
3. Text miningAfter the class, we accessed the Google Data Export page (https://takeout.google.com/), selected “Search” under the “My Activity” content options, and exported the data in JSON format. The exported file contained the history of the search query. Using the Python code, the search query words from the export file were extracted and output in TXT format. The extracted search query words were visualized using text-mining techniques to evaluate their frequency and relationship. The frequency of the search words was visualized using a word cloud generated from the TXT file using Python code. The relationships between search words were represented through a co-occurrence network, generated from the TXT file using KH Coder (Ver.3. Beta.07d)10).
4. Statistical analysisWe conducted a statistical analysis of the text-mining data using the following procedure: The test question categories were classified into “True or False,” “Calculation,” “Multiple-choice,” and “Binary classification.” Subcategories were established as “Single answer” and “Multiple answers” (Table 1). Their question statements are summarized in Table 2. The correlation between the correct answer rate and the number of related search queries was statistically analyzed using IBM SPSS (ver. 29.0.0.0; IBM, Armonk, NY, USA). This correlation analysis was conducted for each question category. The content of the search queries was classified into “Question text,” “Correct answer text,” and “Incorrect answer text.” A multiple comparison test was performed on these classifications using IBM SPSS. In order to analyze the effect of question format on search query content, a multinomial logistic regression analysis was conducted, focusing on the search query content for “Multiple-choice,” “Single answer,” and “Multiple answers.”
Summarizes the question formats and their numbers
| Class | Number of Students | Question category | Number of questions | Number of valid questions | |
|---|---|---|---|---|---|
| Main | Subcategory | ||||
| Pharmacokinetics I | 141 | True or False | 4 | 4 | |
| Multiple-choice | 32 | 32 | |||
| Binary classification | A single answer | 10 | 10 | ||
| Multiple answers | 6 | 6 | |||
| Calculation | 0 | 0 | |||
| Pharmacokinetics II | 134 | True or False | 4 | 3 | |
| Multiple-choice | 27 | 19 | |||
| Binary classification | A single answer | 2 | 0 | ||
| Multiple answers | 8 | 7 | |||
| Calculation | 11 | 0 | |||
The number of valid questions means the number of questions for which learning outcomes using a search query system could be performed.
Summarizes examples of the question categories and their question statements
| Question category | Example | |
|---|---|---|
| Main | Subcategory | |
| True or False | Q. Is carrier-mediated amino acid transport primary active transport? True or false? | |
| Multiple-choice | Q. Which cytochrome P-450 molecular species is most highly expressed in human liver? 1. CYP1A2 2. CYP2C19 3. CYP2D6 4. CYP2E1 5. CYP3A4 | |
| Binary classification | A single answer | Q. Which statement describes the effect of luminal pH on weak acid drug absorption via passive diffusion? 1. Lower pH decreases molecular form but increases absorption. 2. Lower pH decreases both molecular form and absorption. 3. Lower pH increases molecular form and absorption. 4. Lower pH increases molecular form but decreases absorption. 5. pH changes do not affect absorption. |
| Multiple answers | Q. Which two statements about the blood-brain barrier (BBB) are correct? 1. BBB is formed by choroid plexus epithelial cells. 2. High-molecular-weight drugs easily cross the BBB. 3. BBB transport systems allow some drugs to enter the brain. 4. Higher water solubility improves passive drug penetration into the brain. 5. P-glycoprotein blocks some drugs from entering the brain. | |
| Calculation | Q. The rate constant for drug disappearance according to the linear 1-compartment model is 0.30 h–1. What is the disappearance half-life (h) of this drug? | |
Figure 2 shows typical examples of a word cloud and co-occurrence network based on the analysis of search queries. In the word cloud, the frequency of the search terms is represented by the size of the word. In the co-occurrence network diagram, the frequency of search terms is indicated by the size of the nodes. Additionally, subqueries entered alongside the main search query are linked as satellite nodes. These satellite nodes can be considered words related to the main query. Therefore, it becomes possible to visualize the unclear aspect of the main query.

Typical diagrams of (A) word cloud and (B) co-occurrence network after text mining of small test search queries.
We evaluated the relationship between the question categories and text-mined search queries (Fig. 3). When no question category was assigned, a negative correlation was observed between the number of search queries and the correct answer rate (Pearson’s r = –0.367). When analyzed by question category, “True or False” showed a strong negative correlation. Additionally, “Multiple-choice” and “Binary classification with multiple answers” showed a weak negative correlation. However, no correlation between the number of search queries and the correct answer rate was found in the “binary classification with a single answer.” For “Calculation,” all questions had zero search queries, so this category was excluded from further analysis.

Plots of relationships between total search query words and accuracy rate. (A) Plots for all questions in the small tests (n = 81). (B–E) Plots are sorted by question categories as (B) True or False (n = 7), (C) Multiple-choice (n = 51), (D) Binary classification with a single answer (n = 10), and (E) Binary classification with multiple answers (n = 13). The dotted line indicates the approximate line of the plot, and r indicates the correlation coefficient.
We classified the search content for each question except for “True or False” into “Question text,” “Correct answer text,” and “Incorrect answer text” to determine which type of content was most frequently searched. The results are presented as a dotted plot (Fig. 4A). The most frequently searched content was related to the “Question text,” followed by “Incorrect answer text,” while content related to “Correct answer text” was the least searched.

(A) The dot plot shows the percentage of categories in the total search queries per question (n = 74). *, **, a statistically significant difference compared with the True group (p < 0.05, p < 0.01); ††, a statistically significant difference compared with the False group (p < 0.01). (B) The 3D scatter plot shows the relationship among query property ratio in total words focused on specific question categories. Blue, Multiple-choice (n = 51); Green, Binary classification with a single answer (n = 10); Red, Binary classification with multiple answers (n = 13).
To evaluate differences in search query content by question format, a 3D scatter plot of search query content (“Question text,” “Correct answer text,” “Incorrect answer text”) was shown for “Multiple-choice,” “Single answer,” and “Multiple answers” question types in Fig. 4B. In the “Binary classification with multiple answers” format, a tendency to search for content related to the “Incorrect answer text” was observed, compared to the other two formats. A multinomial logistic regression analysis was conducted to assess the impact of question format on the search query content (Table 3). Therefore, when comparing “Multiple-choice” and “Multiple answers,” the question format significantly impacted the content of the search queries.
Odds ratios and 95% confidence intervals of question categories associated with query properties
| Question category | Odds ratio | 95% Confidence interval | p-value |
|---|---|---|---|
| Binary classification with multiple answers | 1 | Reference | |
| Multiple-choice | 1.005 | 0.246–4.014 | <0.01 |
| Binary classification with a single answer | 0.994 | 0.045–21.832 | 0.207 |
Our search query system was developed to find the output for “did not understand” as a learning outcome. As an output method, we attempted to create a word cloud and co-occurrence network diagram. Both text-mining methods are considered useful for outputting the main themes not acquired during learning. However, the co-occurrence network diagram, where sub-queries are linked as satellite nodes, is structured in a way that makes it easier to identify the “details of did not understand,” which is what we are most interested in. The negative correlation between search volume and accuracy, regardless of question type, supports this conclusion. This may be influenced by question quality and unit difficulty, suggesting students searched for uncertain terms. These findings align with our hypothesis. Therefore, the co-occurrence network diagram is the most suitable method for clearly outputting what has “did not understand” as a learning outcome. However, an excessively high search query volume may not necessarily sign a positive outcome. The motivation for students to look-up may be attributed to communication errors in lectures. Additionally, a gap between the lecture content level and students’ academic level can lead to increased look-ups. In other words, search volume can serve as an indicator of the need for course improvement. Our proposed method is expected to help not only in correcting communication errors, but also in aligning lecture content with students’ proficiency levels.
Text-mined words were more frequently related to the question text than to the answer choices. One reason is that some students copied and pasted the question text directly into the search engine. Students also know that exam questions are sometimes taken directly from past national exams or are slightly modified by instructors. Therefore, such behavior aimed at scoring points is understandable. However, when the question text itself is mined, it can become noise in the output data intended to reveal “what was not understood” as a learning outcome. In order to reduce such noise, it may be necessary to implement measures, such as utilizing a block program to check for similarities in the question text. However, when we scrutinized the content of the searches by question format, an interesting finding emerged. In “Binary classification with multiple answers” questions, words related to the incorrect answer choices were more frequently searched than those related to the question text. This may be because the students realize that simply searching for the main topic won’t lead them to the information they need. Interestingly, among the related words searched from the answer choices, incorrect answers were searched for more often than correct ones. While presumably, incorrect answers are searched more frequently simply because there are three incorrect statements compared to two correct ones in a five-choice question; the breakdown was as follows: 11% of the searches were related to the question text, 24% to correct answers, and 65% to incorrect answers. This means that incorrect answers were searched 2.7-fold more often, suggesting that students focus on incorrect answers. Two types of psychological behaviors can explain why incorrect answers were sought. First, students search because they are completely unfamiliar with the content or cannot remember it. Second, when they suspect that a statement is incorrect, they search for it because they are not entirely sure. The latter case indicates that students are on the verge of understanding the incorrect content, representing a state of “almost acquiring” the knowledge. If the motivations behind searching for incorrect answers are further clarified in the future, it may provide insights for developing more concrete methods to improve educational approaches.
Search queries may be unsuitable for visualizing learning outcomes related to calculation questions. Regarding calculation questions, students appeared to think they could obtain the desired information faster by looking at a textbook rather than searching for the formula online. It seems necessary to consider a different approach to identify “did not understand” in calculation questions, including the retention of calculation formulas.
These results indicate that the search query system we devised enables various types of analysis depending on how the information is processed. This suggests that learning outcomes can be derived from multiple perspectives. In other words, the search query system has unique features that differ from existing methods, such as questionnaire analysis. The information obtained from the questionnaires depends on the respondent’s ability to articulate (cognitive ability)11). However, queries are based on combinations of words that can be looked up, which compresses the variability in expressions. Additionally, the information is simplified because queries are output as word combinations, making visualization easier. These outcomes may visualize a gap between the teacher’s intentions and the student’s responses. Our proposed method is expected to correct communication errors and align lecture levels with student’s abilities.
The intranet limits access to information compared to the Internet as educators curate content12). However, if restrictions on information need to be imposed, it may be beneficial to use this system to assess learning outcomes. However, the complexity of preparing webpages for Intranets is a major drawback. Additionally, learners may be discouraged from using the system if they feel limited in the information they can access. Unless there is a specific need to impose restrictions, tracking search queries via the Internet is a better approach.
User’s Web activity data can track (i) the search queries, (ii) the results returned by the search engine, (iii) the results the user clicked on, and (iv) any further actions taken by the user13). Thus, there is still plenty of room for further development of a learning assessment system based on search queries. However, this system must always prioritize the protection of personal information and should be handled with caution. As it is for educational purposes, it does not mean that learners should be completely exposed. Additionally, as we move further downstream in learning behavior, learners’ actions and thought processes become more divergent, making tracking and analysis more challenging. It is also necessary to determine how each piece of log information relates to Bloom’s taxonomy. Without this, analyzing log data may not provide valuable insights into learning outcomes. By focusing on a simple analysis of upstream learning behavior, as we have done, the system seems to fulfill its role in outputting learning outcomes sufficiently.
Search tasks are not suitable for learning tasks. Exploratory search has been proposed as a framework to support search activities aimed at learning or investigation9,14). This approach resembles web-based educational materials such as role-playing or case studies. A system that values divergent thinking, such as tabletop role-playing games, will likely foster critical thinking skills15). At least, this is something that the proposed system cannot foster. However, our method naturally outputs underachieving topics. This approach provides evidence for optimizing educators’ teaching strategies. Our system will likely contribute as a tool to ensure high-quality pharmacy education. By leveraging these insights, more efficient learning methods may be developed in the future.
S. Yamashita conceived the study. SY, S. Kimura, and A. Kiriyama taught the classes. AK anonymized the grading information for small tests. SY analyzed the data. SY and AK wrote the manuscript with input from all the authors. All the authors approved the final version of the manuscript.
We thank the unspecified number of students who participated in our attempt.
These is no conflict on interest related to be disclosed in relation to the contents of this paper.