Abstract
Objective: The aim of this study was to compare the noise attenuation (NA) properties of earplugs by using the headphone-based real-ear-attenuation-at-threshold (hREAT) and field microphone-in-real-ear (F-MIRE) techniques. Methods: The subjects were 89 male workers (mean age: 44.8 ± 12.1 yr) exposed to noise above 85 dBA (mean noise exposure period: 14.3 ± 11.3 yr) in a Japanese nonferrous metal manufacturing plant. They were confirmed to have pure-tone air-conduction hearing threshold levels (HTLs). The hREAT and F-MIRE NA values were measured by a Rion AG-20A and a 3M E-A-Rfit, respectively. Results: The NA values could not be measured by hREAT for four workers (hREAT-group). The mean NA of the earplugs for subjects for whom hREAT measurements were possible (hREAT+ group) was 26.0 ± 10.0 dB. The NA of the earplugs could be measured for all subjects using F-MIRE, and the NAs of the hREAT– and hREAT+ groups were 9.5 ± 8.7 and 21.0 ± 7.3 dB. The mean HTL value at 500 Hz to 2 kHz was 45.8 ± 3.1 dB for the hREAT– group, which was significantly lower than the value for the hREAT+ group, 18.0 ± 8.6 dB. Conclusion: Because there is a difference between the NA values obtained by hREAT and F-MIRE, it may be necessary to compensate for this difference. In addition, workers with hearing loss and the length of the measurement time need to be taken into consideration. Finally the F-MIRE method may be useful for educating workers about using earplugs in noisy workplaces.
Introduction
Noise-induced hearing loss (NIHL) is a common occupational hazard among workers exposed to noise in the workplace. According to the results of regular health checkups conducted in Japan in 2010, 15.3% of 268,330 workers exposed to noise were found to have abnormalities upon audiometric examination1). If it is impossible to control environmental noise, the use of hearing protection devices (HPDs) is effective in preventing NIHL2–4). Miyauchi reported that 29% of workers do not wear their earplugs correctly5). Previous studies have suggested that educating workers by quantitatively showing the noise attenuation (NA) effect of earplugs may be effective in convincing them of the importance of properly wearing such devices5–7).
All HPDs sold in Japan are required to be labeled with their laboratory-determined noise reduction ratings (NRRs). The degree of protection provided by HPDs in real industrial environments has been consistently found to be lower than their labeled NRRs4, 8). Although the NRR accounts for individual variability in laboratory measurements, it does not adequately compensate for real-workplace variability in the NA.
Two primary techniques are available for measuring the real-workplace attenuation performance of HPDs worn by individual workers: the real-ear-attenuation-at-threshold (REAT) and microphone-in-real-ear (MIRE) techniques8–14). The REAT technique involves psychophysical measurements of attenuation obtained by evaluating the audiometric hearing threshold levels (HTLs) for each subject with and without an HPD. The difference between the HTLs obtained with and without the HPD is equivalent to the NA, which is the difference in the noise levels in the ear canal obtained with and without the HPD.
The MIRE technique is used to obtain objective measurements of the attenuation through the use of either one microphone (placed in the ear canal during measurements with and without an HPD inserted) or two microphones (one placed inside the ear canal underneath an HPD and the other placed simultaneously outside the ear). The NA is the difference between the sound levels measured by the internal and external microphones.
A principal disadvantage of the field REAT technique is its time-consuming nature, since each frequency tested takes at least 30 s and a minimum of at least 1 min is required to test the fit in each ear. For this reason, it takes much longer if multiple frequencies are to be tested10). Furthermore, the results have an inherent variability, since the data rely on the listener's ability to track his or her own threshold. It is also hard to use the techniques for subjects with hearing loss8–10).
The measurement time is shorter for field MIRE (F-MIRE) than it is for field REAT. The actual measurement for any one fit in one ear takes about 10 s. F-MIRE, however, requires a microphone correction to account for the length of the probe tube between the microphone and the eardrum, and a post-computational correction is performed to account for the bone-conduction pathways that F-MIRE misses8–10).
Although both the REAT and MIRE techniques are intended to measure the same NA, they produce different estimates of attenuation13, 14). In Japan, headphone-based REAT (hREAT) is used widely in industrial workplaces5, 15). On the other hand, F-MIRE is rarely used. The aim of this study was to compare the NA values obtained by hREAT and F-MIRE in a metal manufacturing plant in Japan and to discuss the practical utility of F-MIRE in this environment.
Subjects and Methods
Subjects and working environment
The subjects were 89 male workers (mean age: 44.8 ± 12.1 yr) exposed to noise above the equivalent continuous A-weighted sound pressure level (LAeq) of 85 dBA in a nonferrous metal manufacturing plant in Japan. The mean noise exposure period for the subjects was 14.3 ± 11.3 yr. We fully explained this study, which had been approved by the safety and health committee of the plant, to the subjects, and all of them consented to participate. This study protocol was consistent with the Japanese Government's ethics guidelines regarding epidemiological studies and was reviewed by the institutional ethics board at Jumonji University.
Types of earplugs
In the plant, several types of earplugs were prepared for so that the workers could choose earplugs comfortable for their ears. The earplugs used by the subjects were classified into three types: roll-down foam earplugs (the foam is rolled into a tiny cylinder and inserted in the ear canal where it expands in place), stemmed-style pod plugs (the plugs are pushed into the ear canal), and premolded rubber-like plugs (usually with multiple flanges or sealing rings). The number of subjects using each of these three types of earplugs was 33, 25, and 31, respectively.
Noise attenuation
In June 2010, a checkup was conducted on all subjects in the morning before they were exposed to noise (more than 12 h after cessation of exposure to noise at work). They were confirmed to have pure-tone air-conduction HTLs at octave-band center frequencies ranging from 500 Hz to 8 kHz after being examined with an audiometer (AA-68N, Rion) equipped with headphones. The checkup was done in a testing booth (AT-61N, Rion) as part of the annual health checkup prescribed by the guidelines for the prevention of noise impairment in Japan. The NA values obtained by hREAT were measured by using a Rion AG-20A9), which is the most popular audiometer in Japan. The values of F-MIRE were measured by using a 3M E-A-Rfit10). Both measurements were carried out in a quiet room with a background noise less of than LAeq 40 dBA, as determined using a sound level meter (NA-29, Rion). Workers wore their usual expandable custom earplugs (foam plugs, stemmed-style pod plugs, or premolded plugs).
For the hREAT measurements done using the Rion AG-20A, the headphones were first fitted over the exposed ears, and then the start button was pressed. The subject continuously pressed the response button as long as he could hear the test sound (pure tone with a frequency of 2 kHz and an interruption period of 0.5 s) from the internal speakers of the headphone, and he released the button when he could no longer hear the sound. Second, subjects inserted their earplugs, the headphones were again placed over the ears, and the HTLs were measured. The difference between the HTLs with earplugs and without the earplugs was automatically calculated and expressed as the hREAT result.
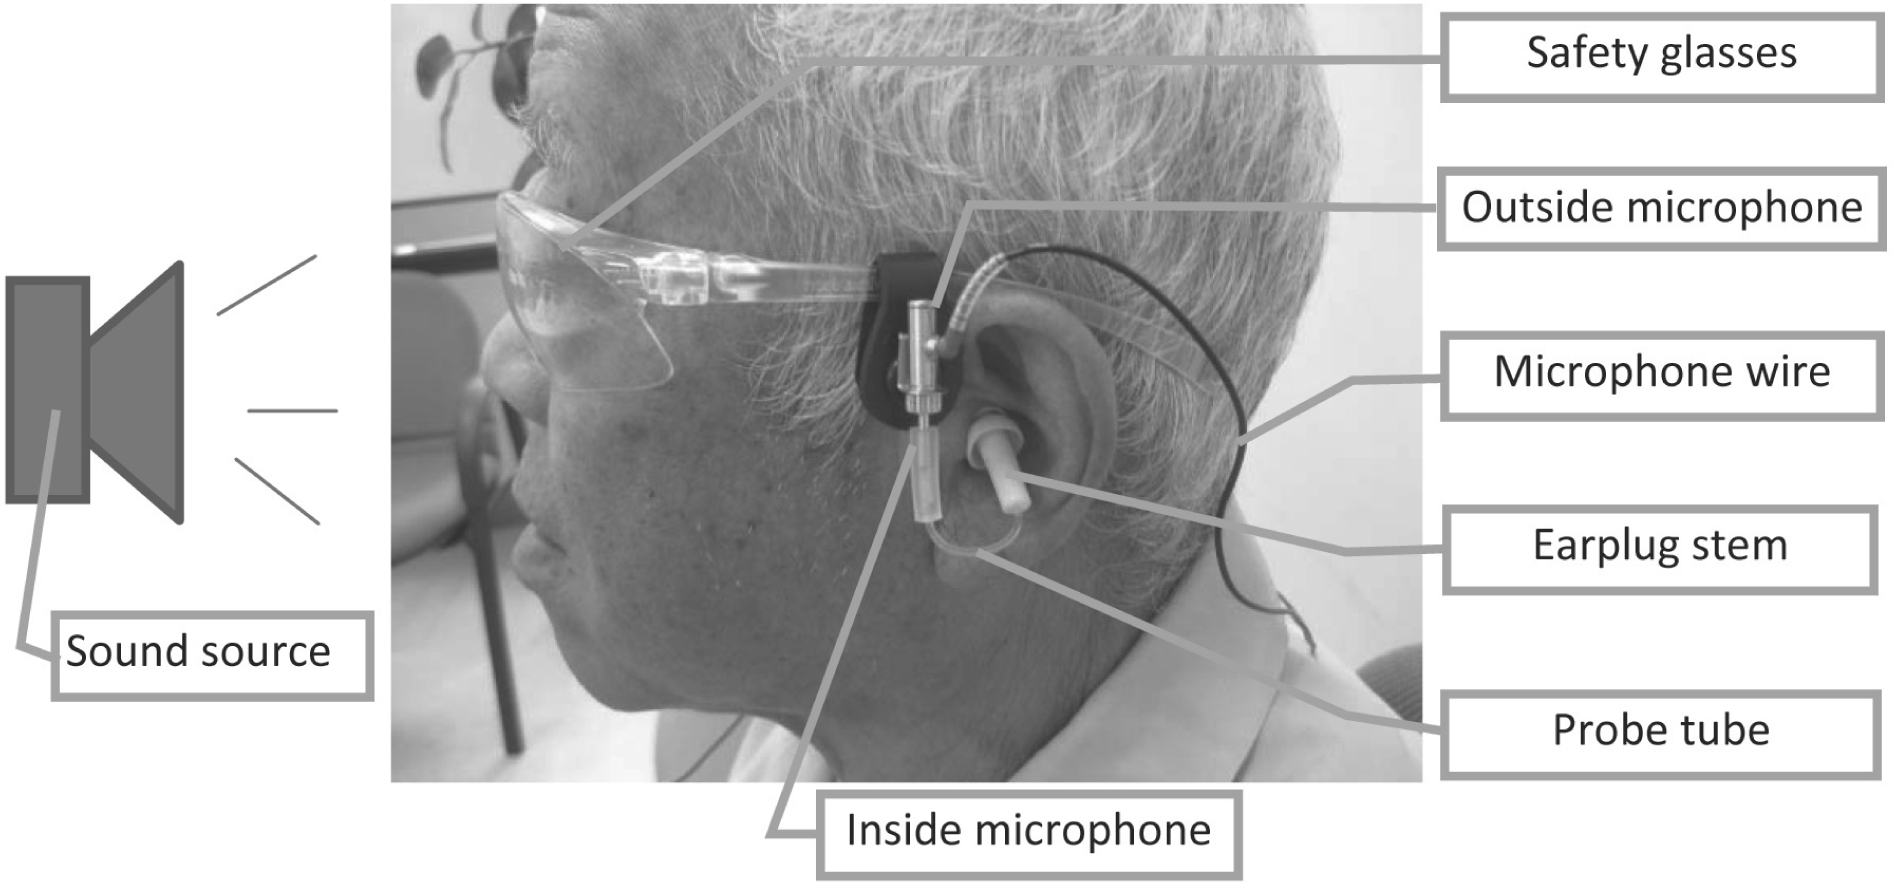
The F-MIRE measurements were performed using a 3M E-A-Rfit, which contained a tiny microphone capsule that was inserted into the ear canal and shielded from the external environment by an earplug (Fig. 1). One section of the dual-element microphone coupled to the earplug sampled the sound pressure levels in the ear canal, and the other section sampled the external sound field. The F-MIRE system used a dedicated spectrum analyzer to determine the noise reduction, as fitted, at seven octave-band test frequencies from 125 Hz to 8 kHz. The subjects used the same type of plugs or similar ones to the plugs they used for the hREAT measurement.
Depth of inserted earplugs
Photographs were taken of all the subjects when they were wearing the earplugs during the F-MIRE test. The depths of insertion were classified into three types: shallow (PI: about 10–30% of the plug inside the ear canal), standard (SI: about 40–60%) and deep (DI: about 70–100%). The depths were quantified (PI = 1, SI = 2, DI = 3) and used in comparison of the hREAT+ and hREAT– groups (as explained below).
Statistics
Data are expressed as means ± SD. Statistical analysis was performed with SPSS 17.0J for Windows.
The mean HTLs or NA values were analyzed using the Student's t-test. The significance of depths of the inserted earplugs as categorical variables was determined using the Student's t-test and one-way ANOVA. The correlation between the groups was evaluated using Pearson's correlation test. A significance level of 0.05 was used for all statistical tests.
Results
Audiometry
The mean values of the HTLs at 500 Hz, 1 kHz, 2 kHz, 4 kHz and 8 kHz for all the subjects were 21.2 ± 10.0, 16.5 ± 9.5, 19.2 ± 13.5, 25.0 ± 20.7 and 31.1 ± 22.3 dB, respectively (Table 1). The mean value of the HTLs at 500 Hz, 1 kHz and 2 kHz (HTLs,500Hz–2kHz = (500 Hz + 1 kHz + 2 kHz) / 3) was 19.9 ± 9.6 dB (Table 2), and the HTLs,500Hz–2kHz of 16 subjects exceeded 30 dB.
Table 1.
HTLs and the effect of earplug NA obtained by F-MIRE for groups for which NA could or could not be measured by hREAT
|
Frequency (Hz) |
|
hREAT |
n |
125 |
250 |
500 |
1,000 |
2,000 |
4,000 |
8,000 |
|
Mean ± SD |
Mean ± SD |
Mean ± SD |
Mean ± SD |
Mean ± SD |
Mean ± SD |
Mean ± SD |
| HTLs |
|
All |
|
178 |
n.m. |
n.m. |
21.2 ± 10.0 |
16.5 ± 9.5 |
19.2 ± 13.5 |
25.0 ± 20.7 |
31.1 ± 22.3 |
| Right |
hREAT+ |
86 |
n.m. |
n.m. |
23.8 ± 8.4 |
15.2 ± 8.2 |
17.9 ± 10.6 |
22.1 ± 17.7 |
23.4 ± 20.1 |
| hREAT– |
3 |
n.m. |
n.m. |
41.7 ± 7.6 |
38.3 ± 7.6∗ |
63.3 ± 2.9∗∗ |
78.3 ± 15.3∗ |
86.7 ± 11.5∗∗ |
| Left |
hREAT+ |
86 |
n.m. |
n.m. |
17.4 ± 9.5 |
16.2 ± 9.3 |
17.6 ± 12.0 |
24.2 ± 18.8 |
30.6 ± 20.9 |
| hREAT– |
3 |
n.m. |
n.m. |
36.7 ± 10.4 |
40.0 ± 8.7∗ |
55.0 ± 15.0∗ |
78.3 ± 16.1∗ |
88.3 ± 20.2∗ |
| Effect of earplug NA obtained by F-MIRE |
|
Right |
hREAT+ |
86 |
19.4 ± 8.0 |
18.0 ± 8.4 |
20.7 ± 11.0 |
25.5 ± 9.6 |
22.7 ± 6.7 |
27.0 ± 6.0 |
38.0 ± 7.7 |
| hREAT– |
3 |
9.0 ± 1.0∗∗ |
7.3 ± 1.5∗∗ |
7.7 ± 3.1∗∗ |
11.7 ± 8.3 |
8.7 ± 13.3 |
15.3 ± 13.6∗∗ |
26.3 ± 14.4 |
| Left |
hREAT+ |
86 |
18.0 ± 8.4 |
16.4 ± 8.7 |
18.2 ± 10.5 |
24.0 ± 9.8 |
21.4 ± 6.9 |
25.8 ± 8.1 |
36.9 ± 8.9 |
| hREAT– |
3 |
12.7 ± 4.6 |
10.0 ± 6.1 |
10.0 ± 8.7 |
13.7 ± 13.6 |
11.0 ± 10.0 |
15.0 ± 16.7 |
33.7 ± 11.9 |
n, number of ears. hREAT, headphone-based real-ear-attenuation-at-threshod. F-MIRE, field microphone-in-real-ear. hREAT+, group in which the effect of NA could be measured by hREAT. hREAT–, group in which the effect of NA could not be measured by hREAT. n.m., not measured. ∗p<0.05, ∗∗p <0.01; compared with the hREAT+ group.
Table 2.
Mean HTLs and mean NAs obtained by hREAT and F-MIRE for groups for which NA could or could not be measured by hREAT
|
hREAT+ group |
hREAT– group |
Total |
|
n |
Mean ± SD |
n |
Mean ± SD |
n |
Mean ± SD |
| HTLs,500Hz–2kHz |
172 |
18.0 ± 8.6 |
6 |
45.8 ± 3.1∗∗ |
178 |
19.9 ± 9.6 |
| Effect of earplug NA |
|
|
|
|
|
|
| hREAT |
172 |
26.0 ± 10.0 |
6 |
n.m. |
172 |
26.0 ± 10.0 |
| F-MIRE |
172 |
21.0 ± 7.3 |
6 |
9.5 ± 8.7∗∗ |
178 |
20.6 ± 7.6 |
n, number of ears. hREAT, headphone-based real-ear-attenuation-at-threshod. F-MIRE, field microphone-in-real-ear. hREAT+, group in which the effect of NA could be measured by hREAT. hREAT–, group in which the effect of NA could not be measured by hREAT HTLs,500Hz–2khz, mean value of HTLs at 500 Hz, 1 kHz and 2 kHz. n.m., not measured. ∗∗p<0.01 compared with the hREAT+ group.
The HTLs of four subjects (two wearing earplugs in both ears, one wearing an earplug only in the right ear, and one wearing an earplug only in the left ear) could not be measured by hREAT (hREAT-group); and this group had a mean value of 45.8 ± 3.1 dB for HTLs,500Hz–2kHz (Table 2). For the subjects whose NA could be measured by hREAT (hREAT+ group), the mean NA and HTLs,500Hz–2kHz were 26.0 ± 10.0 and 18.0 ± 8.6 dB. The mean value of the HTLs,500Hz–2kHz of the hREAT– group was significantly lower than that of the hREAT+ group.
In addition, the right HTLs at 2 kHz of the hREAT+ and hREAT– groups were significantly different from 17.9 ± 10.6 dB to 63.3 ± 2.9 dB, respectively, for the right ears and from 17.6 ± 12.0 dB to 55.0 ± 15.0 dB for the left ears. The mean value of the HTLs of the hREAT– group at 2 kHz was 59.2 ± 10.2 dB.
The NA could be measured for all subjects in this study by using F-MIRE. The NAs of the hREAT– and the hREAT+ groups were 9.5 ± 8.7 dB and 21.0 ± 7.3 dB, respectively. The NA measured by F-MIRE for the hREAT– group was significantly lower than that measured by F-MIRE for the hREAT+ group.
The values of the Pearson's correlation coefficients showed that the NA obtained by hREAT (excluding that of the hREAT– group) was related to that obtained by F-MIRE (for both ears, r=0.54 and p<0.001; for the right ear, r=0.52 and p<0.001; and for the left ear, r=0.48 and p<0.001). The mean [(NA of hREAT) – (NA of F-MIRE)] excluding the NA of the hREAT– group was 5.0 ± 8.8 dB.
The mean value of HTLs of the hREAT– group at 1 kHz and above was significantly lower than that of the hREAT+ group (Table 1). For the low frequencies measured by F-MIRE, less than 500 Hz and 4 kHz, the NA for the subjects of the hREAT– group wearing an earplug only in the right ear was significantly lower than that of the hREAT+ group.
Depths of the inserted earplugs and the NA obtained by F-MIRE
The numbers of subjects belonging to the PI, SI, and DI groups according to the depths inserted their earplugs were 27, 96 and 55, respectively, and their mean NAs obtained by F-MIRE were 9.9 ± 6.4, 20.9 ± 6.0, and 25.4 ± 5.1 dB, respectively (Table 3). The deeper the earplug was inserted, the greater was the increase in the NA effect. The mean value of the quantified depth that the earplug was inserted for the hREAT– group was 1.3 ± 0.5, which was significantly lower than that (2.2 ± 0.6) of the hREAT+ group.
Table 3.
Earplug insertion depth and mean NA obtained by F-MTRE
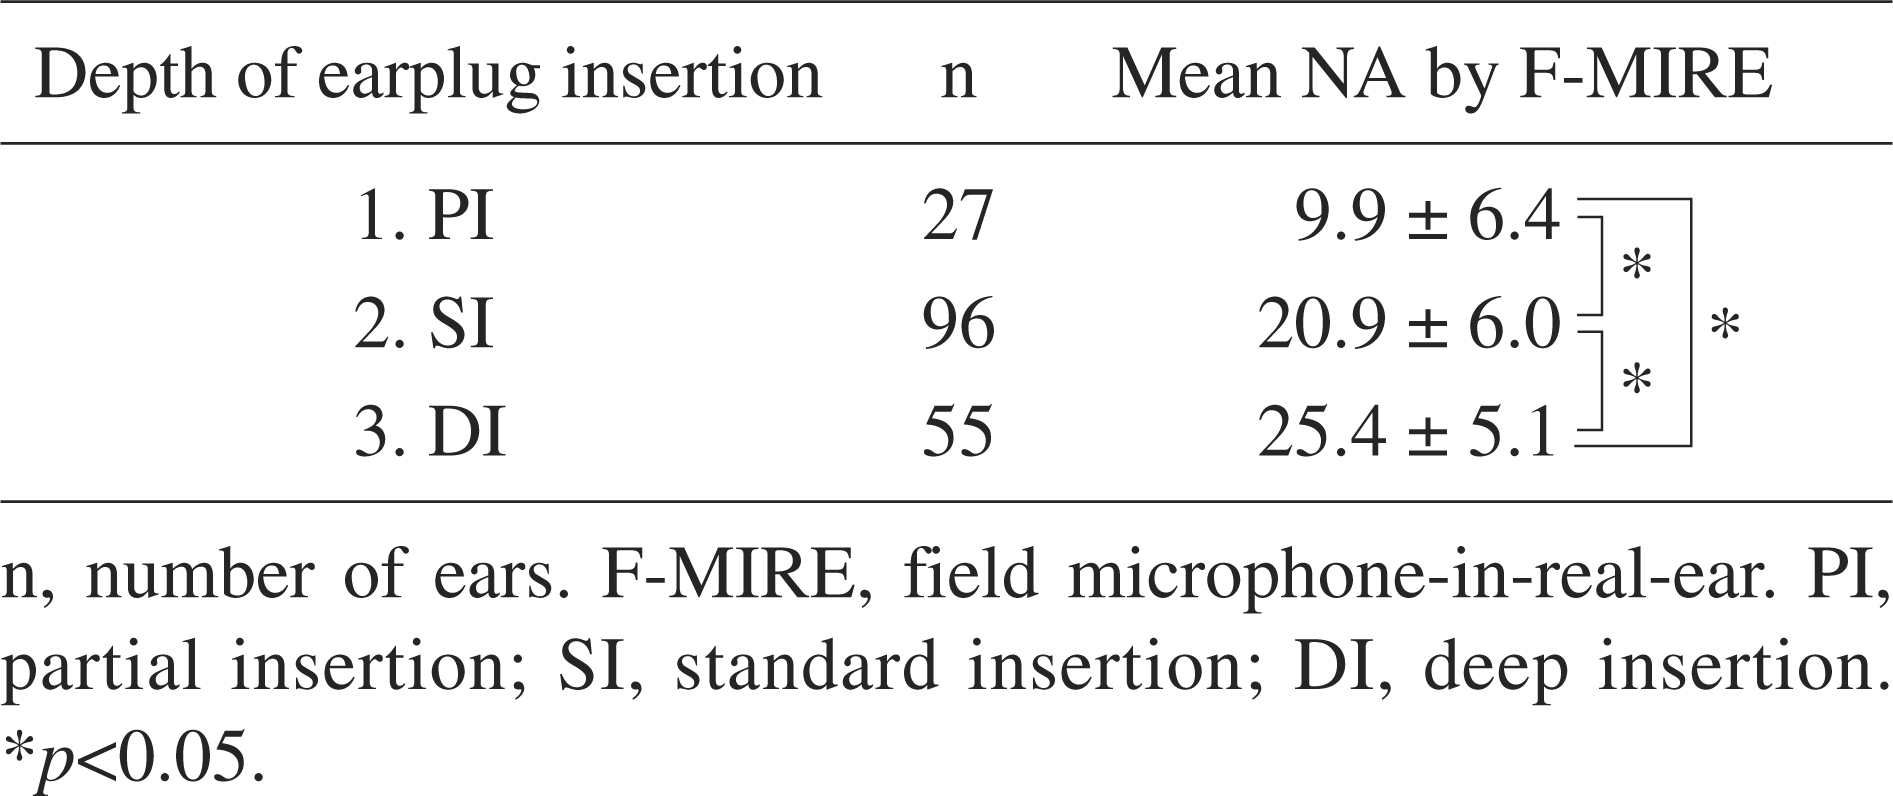
In other words, the members of the hREAT– group inserted their earplugs to a shallow depth.
Dependence of HTLs,500Hz–2kHz, NA by hREAT and F-MIRE on the types of earplugs
The mean HTLs,500Hz–2kHz for the foam, pod and premolded plugs were 17.8 ± 7.8, 22.3 ± 12.0 and 19.6 ± 9.0 dB, respectively (Table 4). The HTLs,500Hz–2kHz for foam plugs was a little lower than that of the other plugs. The values of NA obtained by hREAT and F-MIRE were 30.0 ± 5.4 and 22.6 ± 5.1 dB for foam plugs, 25.8 ± 8.8 and 18.8 ± 7.4 dB for pod plugs, and 23.4 ± 11.5 and 20.0 ± 9.4 dB for premolded plugs, respectively. The NA effect of the foam plugs as measured by F-MIRE was significantly larger than that of the pod plugs.
Table 4.
HTLS and effect of NA for different types of earplugs
|
Types of earplugs |
|
Foam type |
Pod type |
Premold type |
|
n |
Mean ± SD |
n |
Mean ± SD |
n |
Mean ± SD |
| HTLs,500Hz–2kHz |
66 |
17.8 ± 7.8 |
50 |
22.3 ± 12.0 |
62 |
19.6 ± 9.0 |
| Effect of earplug NA |
|
|
|
|
|
|
| hREAT# |
66 |
30.0 ± 5.4 |
45 |
25.8 ± 8.8 |
61 |
23.4 ± 11.5 |
| F-MIRE |
66 |
22.6 ± 5.1 |
50 |
18.8 ± 7.4∗ |
62 |
20.0 ± 9.4 |
n, number of ears. hREAT, headphone-based real-ear-attenuation-at-threshod. F-MIRE, field microphone-in-real-ear. HTLs,500Hz–2kHz, mean values of HTLs at 500 Hz, 1 kHz and 2 kHz. #Excluding subjects who could not be measured by hREAT ∗p<0.05 compared with the foam type.
Discussion
The mean NA values measured using the hREAT and F-MIRE techniques were 26.0 ± 10.0 dB (not including the hREAT– group) and 21.0 ± 7.3 dB, respectively. Previous studies have suggested that educating workers by quantitatively showing them the NA effect of earplugs may be effective5–7). Both test systems would benefit from a real-time automated screening function that would reject the measurements indicating a negative personal attenuation rating and require the worker to undergo retraining and retesting.
Tsukada et al. have reported that the percentage of workers who obtained a sufficient NA effect of 25 dB in both ears with the proper use of earplugs increased from 46% before training using hREAT to 72% immediately afterward6). These effects were still observed about two months after the intervention. These results suggest that quantitative feedback in individual training may be an effective means to increase both the usage rate and the proper use of HPDs. The advantage of using an objective F-MIRE technique is that the speed of the measurement process, typically 10 s or less, allows the testing of multiple refits, as the principal time cost is then the fitting of the plug and not the time devoted to obtaining the measured results12–14).
The mean value of the HTLs for the hREAT– group at 2 kHz was 59.2 ± 10.2 dB. Because the hREAT measurements taken by the Rion AG-20A used a pure tone with a frequency of 2 kHz, it may be difficult to measure the NA for subjects with hearing loss at 2 kHz using this method. Regardless of the subjects' hearing impairment, F-MIRE could measure the NA of all subjects in this study. This result may be because the objective measurements of the MIRE technique were made through the use of a microphone and did not depend on the subjective response8, 12).
The NA measured by F-MIRE for the hREAT– group was significantly lower than that for the hREAT+ group in this study (Table 1). Furthermore, the depths to which the earplugs were inserted by the hREAT– group were significantly shallower than those of the hREAT+ group. Therefore, the decrease in the NA for hREAT– group might result from the shallower earplug depths used by hearing-impaired workers. Many previous studies did not include severely hearing-impaired workers2–7, 9, 10, 12–15), but hearing-impaired workers are often present in very noisy workplaces. Occupational health staffs should guide workers in proper use of HPDs to prevent severe NIHL. F-MIRE appears to be useful for measuring NA for workers with severe hearing loss as well as for those with normal hearing.
The difference between the mean NA value measured by hREAT and that measured by F-MIRE might be caused by the difference in their computational methods. In the F-MIRE technique, the NA values were calculated at seven frequencies from 125 Hz to 8 kHz using the 3M E-A-Rfit8–10). The hREAT measurements were made using the Rion AG-20A only at 2 kHz15). It may be necessary to compare the NA measured by F-MIRE with that measured by hREAT, which can obtain measurements at a wider range of frequencies. However, it is difficult to measure the NA by hREAT at many frequencies in a real industrial workplace, because hREAT requires more time to measure the NA. We should evaluate the measurement of NA at other frequencies using hREAT in further research.
Moreover, there might have been inherent variability in the measurement by hREAT, since the data depended on the subject's ability to track his own threshold. The F-MIRE results were obtained by conducting objective tests for less than 10 s per ear, so this technique did not require a subjective test response. The sensor in this case was a suitably positioned microphone instead of the eardrum or the cochlea8–10). In this procedure, the positioning of the microphone in the ear canal or in the HPD was crucial so as to prevent it from materially affecting the performance of the HPD; this was true whether the HPD was a foam plug, stemmed-style pod plug, or premolded earplug16, 17). Therefore, it is inappropriate to compare the gross NA values obtained by hREAT with those obtained by F-MIRE; it is necessary to compensate for the values, when they are compared. In this study, the NA obtained by hREAT was related to that obtained by F-MIRE, and the mean of [(NA by hREAT) – (NA by F-MIRE)] was 5.0 ± 8.8 dB.
A method for estimating the REAT using NA measurements and associated compensation factors has been presented by Voix and Laville12). It requires a microphone correction to account for the length of the probe tube between the microphone and the eardrum and a post-computational correction to account for the bone-conduction pathways that MIRE leaves out8, 14). The NA measured by REAT differs from the NA measured by F-MIRE because of factors represented by the transfer function of the open ear (TFOE) (e.g., NA of REAT = NA of MIRE + TFOE)8), and these factors are frequency-, ear- and subject-specific14). Futhermore, measurements by F-MIRE could have the disadvantage that the earplugs used for F-MIRE allow some leakage through the probe tube. Thus, there is a difference between the mean values obtained using hREAT and F-MIRE.
Worn correctly and consistently, HPDs can prevent NIHL in virtually all cases11). The purpose of individual fit testing, as performed in the hREAT or F-MIRE techniques, is to train and motivate noise-exposed workers to wear their HPDs8–12). Occupational health staffs should be aware of all the features of hREAT and F-MIRE, and they should make use of this knowledge to prevent NIHL. In addition, workers with hearing loss and the length of the measurement time need to be taken into consideration, and the F-MIRE method may be useful for educating workers about using earplugs in noisy workplaces.
References
- 1) Japan Industrial Safety and Health Association. General guidebook on industrial health: Jpn Industrial Safety Health Assoc 2011; p.355 (in Japanese).
- 2) Edwards R, Green W. Effect of an improved hearing conservation program on earplug performance in the workplace. Noise Control Eng J 1987; 28: 55-65.
- 3) Savell JF, Toothman EH. Group mean hearing threshold changes in a noise-exposed industrial population using personal hearing protectors. Am Ind Hyg Assoc J: 48: 23-7.
- 4) Bruhl P, Ivarsson A. Noise-exposed male steel-metal workers using hearing protectors. A longitudinal study of hearing threshold shifts covering fifteen years. Scand Audiol 1994; 23: 361-77.
- 5) Miyauchi H, Imamiya S, Tanaka S. A study on the effect of training about fitting earplug using the Earphone-Support Device. J Jpn Safety Appl Assoc, Safety Health Digest 2000; 46: 2-6(in Japanese).
- 6) Tsukada T, Sakakibara H. A trial of individual education for hearing protection with an instrument that measures the noise attenuation effect of wearing earplug. Ind Health 2008; 46: 393-6.
- 7) Toivonen M, Pääkkönen R, Savolainen S, Lehtomäki K. Noise attenuation and proper insertion of earplugs into ear canals. Ann Occup Hyg 2002; 46: 527-30.
- 8) Berger EH, Franks JR, Lindgren F. International review of field studies of hearing protector attenuation In: Axlesson A, Borchgrevink H, Hamernik RP, Hellstrom P, Henderson D, Salvi RJ. Scientific basis of noise-induced hearing loss. New York (US): Thieme Medical Publishers; 1996, p.361-77.
- 9) Berger EH, Kieper RW. Hearing protection: surpassing the limits to attenuation imposed by the bone-conduction pathways. J Accust Soc Am 2003; 114: 1955-67.
- 10) Berger EH. Is real-ear attenuation at threshold a function of hearing level? J Acoust Soc Am 1985; 78: 1588-95.
- 11) ISO. Acoustics—hearing protectors —part 1: subjective method for measurement of sound attenuation In International Organization for Standardization 4869-1:1990 (E). Geneva (Switzerland); 1990.
- 12) Voix J, Laville F. The objective measurement of individual earplug field performance. J Acoust Soc Am 2009; 125: 3722-32.
- 13) Neitzel R, Somers S, Seixas N. Variability of real-world hearing protector attenuation measurements. Ann Occup Hyg 2006; 50: 679-91.
- 14) Casali J, Mauney D, Burks JA. Physical vs. psychophysical measurement of hearing protector attenuation—a.k.a. MIRE vs. REAT. J Sound Vib 1995; 29: 20-7.
- 15) Kondo M, Sakamaki K, Matsumoto H, Natsui H. Evaluation of an earphone-support device for measuring earplug attenuation. Work Environ 1994; 15: 57-62 (in Japanese).
- 16) Berger EH. What is a personal attenuation rating (PAR)? In: Berger EH. E-A-R 07-21/HP Indianapolis (IN): 3M 2010 1-6.
- 17) BergerEH. Hearing protection devices In: Berger E, Royster L, Royster J, et al., eds. The Noise Manual 5th ed. Fairfax (VA): Am Ind Hyg Assoc; 2003. p.379-454.

;%0A%09%09%09newWindow.document.open();%0A%09%09%09newWindow.document.write('<img src=%22./Graphics/54_310_2.jpg%22>');%0A%09%09%09newWindow.document.close();%0A%09%09)