Field Studies
State of Toner Exposure of Workers Who Handle Toners
2013 Volume 55 Issue 4 Pages 292-300

Details
2013 Volume 55 Issue 4 Pages 292-300
Objectives: The aim of this study was to ascertain the actual state of toner exposure of workers who handle toner. Methods: Personal exposure measurements were conducted on workers handling toner in which the respirable dust (RD) concentration by work type was determined. Targeted work types consisted of “machine recycling”, “toner manufacturing”, “toner research/development”, “machine design/development” and “servicing.” The implementation period lasted from April 2003 to March 2011, and measurements were conducted annually. The measurement method conformed to the Japanese Working Environment Measurement Standards (new standards adopted starting in 2005). Results: Comparing the RD concentrations for fiscal year 2003 by work, significant differences were found between machine recycling and the other four work types, as well as in toner manufacturing and the other four work types. Similarly, based on the new legislative standards applied in Japan from fiscal year 2005, significant differences were found between machine recycling and the other four work types, as well as in toner manufacturing and the other four work types. Discussion: It is clear that workers engaged in machine recycling and toner manufacturing are exposed to toner, and that a certain level of exposure is continuing. Although it cannot be said that workers involved in toner research/development, machine design/development and servicing have no toner exposure, the concentration is of an extremely low level. Conclusions: At present, toner exposure levels by work type can be divided into two groups—one consisting of machine recycling and toner manufacturing, and the other consisting of toner research/development, machine design/development and servicing.
(J Occup Health 2013; 55: 292-300)
Copy machines and printers are becoming popularized as devices that are essential for office work. Needs related to image quality were initially a substitution for handwritten characters. However, the current requirement has shifted to high-resolution image quality that is equivalent to that of professional commercial production printing. As the resolution of image quality depends on the toner droplet diameter, technological developments for reducing the diameter of toner droplets is progressing. Furthermore, it is predicted that toner droplet diameter will become smaller in the future, which is also driven by the needs for energy-saving and cost reduction.
Toner manufacturing methods are broadly divided into the two categories—the traditional pulverization method and the chemical manufacturing method, which is the newer manufacturing method. In the case of conventional toners (C-toners) manufactured using the pulverization method, raw materials are dissolved and kneaded while being heated and are subsequent classified into given droplet sizes after being cooled and crushed. The chemical manufacturing method is virtually the opposite of the pulverization method, and particles of a given diameter are formed by agglomeration and fusion of raw materials. By using this method, it is possible to manufacture toners with a narrower particle size distribution and smaller diameters as compared with the pulverization method1).
In fiscal year 2002, Fuji Xerox Co., Ltd. commenced production of emulsion aggregation toners (EA-toners), which are types of chemical toner. The production ratio of EA-toners exceeded that of C-toners in fiscal year 2007, and the production ratio of EA-toners has continued to rise (Fig. 1).

Shifts in the production ratio of conventional toners and EA-toners (figures by Fuji Xerox)
EA-toner: emulsion aggregation toner. C-toner: conventional toner. yr: refers to fiscal year starting from April to March of the following year.
Based on the introduction of EA-toner production, comprehending the actual state of EA-toner exposure of workers was deemed necessary based on the viewpoint that EA-toners created using the new manufacturing method are a new chemical substance, and from the perspective of Fuji Xerox's social responsibility as a company. Thus, it was decided to ascertain the actual state of toner exposure of workers handling toner. However, since it is not possible to ascertain the exposure to EA-toner alone, this research was conducted in environments with a mixture of EA-toner and C-toner exposure.
The targeted work consisted of five categories with significant possibilities for toner exposure—“toner manufacturing”, “machine recycling”, “toner research/development”, “machine design/development” and “servicing (maintenance and copying services for customers)” (Fig. 2). The subjects were workers regularly engaged in the targeted work at 13 workplaces including Fuji Xerox and those affiliates handling toner in Japan. On days when measurements were conducted, the Health Officer of the relevant workplace designated a number of workers who were mainly engaged in the targeted work. The subjects were orally briefed on the study, and their consent was obtained.
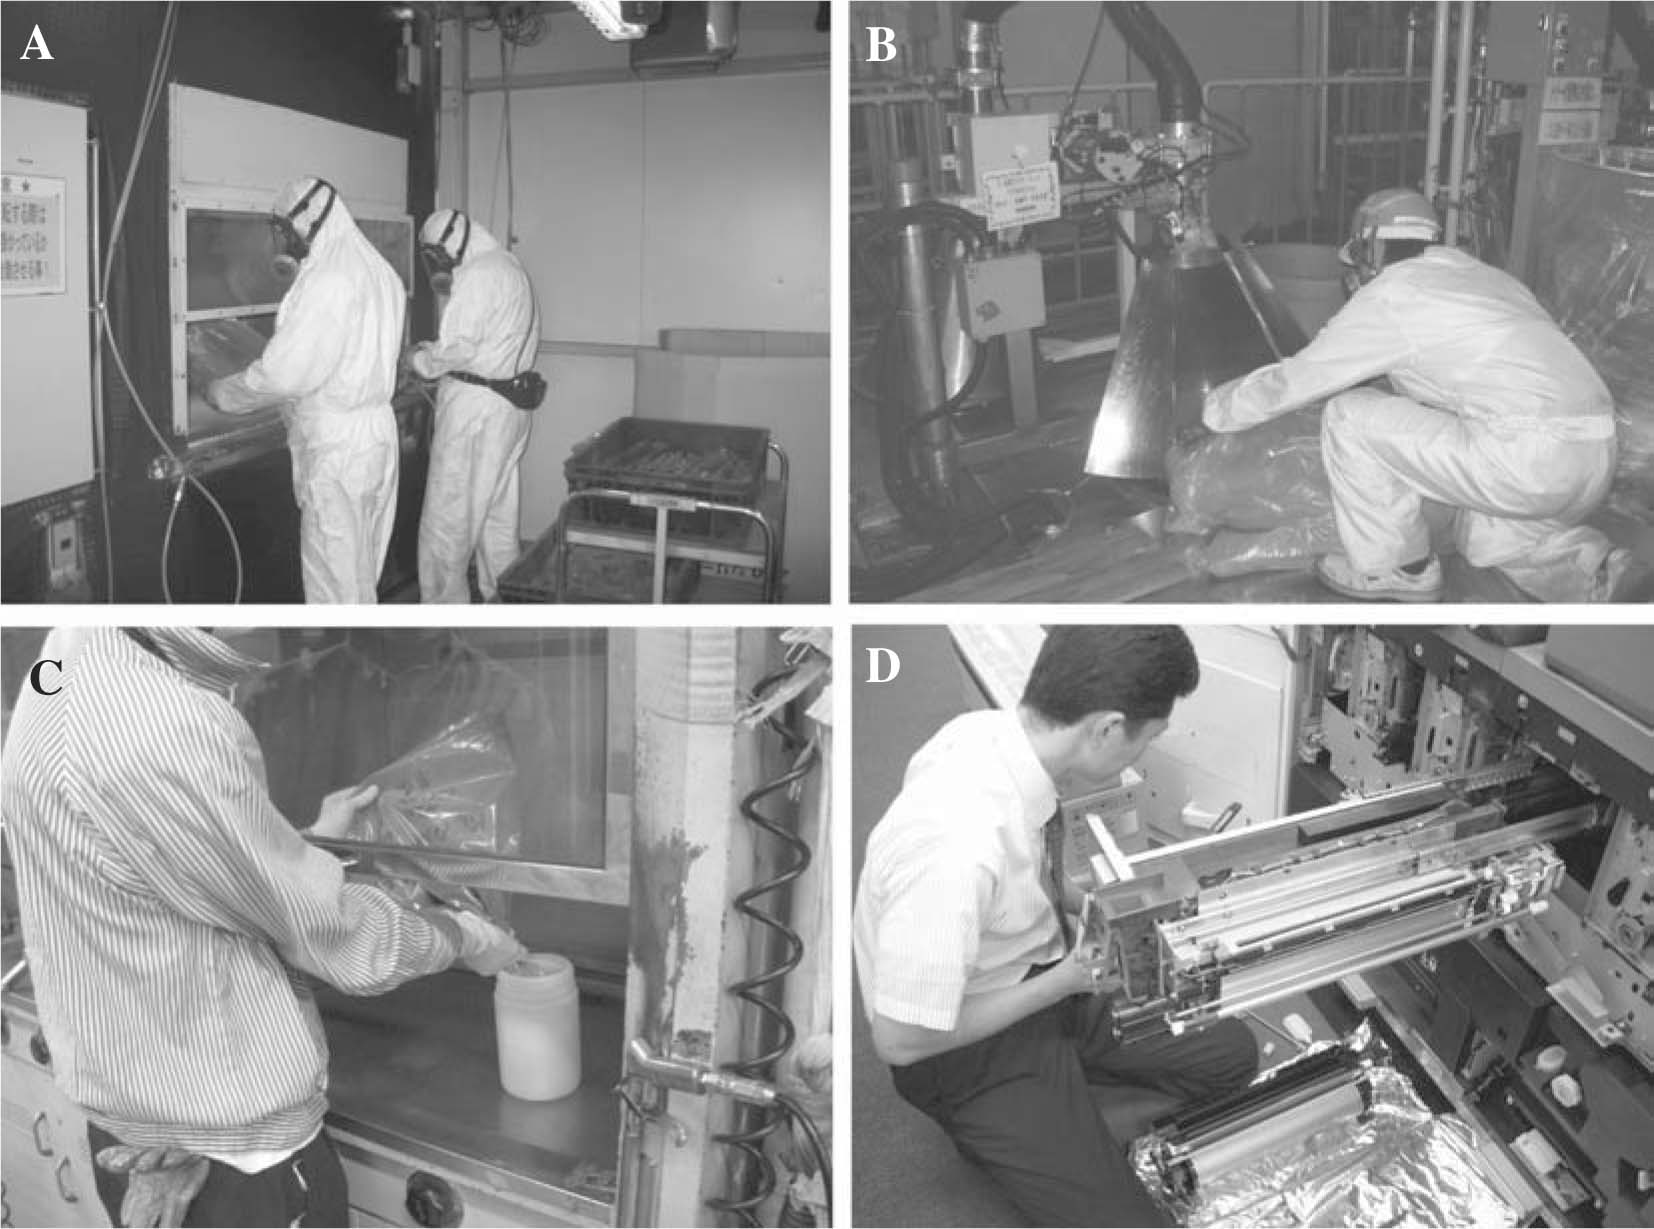
Toner work
A: Machine recycling. Boxes containing machines and cartridges recovered from the market are opened, and the items are sorted, dismantled, disassembled, and cleaned. This photo is of a worker removing toner that was adhered to a recovered toner cartridge using an air gun. B: Toner manufacturing. Refers to the process from when raw materials are input until the created toner cartridge is filled, including sampling for the purpose of evaluating products. This photo is of the first process for filling the cartridge with toner; and the worker is introducing toner into the filling equipment. C: Toner research/development. Development of new toners and evaluation of toners that have been turned into a product. This photo is of a worker weighing the toner inside a draft chamber. D: Servicing. Maintenance and repair of machines. Includes work for customers' copy services. This photo is of a worker performing maintenance at a customer's office.
The first year of the study was from April 2003 to March 2004 (fiscal year 2003), and the study was further implemented once a year until fiscal year 2010, with a year being April to March, which is the fiscal year of Fuji Xerox. Measurements were carried out during a period of either June to July or October to November, depending on the workplace. One of the two periods was fixed for each workplace for the following years.
Personal exposure measurement methodIn Japan, part of the Working Environment Measurement Standards was revised on April 1, 2005, and the definition of respirable dust was changed to “dust collected by a measuring instrument with a size classification characteristic of 4 µm (50% cut-point)” in accordance with the specifications of the International Organization for Standardization (ISO)2) (Notification No. 368 of the Ministry of Health, Labour and Welfare, 2004). This is a revision of standards related to the management of working environments in Japan, and is not related to personal exposure measurements; however, this research accommodates the revised standards. As a result, the measurement standards starting from fiscal year 2005 differ from those in fiscal years 2003 and 2004.
The measuring instruments and equipment further detailed in sections 1 and 2 below were used in taking measurements. Personal exposure measurements were performed with subjects wearing a sampler attached close to their shoulder area and a pump at their waist. Measurements were taken during working hours, with the exception of breaks.
1) Instruments and equipment used in fiscal years 2003 and 2004
In fiscal years 2003 and 2004, measurements were conducted according to the standard before the revision using “measuring instruments with a size classification characteristic of 5 µm (50% cut-point).”
For the sampler, a Filter Holder for Personal Total and Respirable Dust Sampler, (Model PS-43, Roken type, Sibata Scientific Technology Ltd., Soka, Saitama, Japan) equipped with glass fiber filters (PTFE binding and T60A20 type ϕ25 mm, Tokyo Dylec Corp., Tokyo, Japan) was used. For the sample pumps, AirChek 2000 Sample Pump (SKC Inc., Eighty Four, PA, USA) or Gilian GilAir-5 Air Sampling Pumps (Sensidyne, St. Petersburg, FL, USA) were used with a flow rate of 1.5 l/min, and an M3 (Mettler-Toledo International Inc., Columbus, OH, USA) was used as the microbalance. The sensitivity of M3 was 0.001 mg. 2) Instruments and equipment used in fiscal years 2005 to 2010
Starting in fiscal year 2005, measurements were conducted according to the standard after the revision using “measuring instruments with a size classification characteristic of 4 µm (50% cut-point).”
For the sampler, a Filter Holder for Personal Dust Sampler (Model NWPS-254, Sibata Scientific Technology Ltd., Soka, Saitama, Japan) equipped with glass fiber filters (PTFE binding and T60A20 type ϕ25 mm, Tokyo Dylec Corp., Tokyo, Japan) was used. For the sample pumps, AirChek 2000 Sample Pumps (SKC Inc., Eighty Four, PA, USA) or Gilian GilAir-5 Air Sampling Pumps (Sensidyne, St. Petersburg, FL, USA) were used with a flow rate of 2.5 l/min, and an MX5 (Mettler-Toledo International Inc., Columbus, OH, USA) was used as the microbalance. The sensitivity of MX5 was 0.001 mg.
With regard to the respirable dust (RD) concentration, the value obtained upon subtracting the weight of the filter (glass fiber filter) before dust collection from the weight of the filter after dust collection was deemed the “weight of collected dust”, and the RD concentration was obtained upon dividing this value by the amount of aspirated sample air multiplied by the sampling period and sampling flow rate. Since the phenomenon of the value of the weight of the filter after dust collection being smaller than that before dust collection was observed, when the amount of collected dust was less than 0.01 mg, RD concentrations were obtained by deeming such values as all being 0.01 mg.
Measurements were commissioned to the Kanagawa Health Service Association, and the process for replacing values less than 0.01 mg with 0.01 mg as explained above was implemented in accordance with the Association's policies.
Processing measurement resultsThe number of measurements conducted between fiscal years 2003 and 2010 was 1,199—136, 149, 160, 140, 169, 159, 149 and 137 measurements were conducted in 2003, 2004, 2005, 2006, 2007, 2008, 2009 and 2010, respectively. Among these, 58 measurement results with a sampling period of less than three hours and 26 measurement results for which the work contents could not be clarified were excluded. In addition, for the two measurements with RD concentrations of 33.3 mg/m3 and 11.1 mg/m3 (both in fiscal year 2007, in machine recycling), the state of work was confirmed individually, and since there was the possibility of re-entrainment due to toner being spilled, these values were excluded from the analysis as outliers, as their measurements concerning specific workers were distant from the annual values before and after measurements of other workers in the same work type.
Workers at Fuji Xerox work 7 hours and 36 minutes. The period during the work day in which toner was actually handled was set as the “sampling period”. The average sampling period was 359.3 (SD 59.4) minutes, and the average measurement time for each work type was 376.7 (SD 54.1) minutes for machine recycling, 355.8 (SD 60.0) minutes for toner manufacturing, 348.9 (SD 67.9) minutes for servicing, 351.4 (SD 56.8) minutes for machine design/development, and 348.6 (SD 52.8) minutes for toner research/development.
Statistical analysisSince the measured RD concentrations did not have a normal distribution, median values (MD) were used as representative values, and the interquartile range (IQR) was used as a rough indication of variation. The Kruskal-Wallis test was used for comparing the RD concentrations measured in the same fiscal year by work, as well as RD concentrations by work for different measurement years. The Steel test was used for multiple comparisons of concentrations by work for different measurement years, with fiscal year 2010 measurements as the control, and the Steel-Dwass test was used for multiple comparisons of RD concentrations by work in the same measurement year. The significance level was 5%. R 2.13.1 was used for data analysis.
Statistical analysis was commissioned to BIO Communications Inc.
It was confirmed that the dust collected in filters was from toner based on observations under an electronic microscope (Fig. 3) and infrared spectroscopy.
Table 1 shows the number of measurements, as well as the median values, IQR, minimum values, and maximum values. The shifts in the median value for RD concentrations in Table 1 are indicated in Fig. 4.
RD concentrations in fiscal year 2003 (by previous measurement standards)The median values for the five work types in fiscal year 2003, when measurements of personal exposure were initiated, were, in order from highest to lowest concentration, 1.05 mg/m3 for machine recycling, 0.06 mg/m3 for toner manufacturing, 0.03 mg/m3 for machine design/development, 0.03 mg/m3 for servicing, and 0.02 mg/m3 for toner research/development.
Upon comparing the RD concentrations for each work type within fiscal year 2003, there were significant differences among the five work types (Kruskal-Wallis test p<0.001). When a multiple comparison was conducted on the five work types (Steel-Dwass test), significant differences were found between machine recycling and toner manufacturing, machine recycling and toner research/development, machine recycling and machine design/development, and machine recycling and servicing, as well as between toner manufacturing and machine recycling, toner manufacturing and toner research/development, toner manufacturing and machine design/development, and toner manufacturing and servicing (all p<0.001).
RD concentrations in fiscal year 2005 (by new measurement standards)The median values for RD concentrations in fiscal year 2005, when measurements based on the new measurement standards were initiated, were, in order from highest to lowest concentration, 0.07 mg/m3 for machine recycling, 0.04 mg/m3 for toner manufacturing, 0.02 mg/m3 for toner research/development, 0.01 mg/m3 for machine design/development, and 0.01 mg/m3 for servicing.
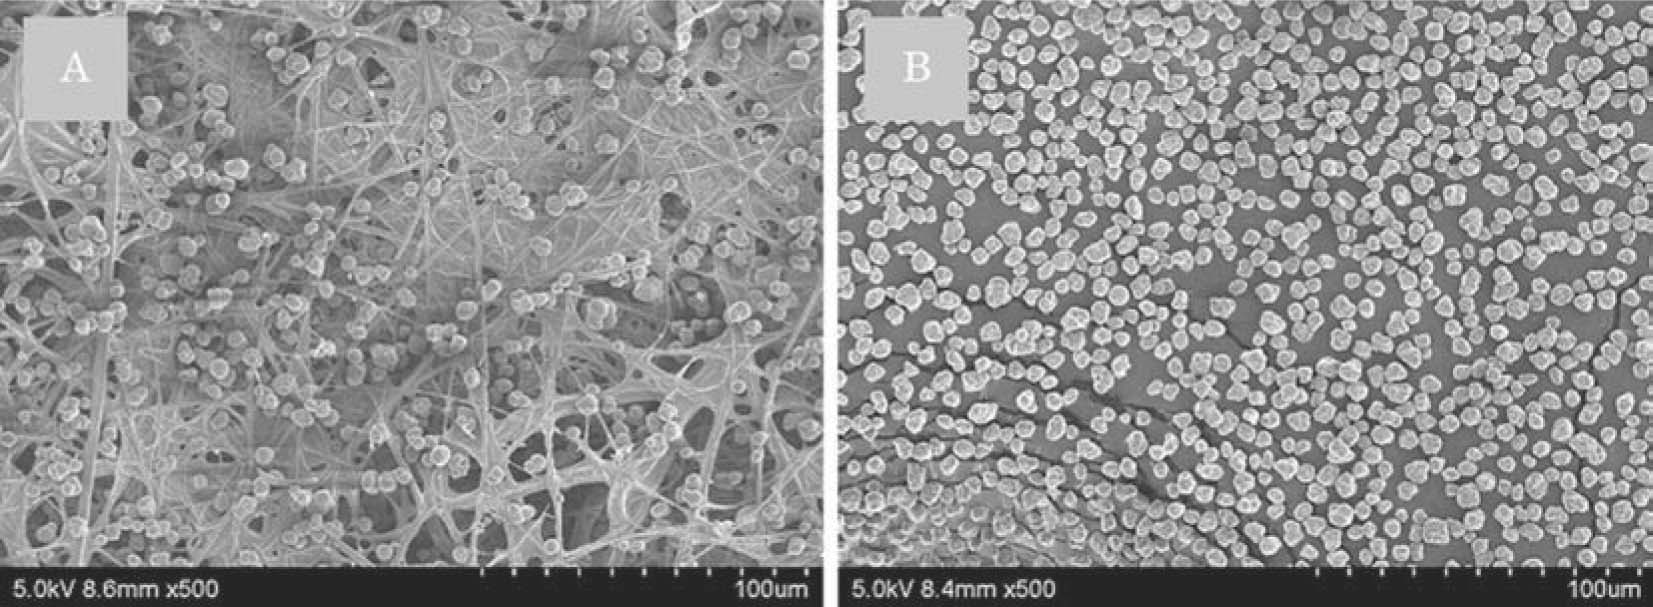
Toner collected under personal exposure measurement (observed under an electronic microscope).
A: toner on a filter collected in personal exposure measurement. B: emulsion aggregation toner (reference).
| 2003 | 2004 | 2005 | 2006 | 2007 | 2008 | 2009 | 2010 yr | p-value* | |
|---|---|---|---|---|---|---|---|---|---|
| Machine Recycling | |||||||||
| n | 23 | 29 | 33 | 34 | 50 | 44 | 45 | 48 | |
| MD, mg/m3 | 1.05 | 0.25 | 0.07 | 0.07 | 0.08 | 0.03 | 0.03 | 0.04 | |
| IQR, mg/m3 | 1.48 | 0.23 | 0.12 | 0.13 | 0.13 | 0.05 | 0.07 | 0.04 | 0.000 |
| Min, mg/m3 | 0.06 | 0.05 | 0.02 | 0.01 | 0.02 | 0.01 | 0.01 | 0.01 | |
| Max, mg/m3 | 3.55 | 2.73 | 2.09 | 1.04 | 1.04 | 1.13 | 1.28 | 0.48 | |
| Toner Manufacturing | |||||||||
| n | 62 | 65 | 72 | 60 | 73 | 70 | 67 | 61 | |
| MD, mg/m3 | 0.06 | 0.07 | 0.04 | 0.04 | 0.02 | 0.03 | 0.02 | 0.03 | |
| IQR, mg/m3 | 0.19 | 0.2 | 0.07 | 0.14 | 0.05 | 0.03 | 0.02 | 0.05 | 0.000 |
| Min, mg/m3 | 0.02 | 0.01 | 0.01 | 0.01 | 0.01 | 0.01 | 0.01 | 0.01 | |
| Max, mg/m3 | 11.23 | 2.66 | 0.96 | 1.78 | 1.16 | 1.69 | 0.34 | 1.71 | |
| Toner Research/Development | |||||||||
| n | 18 | 17 | 11 | 11 | 5 | 7 | 8 | 7 | |
| MD, mg/m3 | 0.02 | 0.04 | 0.02 | 0.01 | 0.02 | 0.01 | 0.02 | 0.03 | |
| IQR, mg/m3 | 0.04 | 0.05 | 0.00 | 0.00 | — | 0.00 | 0.01 | 0.01 | 0.066 |
| Min, mg/m3 | 0.01 | 0.02 | 0.01 | 0.01 | 0.02 | 0.01 | 0.01 | 0.02 | |
| Max, mg/m3 | 0.13 | 0.16 | 0.04 | 0.02 | 0.02 | 0.02 | 0.15 | 0.04 | |
| Machine Design/Development | |||||||||
| n | 10 | 12 | 11 | 11 | 9 | 5 | 9 | 1 | |
| MD, mg/m3 | 0.03 | 0.03 | 0.01 | 0.02 | 0.03 | 0.02 | 0.01 | — | |
| IQR, mg/m3 | 0.02 | 0.01 | 0.01 | 0.00 | 0.01 | — | 0 | — | 0.451 |
| Min, mg/m3 | 0.01 | 0.02 | 0 | 0.01 | 0.01 | 0.02 | 0.01 | 0.01 | |
| Max, mg/m3 | 0.05 | 0.03 | 0.18 | 0.03 | 0.04 | 0.02 | 0.02 | 0.01 | |
| Servicing | |||||||||
| n | 14 | 16 | 22 | 17 | 16 | 17 | 11 | 12 | |
| MD, mg/m3 | 0.03 | 0.03 | 0.01 | 0.01 | 0.01 | 0.01 | 0.01 | 0.01 | |
| IQR, mg/m3 | 0.02 | 0.01 | 0.01 | 0.01 | 0.01 | 0.00 | 0.01 | 0.00 | 0.972 |
| Min, mg/m3 | 0.02 | 0.01 | 0 | 0.01 | 0.01 | 0.01 | 0.01 | 0.01 | |
| Max, mg/m3 | 0.05 | 0.12 | 0.03 | 0.04 | 0.04 | 0.05 | 0.04 | 0.02 |
*A Kruskal-Wallis comparison was conducted during fiscal years 2005 to 2010.
IQR: interquartile range. Servicing: maintenance and copying services for customers. yr: refers to fiscal year starting from April to March of the following year.
For cases in which the amount of collected dust was less than 0.01 mg, respirable dust concentrations were obtained by deeming such values as all being 0.01 mg.
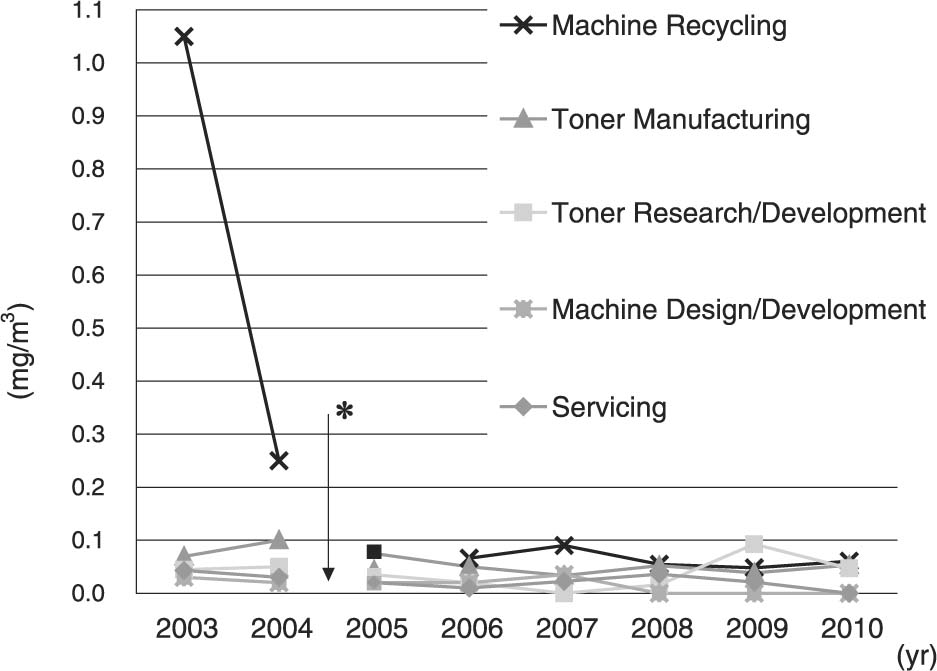
Shifts in respirable dust concentrations by year and type of work (median values)
*Based on revisions to the Working Environment Measurement Standards, a change was made from “dust collected using a measuring instrument with a size classification characteristic of 5 µm (50% cut-point)”, which was used until fiscal year 2004 to “dust collected using a measuring instrument with a size classification characteristic of 4 µm (50% cut-point)”, which was used from fiscal year 2005 onward.
Servicing: maintenance and copying services for customers. yr: refers to fiscal year starting from April to March of the following year.
Upon comparing the RD concentrations for each work type within fiscal year 2005, significant differences were found among the five work types (Kruskal-Wallis test p<0.001). When a multiple comparison was conducted on the five work types (Steel-Dwass test), significant differences were found between machine recycling and toner manufacturing, machine recycling and toner research/development, machine recycling and machine design/development, and machine recycling and servicing (all p<0.001), as well as between toner manufacturing and machine recycling (p=0.047), toner manufacturing and toner research/development (p=0.043), toner manufacturing and machine design/development (p=0.029) and toner manufacturing and servicing (p<0.001).
Comparison of RD concentrations by work for each measurement yearAll RD concentration measurements starting in fiscal year 2005 were in the range of 0.01 to 0.08 mg/m3.
For machine recycling, a significant difference was observed in the RD concentrations from fiscal years 2005 to 2010 (Table 1). In a multiple comparison using fiscal year 2010 measurements, which was the final year in which measurements were conducted, as the control, significant differences were observed between fiscal years 2010 and 2005 (p<0.001), 2010 and 2006 (p<0.001), and 2010 and 2007 (p<0.001).
For toner manufacturing, significant differences were observed between each year (Table 1) and in a multiple comparison (Steel test), a significant difference was observed between fiscal years 2010 and 2006 (p<0.001).
For toner research/development, machine design/development, and servicing, there were no significant differences observed among the different years (Table 1).
The EA-toner (black) shown in Fig. 5, consists of 60-70% styrene-acrylate resin, 10-20% ferrite powder (iron oxide, manganese oxide), <10% polyethylene, <10% amorphous silica, <10% carbon black, and <1% titanium dioxide. The C-toner (black) consists of 70-80% polyester resin, 10-20% ferrite powder (iron oxide, manganese oxide), <10% amorphous silica, <10% carbon black, and <1% titanium dioxide.
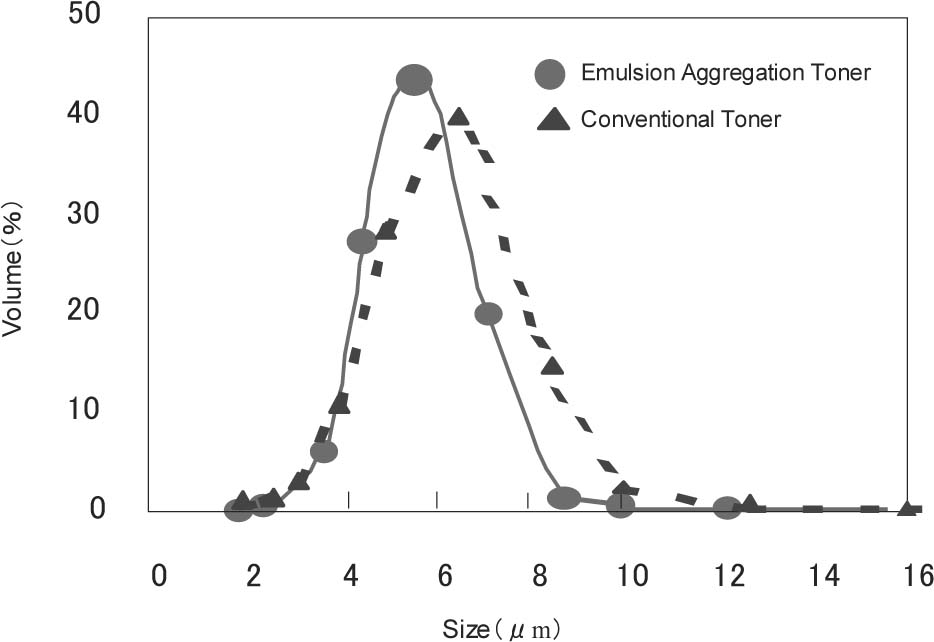
Particle size distribution of emulsion aggregation toner and conventional toner1)
Emulsion aggregation toner without classification.
Conventional toner with classification.
With regard to the health impacts of toner, as a result of conducting oral, transdermal, and inhalation-based acute toxicity tests using animals, there were no findings that suggest actual problems with regard to C-toners. In subchronic inhalation tests, although slight changes were observed in hematology and serum chemistry tests, there were no abnormalities observed in histopathology examinations, including examination of the respiratory system organs3). In chronic toxicity tests, although lung tumors occurred with intratracheal injection4), fibrosis of lungs was observed in all cases in the high-concentration exposure group in inhalation tests using rats, but lung tumors did not occur5). With regard to health impacts on humans, although there have been reports suggesting the possibility of siderosilicosis6) and granulomatous pneumonitis7, 8), there were no clear health impacts on the respiratory system in epidemiological studies using workers exposed to toner as subjects9). Even with regard to the mortality ratio, the standardized mortality ratios (SMRs) of workers exposed to toner were less than 1.0 for all cancers, lung cancer, respiratory disorders and cardiac disorders10). With regard to EA-toners, fibrosis of the lung was observed in chronic inhalation tests, but there was no occurrence of lung cancer11, 12). In epidemiological studies conducted under exposure to a mixture of C-toner and EA-toner, there were significant differences in some subjective symptoms of the respiratory system between the toner exposure group and the non-exposure group in baseline surveys conducted as part of a cohort study related to the health impact of toners, but there were no significant differences observed in chest X-ray examinations13), nor in biochemical examinations of blood, etc., or pulmonary function examinations14). The complaint rate of subjective symptoms decreased according to follow-up studies conducted five years later15). In addition, carbon black and titanium dioxide, which are toner components, are designated as being Group 2B in classifications by the IARC (International Agency for Research on Cancer)16). Based on these conditions, although Fuji Xerox is continuing to conduct surveys to comprehend the health impacts of toners, data related to the actual state of toner exposure of workers in the exposed group, including exposure to EA-toners, is essential to analyzing the results of such surveys.
Among the 1,113 measurements conducted in this study, 360 (32.3%) were measurements in which the weight of the collected dust was less than 0.01 mg. Upon calculating RD concentrations using only data for which the weight of the collected dust was 0.01 mg or more, the MDs for machine recycling, toner manufacturing, toner research/development, machine design/development and servicing were 1.05 (interquartile range: IQR=1.48) mg/m3, 0.07 (0.20) mg/m3, 0.05 (0.07) mg/m3, 0.03 (−) mg/m3 and 0.04 (0.02) mg/m3, respectively, in fiscal year 2003. In fiscal year 2005, they were 0.08 (IQR 0.12) mg/m3, 0.05 (0.08) mg/m3, 0.04 (0.03) mg/m3, 0.02 (0.03) mg/m3 and 0.02 (0.01) mg/m3, respectively. Upon comparing the different work types for measurement years (Steel-Dwass test), significant differences of p<0.001 were observed for both fiscal years 2003 and 2005. In results of these two comparisons, there was no clear difference in the overall measurement results, and therefore, reviews were conducted in this study using all 1,113 measurements.
When looking at the differences between each work type for each year, the RD concentrations in fiscal year 2003, the year in which measurements were initiated, machine recycling and toner manufacturing were high. In addition, as there was also a significant difference between machine recycling and toner manufacturing, the RD concentrations of the initial measurements conducted in fiscal year 2003 were divided into three levels—machine recycling, toner manufacturing and toner research/development; and machine design/development and servicing.
From fiscal years 2005 to 2009, when the new measurement standards were adopted, there were significant differences among the different work types each year. When looking at the results of multiple comparisons of work for each year, in fiscal year 2005, there were significant differences between recycling and the four other work types (toner manufacturing, toner research/development, machine design/development and servicing), as well as between toner manufacturing and the four other work types. In fiscal year 2006, there was no longer a significant difference between recycling and toner manufacturing, however, there were significant differences between recycling and the three other work types (toner research/development, machine design/development and servicing) as well as between toner manufacturing and the three other work types (toner research/development, machine design/development and servicing). It can be considered that the work types are divided into two groups; the first group consists of recycling and toner manufacturing, and the second group consists of toner research/development, machine design/development and servicing. From fiscal year 2007 onward, there were no significant differences between toner manufacturing and the three work types of toner research/development, machine design/development, and servicing, and in fiscal year 2010, there were no longer any significant differences among any work types. The RD concentrations in fiscal years 2007 and 2008, during which significant differences were observed between the different work types, were distributed over the ranges of 0.03 to 0.04 mg/m3 for recycling, and 0.01 to 0.03 mg/m3 for the other four work types. It is therefore perceived that differences between each work type had already been eliminated.
Incidentally, although dust was collected using a measuring instrument with a size classification characteristic of 5 µm (50% cut-point) as the measurement standard for RD in fiscal year 2003, dust was collected using a measuring instrument with a size classification characteristic of 4 µm (50% cut-point) in fiscal year 2005 in accordance with a revision to Japan's Working Environment Measurement Standards. In the case of standard toner samples manufactured by Fuji Xerox, the average particle diameters are 6.5 µm for C-toners and 5.8 µm for EA-toners (Fig. 5)1), and it can be conjectured that this change in measurement standards affects the results of this study. As a result, when looking at annual shifts by work type, it is not possible to compare the measurement results from fiscal years 2003 and 2004 with those from fiscal year 2005 onwards using the data as is.
According to the “Reason for Recommendation of Provisional Values on Occupational Exposure of Dust” of the Committee for Recommendation of Occupational Exposure Limits of the Japan Society for Occupational Health17), the “concentration ratio of dust collected using 4 µm (50% cut-point) and 5 µm (50% cut-point) particle diameters is approximately a reciprocal of 0.1 to 0.8, and can be estimated as being roughly 0.9”. When this value 0.9 is used as is, the values for recycling and toner manufacturing are 0.94 mg/m3 and 0.05 mg/m3 in fiscal year 2003, and 0.22 mg/m3 and 0.06 mg/m3 in fiscal year 2004, respectively. When looking at the shifts in RD concentrations from fiscal years 2003 to 2010 using the calculated equivalents, the RD concentration for recycling in fiscal year 2003, which is when measurements were initiated, was the highest and is inferred to have decreased in subsequent years. For toner manufacturing, the concentration was 0.05 mg/m3, 0.06 mg/m3 and 0.04 mg/m3 in fiscal years 2003, 2004 and 2005, respectively; however, the maximum values were 10.1 mg/m3, 2.39 mg/m3, and 0.96 mg/m3, respectively, thus indicating that the RD concentration was the highest in fiscal year 2003 and suggesting that it decreased in subsequent years. For toner research/development, machine research/development and servicing, the trends observed in recycling and toner manufacturing were not observed, and it is perceived that the concentrations were lower than when measurements were first taken.
The number of measurements in which the weight of the collected dust was less than 0.01 mg increased from 29 in fiscal year 2005 (19.5%) to 65 in fiscal year 2010 (53.6%). This is thought to be because it became harder to perform measurements in terms of sensitivity and precision using with the current measurement method. Moreover, for toner research/development, machine design/development, and servicing, approximately 60% of the measurement results from fiscal years 2005 to 2011 consisted of samples with weights of less than 0.01 mg, making it impossible make comparisons regarding on differences in exposure among these three work types.
Incidentally, the amount of dust collected over a period of 7 hours and 30 minutes at a distance of 1 m away from a single copy machine placed in a typical office at a height of 130 cm was less than 0.01 mg for all three days.
Based on the above, it is clear that there is an apparent amount of toner exposure from machine recycling and toner manufacturing. It was clarified that aside from slight variations, exposure is ongoing even today, and that although it cannot be said that toner exposures from toner research/development, machine design/development and servicing are nil, they are of an extremely low concentration.
The following two points are limitations of this study. The first point is that it was not possible to measure the RD concentration when the weight of the collected dust was less than 0.01 mg in this study. When 0.01 mg was set as the minimum limit for determination of the weight of RD, the minimum limit for determination of the RD concentration was 0.11 mg/m3 based on calculations using 360 minutes, which was the approximate average sampling period in this survey, and an inhalation flow rate of 2.5 l/min. This value is larger than the RD concentration of machine design/development and servicing for fiscal year 2010, and the measurement method in this survey cannot support the current Fuji Xerox toner exposure levels. The other point is that measurements for exposure to C-toner could not be separated from those for exposure to EA-toner in this study. In the future, it is necessary to develop new measurement methods that are specific for each type of toner. In addition, although the targeted work types in this study were limited to stationary work, it is also necessary to understand the extent of exposure of workers performing non-stationary work, as they are also exposed to toner. For this reason as well, it is necessary to develop new measurement methods.
At this point in time, toner exposure levels are clearly divided into two groups based on work types—one consisting of machine recycling and toner production and the other consisting of toner research/development, machine design/development and servicing.
Acknowledgments: The authors would like to express their deep gratitude to Professor Keizo Khono of the Graduate School of the University of Human Arts and Sciences, MD Kohno's Office for Occupational Health, Emeritus Professor Toshiaki Higashi of the University of Occupational and Environmental Health, Japan, and Denso Manufacturing Kitakyushu Co., Ltd. for assistance in organizing this study. The authors would also like to thank colleagues in the Chemicals Technology Development Dept., Marking Materials Technology Group of Fuji Xerox Co., Ltd. from whom they received information and knowledge concerning specialized techniques related to toners as well as cooperation for this study.