Abstract
Objective: The objective of this study was to present a new method for determination of hand-arm vibration (HAV) in Malaysian Army (MA) three-tonne truck steering wheels based on changes in vehicle speed using regression model and the statistical analysis method known as Integrated Kurtosis-Based Algorithm for Z-Notch Filter Technique Vibro (I-kaz Vibro). Methodology: The test was conducted for two different road conditions, tarmac and dirt roads. HAV exposure was measured using a Brüel & Kjær Type 3649 vibration analyzer, which is capable of recording HAV exposures from steering wheels. The data was analyzed using I-kaz Vibro to determine the HAV values in relation to varying speeds of a truck and to determine the degree of data scattering for HAV data signals. Results: Based on the results obtained, HAV experienced by drivers can be determined using the daily vibration exposure A(8), I-kaz Vibro coefficient (Ƶv∞), and the I-kaz Vibro display. The I-kaz Vibro displays also showed greater scatterings, indicating that the values of Ƶv∞ and A(8) were increasing. Prediction of HAV exposure was done using the developed regression model and graphical representations of Ƶv∞. The results of the regression model showed that Ƶv∞ increased when the vehicle speed and HAV exposure increased. Discussion: For model validation, predicted and measured noise exposures were compared, and high coefficient of correlation (R2) values were obtained, indicating that good agreement was obtained between them. By using the developed regression model, we can easily predict HAV exposure from steering wheels for HAV exposure monitoring.
(J Occup Health 2015; 57: 513–520)
Introduction
Moving vehicles produce noise and vibrations that cause discomfort to drivers and passengers. There are many sources of this noise and vibrations, such as the engine, wind, chassis, and road-tire interaction. Vibration causes excitation of the chassis structure, which is transmitted via mechanical vibrations into the driver's compartment, where it can be felt as vehicle interior vibrations in the seat, steering wheel, and/or body floor1). Hand-arm vibration (HAV) is the vibration received by hands that are in direct contact with the surfaces of vibrating parts, such as steering wheels, and hand tools that produce vibrations, such as hand drills, chain saws, and grinders. Exposure to vibration from a vehicle depends on several factors, such as the type and design of the vehicle, speed, and environmental conditions. There are some physical variables relevant to the effects of hand-transmitted vibration, such as magnitude, frequency, direction of vibration, duration of exposure, area of contact with vibration, contact force (grip and push forces), hand posture, and environment2).
HAV has been recognized as a significant hazard for the health and safety of workers. HAV syndrome (HAVS) is a general term embracing various kinds of health issues, including vascular disorders generally known as “vibration-induced white finger” (VWF). It causes impaired blood circulation and blanching of affected fingers and parts of the hand, neurological and musculoskeletal damage leading to numbness and tingling in the fingers and hands, reduced grip strength and dexterity, and reduced sensitivity both of touch and to temperature. Aström et al.3) compared the prevalence of symptoms of HAVS and musculoskeletal symptoms in the neck and upper limbs between professional drivers of terrain vehicles and a referent group. It was found that the drivers experienced some symptoms related to HAVS, such as numbness, a sensation of cold fingers, and blanching of the fingers, suggesting that there is a possible association between exposure to HAV generated from steering wheels in terrain vehicles and symptoms of HAVS. The drivers also experienced musculoskeletal symptoms in the neck, shoulders, and wrist. The results also suggested a relationship between symptoms and exposure time, especially for the musculoskeletal symptoms. In Malaysia, periodic medical examinations for workers using vibratory tools are not performed routinely because there is no provision under the national legislative framework. Workers are not aware of the risks of vibration hazards, and there is no safety training in relation to HAV4).
Various studies on HAV model development have been conducted by many researchers in order to estimate or predict HAV exposure via steering wheels. Rakheja et al.5) developed linear and nonlinear hand-arm vibration models using optimization and linearization techniques. Three- and four-degree-of-freedom (DOF) linear, piecewise linear, and nonlinear HAV models were formulated and analyzed to yield impedance characteristics in the 5 to 1,000 Hz frequency range. A local equivalent linearization algorithm, based upon the principle of energy similarity, was implemented to simulate the nonlinear HAV models. The HAV models were then utilized to study the vibration characteristics of hand-tool systems such as mechanical impedance and the ratio of driving force to the resulting velocity measured at the driving point. The majority of the HAV models invariably comprised linear and time-invariant inertial restoring and dissipative elements that do not represent the biomechanical properties of human hands and arms. This may be attributed to complexities in identifying the properties of human hands and arms and the associated non-linearities. Kazi et al.6) developed hand-arm mechanical models to investigate the biodynamic response characteristics in two- and three-DOF human hand-arm systems. Assessment of the biomechanical models was conducted to understand the modal deflection patterns of the human hand-arm system. The deflection patterns due to masses in the hand, forearm, and upper-arm, corresponding to different modes of vibration, were analyzed in terms of the vibration behaviour of the hand and arm. Based on the results of their study, it was concluded that there was not much difference in displacement when the signal was applied in different models and the frequency domain was the same.
The objective of this study was to present a new method for determination on HAV exposure in Malaysian Army (MA) three-tonne truck steering wheels based on changes in vehicle speed using regression model and the statistical analysis method known as Integrated Kurtosis-based Algorithm for Z-Notch Filter Technique Vibro (I-kaz Vibro). This study was conducted by examining the relationship between daily vibration exposure A(8) and the I-kaz Vibro coefficient (Ƶv∞). Studies concerning the relationship between other I-kaz coefficients (Ƶ∞) with noise and vibration parameters from vehicles have been conducted by several researchers. Aziz et al.7) developed regression models for predicting noise exposure using linear polynomial regression, which was then used to plot graphs for the correlation between Ƶ∞ and the A-weighted equivalent sound pressure level (LAeq) for tarmac and dirt roads. Regression analyses between the I-kaz 3D coefficient (Ƶ∞3D) and vibration dose value (VDV) were conducted by Ismail et al.8) and Aziz et al.9). For these studies, only tarmac roads were used as the test site. Therefore, differences in VDV due to different road surfaces could not be studied by them. Furthermore, Ismail et al. only recorded vibrations at two speeds, 30 and 60 kmh−1. Vibration at other speeds and while stationary, should be recorded so that trends of vibrations at different speeds can be seen very well.
Statistical Analysis Using Integrated Kurtosis-Based Algorithm for Z-Notch Filter Technique Vibro (I-kaz Vibro)
In this study, the I-kaz Vibro method was used to assist the signal analysis interpretation task. I-kaz Vibro was extended from the original I-kaz™ to suit collected raw data and different types of experiments10). I-kaz Vibro is used to measure the spread of data distribution by calculating the distance of each centroid signal from the raw data. This technique produces a graphical representation of the frequency distribution of the measured signal in each axis in addition to producing a value for Ƶv∞. The data dispersion and diffusion space can be observed in the I-kaz Vibro display, with higher values corresponding to a wider dispersion of data. This process will produce a 3D graphical representation of time domain signals measuring the acceleration, velocity, and displacement on the frequency distribution of the x-, y-, and z-axes, respectively.
To measure the scattering of the data distribution, the variances (σ2) for each axis, which are σA2, σV2, and σD2, are calculated, as shown in Eq. (1). The variance determines the average magnitude of deviation instantaneous points with respect to the mean value. The variance for N data points is mathematically defined as
where σA2, σV2, and σD2 and xiA, xiV, and xiD are the variances and data for the ith sample of time in the x-, y-, and z-axes, respectively; μA, μV, and μD are the means of each axis; and N is the number of data points. Ƶv∞ is computed in terms of σ2:
Eq. (3) can be simplified in terms of kurtosis (K) and standard deviation (σ). K is the signal's 4th statistical moment, which is the global signal statistic, and is highly sensitive to the spikiness of the data. For discrete data, K can be defined as
Therefore, the final I-kaz Vibro equation to compute Ƶv∞ can be written in terms of K and σ, as in the following equation:
where KA and σA are the kurtosis and standard deviation, respectively, for acceleration in the x-axis, KV and σV are the kurtosis and standard deviation, respectively, for velocity in the y-axis, and KD and σD are the kurtosis and standard deviation, respectively, for displacement in the z-axis.
Experimental Setup
The guidelines for the measurement and evaluation of human exposure to HAV are defined by the ISO11). The standard provides guidance on the quantification of HAV in relation to human health and comfort. A single-axis Brüel & Kjær piezoelectric accelerometer was placed on the top left side of the steering wheel. It was connected to a Brüel & Kjær Type 3649 vibration analyzer and controlled by the PULSE Version 8 software, which logged 800 times/s in units of ms−2 for a duration of 180 s. Accelerometer calibrations were conducted prior to all data collection sessions using a Bruel & Kjær Calibration Exciter Type 4294 with an oscillation frequency of 159.2 Hz and acceleration level of 10 ms−2 (root mean square, RMS). As shown in Fig. 1, all the collected data were stored in a portable laptop. The data were processed using MATLAB and Microsoft Excel to analyze the HAV from each run. The tangential direction acceleration time histories were measured under different conditions: idle, moving at speeds of 20, 40, 60, and 80 kmh−1 on a tarmac road, and moving at speeds of 10, 20, and 30 kmh−1 on a dirt road. It was demonstrated by Berber-Solano et al.12) that risk measurement error can be reduced by repeating measurements at least three times. The present study employed the same approach, with each HAV measurement repeated at least three times for each speed and different road type. All of the tests were performed for seven different trucks (Table 1) of the same model type, namely HICOM Handalan II, to obtain more realistic HAV exposure data for this type of truck.

Table 1.
Summary of
A(8) and
Ƶv∞ values for the various speeds of the trucks while driving on the tarmac and dirt roads
| Truck no. |
Road type |
Truck speed (km/h) |
Ƶv∞ |
Measured A(8) (ms−2) |
| 1 |
Tarmac |
0 |
5.55 × 10⁻⁵ |
1.40 |
| 3.74 × 10⁻⁵ |
1.43 |
| 6.09 × 10⁻⁵ |
0.62 |
| 20 |
8.45 × 10⁻⁵ |
1.56 |
| 1.66 × 10⁻⁴ |
1.52 |
| 1.30 × 10⁻⁴ |
1.59 |
| 40 |
2.04 × 10⁻⁴ |
1.72 |
| 6.59 × 10⁻⁵ |
2.72 |
| 1.08 × 10⁻⁴ |
2.89 |
| 60 |
3.05 × 10⁻⁴ |
2.78 |
| 2.03 × 10⁻⁴ |
2.05 |
| 2.40 × 10⁻⁴ |
2.18 |
| 80 |
4.70 × 10⁻⁴ |
4.39 |
| 7.60 × 10⁻⁴ |
7.30 |
| 3.82 × 10⁻⁴ |
3.41 |
| 2 |
Tarmac |
0 |
6.42 × 10⁻⁵ |
0.94 |
| 1.41 × 10⁻⁵ |
0.72 |
| 1.98 × 10⁻⁵ |
0.59 |
| 20 |
1.03 × 10⁻⁴ |
2.11 |
| 2.68 × 10⁻⁴ |
1.98 |
| 8.88 × 10⁻⁵ |
2.29 |
| 40 |
3.46 × 10⁻⁴ |
2.83 |
| 2.42 × 10⁻⁴ |
2.72 |
| 2.54 × 10⁻⁴ |
3.26 |
| 60 |
4.76 × 10⁻⁴ |
3.16 |
| 4.60 × 10⁻⁴ |
4.02 |
| 3.17 × 10⁻⁴ |
3.43 |
| 80 |
3.21 × 10⁻⁴ |
6.62 |
| 2.98 × 10⁻⁴ |
5.32 |
| 4.29 × 10⁻⁴ |
6.20 |
| 3 |
Tarmac |
0 |
1.38 × 10⁻⁴ |
1.64 |
| 1.36 × 10⁻⁴ |
1.44 |
| 1.38 × 10⁻⁴ |
1.57 |
| 20 |
2.15 × 10⁻⁴ |
1.74 |
| 2.18 × 10⁻⁴ |
2.00 |
| 4 |
Tarmac |
0 |
3.30 × 10⁻⁵ |
0.83 |
| 1.78 × 10⁻⁵ |
0.55 |
| 3.63 × 10⁻⁵ |
0.88 |
| 20 |
3.31 × 10⁻⁵ |
1.09 |
| 1.31 × 10⁻⁴ |
1.19 |
| 1.42 × 10⁻⁴ |
1.79 |
| 40 |
2.15 × 10⁻⁴ |
1.90 |
| 2.04 × 10⁻⁴ |
1.79 |
| 1.91 × 10⁻⁴ |
1.71 |
| 60 |
4.64 × 10⁻⁵ |
2.73 |
| 1.62 × 10⁻⁴ |
1.99 |
| 4.20 × 10⁻⁴ |
2.93 |
| 80 |
2.89 × 10⁻⁴ |
4.66 |
| 2.46 × 10⁻⁴ |
2.94 |
| 2.31 × 10⁻⁴ |
4.55 |
| 5 |
Dirt |
10 |
2.64 × 10⁻⁴ |
6.23 |
| 1.02 × 10⁻⁴ |
1.73 |
| 5.19 × 10⁻⁴ |
7.49 |
| 20 |
2.20 × 10⁻³ |
22.34 |
| 7.82 × 10⁻⁴ |
12.10 |
| 2.44 × 10⁻⁴ |
13.23 |
| 30 |
4.60 × 10⁻³ |
38.82 |
| 2.50 × 10⁻³ |
35.60 |
| 1.60 × 10⁻³ |
26.82 |
| 6 |
Dirt |
10 |
2.30 × 10⁻⁴ |
4.78 |
| 3.66 × 10⁻⁴ |
5.53 |
| 2.27 × 10⁻⁴ |
6.61 |
| 20 |
7.42 × 10⁻⁴ |
14.29 |
| 4.34 × 10⁻⁴ |
12.67 |
| 1.40 × 10⁻³ |
14.61 |
| 30 |
3.20 × 10⁻³ |
23.32 |
| 2.20 × 10⁻³ |
19.43 |
| 5.43 × 10⁻⁴ |
14.65 |
| 7 |
Dirt |
10 |
1.27 × 10⁻⁴ |
3.50 |
| 1.12 × 10⁻⁴ |
2.10 |
| 2.68 × 10⁻⁴ |
1.98 |
| 40 |
4.60 × 10⁻⁴ |
2.22 |
| 2.28 × 10⁻⁴ |
2.27 |
| 2.41 × 10⁻⁴ |
2.72 |
| 60 |
7.50 × 10⁻⁴ |
3.04 |
| 2.43 × 10⁻⁴ |
2.74 |
| 4.73 × 10⁻⁴ |
3.16 |
| 80 |
3.21 × 10⁻⁴ |
6.62 |
| 2.98 × 10⁻⁴ |
5.32 |
| 4.29 × 10⁻⁴ |
6.20 |
| 2.23 × 10⁻⁴ |
3.04 |
| 20 |
1.60 × 10⁻³ |
14.59 |
| 7.31 × 10⁻⁴ |
13.14 |
| 4.26 × 10⁻⁴ |
9.61 |
| 30 |
4.50 × 10⁻³ |
34.49 |
| 6.19 × 10⁻⁴ |
15.28 |
| 1.50 × 10⁻³ |
20.51 |
Noise levels inside the driver's compartment were also measured during the test, and it was found that the noise level increased with increasing speed. The noise level LAeq while driving at a speed of 20 kmh−1 on the rough surface of the dirt road (71.2 dB(A)) was higher than that while driving on the smooth surface of the tarmac road (70.9 dB(A)). On the day of the test, the weather was sunny, with temperatures ranging from 32 to 34°C, and both road surfaces were dry7).
The study by Aziz et al.13) on MA three-tonne trucks on paved roads that were not carrying loads found that the z-axis was the most dominant, with the highest RMS frequency-weighted vibration acceleration values compared with the x- and y-axes. Based on this finding, HAV acceleration was measured in the tangential direction relative to the steering wheel. The time histories of acceleration values were obtained from one-third octave band analysis in the frequency range up to 100 Hz, which is the frequency range of vibration in MA three-tonne truck steering wheels. While the single-axis accelerometer does not differentiate the rotational and translational components of the steering acceleration14), an approximation was made in this study to associate the z-axis acceleration time history as the dominant axis so that HAV could be monitored for this type of vehicle.
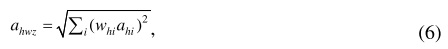
The values of tangential acceleration for the steering wheel were calculated using the following equations after the signal was digitally filtered with a frequency weighting factor (whi). The RMS frequency weighted acceleration (ahwz) was calculated as follows:
where ahi is the tangential RMS acceleration measured for the ith one-third octave band. The whi weighting was used in measuring and reporting hand-arm exposures for the purpose of quantifying HAV effects and risk of injury over the full frequency range covered by the one-third octave band from 6.3 to 1,250 Hz11).
For HAV, the daily vibration exposure A(8) is derived as the total vibration value from the ahwz.. The daily vibration exposure in terms of the 8-h energy equivalent was derived from the magnitude of the vibration (vibration total value) and daily exposure duration15). In order to facilitate comparisons between daily exposures of different durations, the daily vibration exposure was expressed in terms of the 8-h energy equivalent frequency-weighted vibration total value, as shown in the following equation:
where T is the total daily duration of exposure in s to the exposure ahwz and To is the reference duration of 8 h (28 800 s).
Results and Discussion
HAV exposures
The recorded data comprised HAV raw data measured with respect to time in the tangential direction relative to the steering wheel. The A(8) and Ƶv∞ for the various vehicle speeds calculated and tabulated separately for the tarmac and dirt roads are shown in Table 1. A(8) increased with increasing vehicle speed, indicating that the truck experienced higher vibration.
The physical effects generated by exposure to noise and vibrations have been extensively studied and are the basis of the international standards that govern acceptable occupational exposure levels16), including those for health risks related to vibration. For example, Directive 2002/44/EC of the European Parliament17) stipulates minimum standards for health and safety of workers exposed to HAV in terms of an exposure action value (EAV) and exposure limit value (ELV) associated with 8 h of daily exposure, in addition to requiring employers to reduce worker vibration exposure levels wherever it is practically possible. A previous study on Malaysian Armed Forces (MAF) tactical vehicles by Aziz et al.18) found that HAV is high in the driver's hands when the vehicle being driven is in the idle position, with the HAV value exceeding the EAV of 2.5 ms−2. This occurs because vibration from the engine and vehicle, which is very high during the idle phase, is directly transferred to the steering wheel. Overall, the level of HAV did not exceed the ELV, which is 5 ms−2. Studies conducted by Aziz et al.1, 13, 18) proved that all the drivers they tested felt uncomfortable with the vibration generated by the different types of tested vehicles.
The A(8) was selected for comparison with the standards stipulated by EU Directive 2002/44/EC. Table 1 shows that A(8) for the drivers exceeded the EAV, which is 2.5 ms−2, when the vehicle was moving on the tarmac and dirt roads, respectively. For the tarmac road, the A(8) did not exceed the exposure limit, which is 5 ms−2. On the other hand, for the dirt road, the A(8) was as high as 38.82 ms−2 when traveling at 30 kmh−1, which is higher than the exposure limit. Significant differences in vibration exposure across the two types of roads were also found. In general, driving on the dirt road resulted in the highest HAV exposures, while driving on the tarmac road resulted in lower exposures. The tarmac road had a flat, smooth surface and occasional unevenness, which resulted in minimum disturbances. The dirt road was an unpaved road made from subgrade materials and had many random irregularities that produced excessive casual vibrations. Expression of the vibration measures in 8 h equivalent values revealed that driving on most of the road segments resulted in vibration levels above the ELV. There were clear vibration exposure differences between the two vehicles when the road types were compared. For the dirt road, the trucks' exposures were above the EAV (2.5 ms−2) and ELV (5 ms−2), while for the tarmac road, only the EAV was exceeded. As shown in Table 1, the A(8) values obtained were in the range 1.73–38.82 ms−2 for driving on the dirt road. The highest A(8) value, 38.82 ms−2, shows that the vibration level is very high and not suitable for the safety and health of MA three-tonne truck drivers. This resulted in a higher amount of vibration being transmitted through the steering wheel and felt by the driver. The high A(8) value will cause injury to the hands, arms, and body, including impaired blood circulation damage to nerves, muscles, and soft tissue, which are of symptoms of HAVS, in truck drivers who drive on dirt roads for long durations, as experienced by workers in the construction industry and metalworking occupations.
I-Kaz vibro graphical representations of time domain data
Using the I-kaz Vibro method, the signals obtained can be used to generate graphical representations that show the values of Ƶv∞ (Fig. 2). I-kaz Vibro display is a 3D graphical representation of time domain signals showing the acceleration, velocity, and displacement time histories values on the x-, y- and z-axes, respectively. The figures show that for both types of roads, when the vehicle speed was increased, the range values of Ƶv∞ became larger. For driving on the tarmac road, the vehicle speed of 80 kmh−1 produced the highest value of Ƶv∞, 7.60 × 10⁻⁴, and the lowest Ƶv∞, at 1.41 × 10⁻⁵, was produced while the trucks were stationary. For driving on the dirt road, the Ƶv∞ value also increased proportionately as the truck's speed increased from idle to 30 kmh−1, with the highest value being 4.60 × 10⁻³. This finding is strongly supported by the greater space between the scattered Ƶv∞ values in the I-kaz Vibro displays. These graphical representations show larger spaces between the scattered Ƶv∞ values due to higher vibration exposure. Trucks moving on the dirt road had a large scattering of data due to their larger vibration exposure value, 38.82 ms−2, as compared with that for the tarmac road, 7.3 ms−2.

The curve fit method with quadratic polynomial regression was then used to plot the graphs for the relationships between A(8) and Ƶv∞ for tarmac and dirt roads. Figure 3 shows a quadratic linear regression graph between A(8) and Ƶv∞ with a high coefficient of correlation (R2) 84%. This indicates that 84% of the changes in A(8) are due to changes in the value of Ƶv∞, which varies with vehicle speed. Figure 3 also shows that 84% of the data representing the entire data plot between A(8) and Ƶv∞. The remaining 16% is from other factors that cannot be predicted due to other variables that were not investigated in this study. The R2 value can be improved by removing extreme or outlier data values and then recalculating R2. However, for this study, all outlier data were correct and valid values, and thus, they should not be removed.
The fitting equation is structured in the form of a quadratic polynomial equation as follows:
where y is the value of A(8), x is the value of Ƶv∞, and b and c are constant coefficients that depend on A(8) and Ƶv∞. Therefore, the developed equation for A(8) prediction for driving on the tarmac and dirt roads was as follows:
Figure 3 shows that A(8) increases with increasing Ƶv∞. Almost half of the total points plotted for A(8) are in excess of the ELV of 5 ms−2. This shows that the hands of drivers are exposed to very high levels of HAV when they are driving trucks, which can have a negative impact on health and safety. Most of the recorded high values of A(8) were observed when driving on the dirt road. This dirt road was an unpaved road made from subgrade materials and had many random irregularities that produced excessive casual vibrations. In comparison, the tarmac road was a flat, smooth surface with occasional unevenness, which resulted in minimum disturbances7).
The value of Ƶv∞ depends on the test condition's parameters, which in the case of this study were vehicle speed and A(8). By inserting the Ƶv∞ value into the equation above, the predicted A(8) for the steering wheel can be obtained. For example, under idle conditions, when the value of Ƶ∞3D is 3.74 × 10⁻⁵, the predicted A(8) is 1.43 ms−2. The value is small because no vibration other than that from the engine is generated and transmitted to the steering wheel when the truck is idle. When the truck starts to move, Ƶv∞ also changes, with the highest value for Ƶv∞ for the tarmac road, 7.6 × 10⁻⁴, producing an A(8) of 9.83 ms−2 and that for the dirt road, 4.6 × 10⁻³, producing an A(8) of 36.05 ms−2. When the truck is moving, vibration is transferred from the engine, road-tire interaction, rear cabin, and other sources to the steering wheel.
Model validation
In order to test the accuracy of the HAV exposure prediction model developed in this study, seven experimental sets from different three-tonne trucks were tested. This test was conducted to evaluate the capability of the developed regression model to predict HAV exposure from a steering wheel. The predicted HAV exposure was obtained using the developed equations. Figure 4 shows the scatter diagrams of the predicted versus measured HAV exposures, with R2 being 84.1%. An R2 of 100% is considered to be the best fit, whereas any value above 70% is considered to be a good correlation between variables. Furthermore, the graph fits very well, and the correlations between the predicted and measured HAV exposures follow the 45° line closely. Evaluation of most of the graph plots indicated that HAV prediction is more accurate and closer to the line at lower A(8) values than at higher A(8) values, with some values being located on the line. This shows that this model can be used more accurately on the tarmac road rather than the dirt road, which produced A(8) values below the ELV.

Conclusion
The interaction between road surfaces and truck tires has a major effect on the vibration generated and transferred to steering wheel. Regular exposure to vibration may cause various kinds of injury to the hands, arms, and body, including impaired blood circulation damage to nerves, muscles, and soft tissue, which are the symptoms of HAVS. Therefore, this paper discussed prediction of HAV exposure from the MA three-tonne truck steering wheel using regression model based on the I-kaz Vibro method. The ability to predict the level of HAV exposure in drivers' hand will make it possible to reduce the risk of drivers developing HAVS symptoms. The data required for the developed model include the A(8), vehicle speed, and Ƶv∞. It was found that A(8) increased gradually with increasing vehicle speed and Ƶv∞ value. In addition, these results were supported by the scattering of Ƶv∞ values in the I-kaz Vibro displays, which showed larger spaces between scattered Ƶv∞ values as the vehicle speeds increased. It was also found that the predicted HAV exposures generated by the regression model were close to the measured HAV exposures, with the R2 value of the developed regression model being 84.1%. This indicates that the developed model can be used to predict HAV exposure from the steering wheels of MA three-tonne trucks within acceptable limits. Evaluation of the predictions in this study showed that the estimated results are very accurate, and we encouraging application of the developed model for HAV exposure monitoring of the steering wheels of vehicles.
References
- 1) Aziz SAA, Nuawi MZ, Nor MJM, Daruis DDI. Study of noise, vibration and harshness (NVH) for Malaysian army (MA) 3-tonne trucks. Applied Mechanics and Materials 2014; 471: 74-80.
- 2) Griffin MJ. Measurement, evaluation, and assessment of occupational exposures to hand-transmitted vibration. Occup Envir Med 1997; 54: 73-89.
- 3) Aström C, Rehn B, Lundström R, Nilsson T, Burström L, Sundelin G. Hand-arm vibration syndrome (HAVS) and musculoskeletal symptoms in the neck and the upper limbs in professional drivers of terrain vehicles—A cross sectional study. Appl Ergono 2006; 37: 793-9.
- 4) Su AT, Fukumoto J, Darus A, et al. A comparison of hand-arm vibration syndrome between Malaysian and Japanese workers. J Occup Health 2013; 55: 468-78.
- 5) Rakheja S, Wu JZ, Dong RG, Schopper AW, Boileau P-É. A comparison of biodynamic models of the human hand-arm system for applications to hand-held power tools. Journal of Sound and Vibration 2002; 249: 1, 55-82.
- 6) Kazi S, Arry AAS, Zain MZ, Mailah M, Hussein M, Mat IZ. Biodynamic response of the human hand-arm models under vibration. in 10th WSEAS International Conference on Automatic Control, Modelling & Simulation (ACMOS'08) 2008; 237-42.
- 7) Aziz SAA, Nuawi MZ, Mohd Nor MJ, Daruis DDI. New regression models for predicting noise exposure in the driver's compartment of Malaysian army three-tonne trucks. Advances in Mechanical Engineering 2014; Article ID: 616093.
- 8) Ismail AR, Nuawi MZ, Kamaruddin NF, Nizam M, Rahman A. Whole body vibrations exposure to Malaysian driver by using novel iKaz method. Applied Mechanics and Materials 2012; 165: 21-5.
- 9) Aziz SAA, Nuawi MZ, Nor MJM, Daruis DDI, Bahari AR. Correlation between whole body vibration exposure and i-kaz TM 3D coefficient for Malaysian army 3-tonne truck drivers. Applied Mechanics and Materials 2014; 471: 156-60.
- 10) Nuawi MZ, Nor MJM, Jamaludin N, Abdullah S, Lamin F, Nizwan CKE. Development of integrated kurtosis-based algorithm for Z-filter technique. Journal of Applied Sciences 2008; 8: 1541-7.
- 11) ISO 5349-2. Mechanical vibration—Measurement and Evaluation of Human Exposure to Hand-Transmitted Vibration—Part 2: practical guidance for measurement at the workplace. 2001.
- 12) Berber-Solano TP, Giacomin JA, Ajovalasit M. Effect of steering wheel acceleration frequency distribution on detection of road type. Ingeniería Mecanica Tecnología y Desarrollo 2013; 4: 145-51.
- 13) Aziz SAA, Niuawi MZ, Nor MJM, Daruis DDI. Determination of dominant axis for hand arm vibration (HAV) In Malaysian army three-tonne truck steering wheels. Australian Journal of Basic and Applied Sciences 2014; 8: 14-6.
- 14) Gnanasekaran S, Ajovalasit M, Giacomin J. Driver estimation of steering wheel vibration intensity: laboratory-based tests. Engineering Integrity 2006; 20: 25-31.
- 15) Chaturvedi V, Kumar A, Singh JK. Power tiller: vibration magnitudes and intervention development for vibration reduction. Appl Ergon 2012; 43: 891-901.
- 16) Ljungberg JK, Neely G. Cognitive after-effects of vibration and noise exposure and the role of subjective noise sensitivity. J Occup Health 2007; 49: 111-6.
- 17) Directive 2002/44/EC. Minimum health and safety requirements regarding the exposure of workers to the risks arising from physical agents (vibration), Brussels: 2002.
- 18) Aziz SAA, Sohaimi RM, Pu'ad MH, Yaman MAM. Noise, vibration and harshness (NVH) study on malaysian armed forces (MAF) tactical vehicle. Applied Mechanics and Materials 2012; 165: 165-9.