Abstract
The effect of glucosamine (GlcN) and N-acetylglucosamine (GlcNAc) on bone metabolism in ovariectomized (OVX) mice was studied. After 12 weeks of feeding with 0.2% GlcN and 0.2% GlcNAc, the femoral bone mineral density in OVX mice was significantly increased compared with that in OVX mice fed the control diet. Histomorphometric analysis of the tibia indicated that the rates of osteogenesis and bone resorption were reduced due to the GlcN diet. The erosion depth of osteoclasts on the tibia in GlcN- and GlcNAc-fed OVX mice was significantly lower than that in the control OVX mice. The number of tartrate-resistant acid phosphatase-positive osteoclasts induced from bone marrow stem cells isolated from GlcN-fed OVX mice was significantly lower than that from control OVX mice. A loss of uterine weight and higher serum calcium concentration in the GlcN- and GlcNAc-fed OVX mice were observed. The results suggest that the intake of GlcN suppresses bone loss by inhibiting osteoclast differentiation and activity in a nonestrogenic manner.
Bone is an important organ that not only provides shape and support to our body, but also regulates mineral concentration in the blood. The bone structure is maintained by a balance between bone formation by osteoblasts and bone resorption by osteoclasts.1) However, estrogen deficiency after menopause disrupts this balance, resulting in bone loss and eventually osteoporosis.2,3) Although the current effective therapies for osteoporosis include estrogen replacement therapy and bisphosphonates medication, these treatments can have side effects such as uterine carcinogenesis and bone quality reduction.4) Therefore, it is important to prevent osteoporosis through suitable diet and supplements.
N-Acetyl-D-glucosamine (GlcNAc), a naturally occurring amino monosaccharide, is an essential component of glycosaminoglycans in the cartilage and skin, as well as in fungal cell walls.5) Extracellular glucosamine (GlcN) is thought to be taken up into a cell via a glucose transporter, after which part of the GlcN is converted into GlcNAc.6) Intracellular GlcNAc is polymerized to form glycosaminoglycans such as hyaluronic acid.7,8) Extracellular GlcNAc is also incorporated into cells through the transporter and used inside of the cells. Orally ingested GlcN has been reported to be distributed to various tissues, including articular cartilage.9–11) Based on these findings, GlcN and GlcNAc are used as supplements to replenish glycosaminoglycans in the cartilage and skin tissue. Such products are typically prepared from chitin and chitosan present in crabs and shrimps.
Recent in vitro studies showed that GlcN and GlcNAc possess various biological regulatory functions such as reduction in inflammatory cytokines and inhibition of platelet aggregation.12–16) Igarashi et al. reported that these glucosamines can induce the differentiation of mouse osteoblastic MC3T3-E1 cells.17) Moreover, some in vivo arthritis model experiments suggested that GlcN might increase bone density.18,19) For example, Wang et al. demonstrated GlcN induced reduction in bone loss of the subchondral bone by anterior cruciate ligament transection in osteoarthritis rabbit model.18) Another study reported that GlcN suppressed the receptor activator of nuclear factor kappa-B ligand (RANKL) expression of synovial CD3 T cells and bone resorption in collagenase-induced osteoarthritis model mice.19) However, in vivo experiments on the effects of these glucosamines on bone metabolism are limited and glucosamines have not been studied in relation to postmenopausal osteoporosis prevention. In addition, despite both GlcN and GlcNAc products are used, intake of GlcN and GlcNAc are not known whether the same action. Therefore, in this study, we assessed the inhibitory effect of GlcN and GlcNAc on bone loss in ovariectomized mice as a model of osteoporosis.
MATERIALS AND METHODS
Animal Experimental DesignSeven-week-old female ddY mice (n=84) were purchased from Tokyo Laboratory Animals Science Co., Ltd. (Tokyo, Japan) and fed with a AIN-93 G based normal diet (Table 1) and water ad libitum for 7 d for acclimatization. The mice were housed in individual cages in a temperature- and humidity-controlled room with a 12-h light–12-h dark cycle. After acclimatization, 63 mice were ovariectomized (OVX) and 21 mice were sham-operated (sham). The sham mice were fed with the normal diet, whereas OVX mice were divided into three groups to be fed with the normal diet (control, n=21), with 0.2% glucosamine hydrochloride-containing diet (GlcN, n=21), and with 0.2% GlcNAc diet (GlcNAc, n=21). These glucosamines were each replaced with cornstarch in the normal diet. Half of the mice in each of the 4 groups were bred for 4 weeks, while the remaining mice were bred for 12 weeks. After breeding, the blood samples were collected from the inferior vena cava of anesthetized mice. The blood samples were keeped for 1 h at room temperature and centrifuged at 2000×g for 15 min. The resulting supernatants were used as serum samples and stored at –30°C until further use. The weight of uterus was isolated and weighed. Mice in the OVX group in which the uterus did not reduce to less than half of that in the Sham group, were excluded from the analysis. Number mice that were finally analyzed were: 21 from the Sham group (10 from 4 weeks of breeding and 11 from 12 weeks of breeding), 19 from the control group (9 from 4 weeks of breeding and 10 from 12 weeks of breeding), 19 from the GlcN fed group (10 from 4 weeks of breeding and 9 from 12 weeks of breeding), and 20 from the GlcNAc fed group (10 from 4 weeks of breeding and 10 from 12 weeks of breeding). The right femurs were dissected to measure bone mineral density (BMD). The left femurs were used to obtain bone marrow cells for the culturing of osteoclasts. The right tibias were isolated and subjected to histomorphometric analysis, while sera were collected to measure the bone-related factors.
Table 1. Composition of Experimental Diets (%)
| Component | Group |
|---|
| Sham·Control | GlcN | GlcNAc |
|---|
| Corn starch | 53.2 | 53.0 | 53.0 |
| Casein | 15 | 15 | 15 |
| Sucrose | 10 | 10 | 10 |
| Lard | 5.8 | 5.8 | 5.8 |
| Corn oil | 1.2 | 1.2 | 1.2 |
| Gluten | 5 | 5 | 5 |
| Cellulose | 5 | 5 | 5 |
| AIN-93G Mineral mix | 3.5 | 3.5 | 3.5 |
| AIN-93G Vitamin mix | 1 | 1 | 1 |
| L-Cystine | 0.3 | 0.3 | 0.3 |
| GlcN | — | 0.2 | — |
| GlcNAc | — | — | 0.2 |
| Total | 100.0 | 100.0 | 100.0 |
The study was approved by the Josai University Animal Use Committee, and the mice were maintained in accordance with the university guidelines for the care and use of laboratory animals.
Analysis of Serum SamplesThe concentrations of serum Ca, P, and Mg were measured using Ca, Phosphor C, and Mg kits (Wako Pure Chemical Industries, Ltd., Osaka, Japan), respectively. Tartrate-resistant acid phosphatase (TRAP) and alkaline phosphatase (ALP) activity in the serum were measured using a TRACP & ALP Assay kit (Wako Pure Chemical Industries, Ltd.).
Measurement of Femoral BMDThe right femurs were dissected and preserved in 70% ethanol at 4°C. The cancellous and cortical BMDs, minimum moment of inertia of cross-sectional areas (MMICSA), and polar moment of inertia of cross-sectional areas (PMICSA) were measured radiographically using peripheral quantitative computed tomography (LCT-100; LaTheta, ALOKA, Tokyo, Japan). Computed tomography (CT) scanning was performed by dividing the femur preparations into 80 equal sections at 0.05-mm intervals from the distal femur.
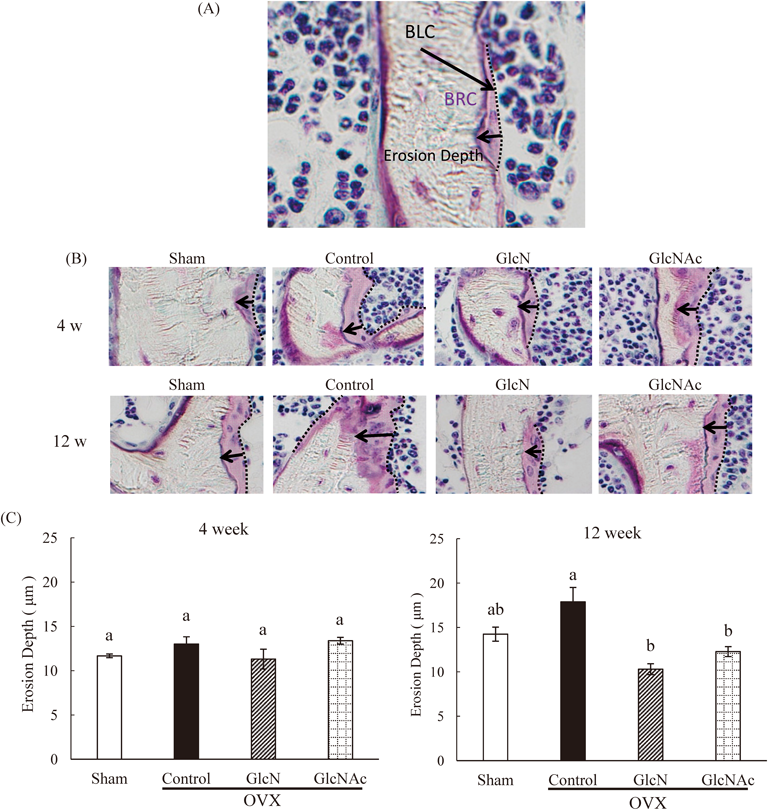
Bone HistomorphometryThe right tibias were fixed in 70% ethanol. After trimming to remove the muscle, the tibias were stained with Villanueva bone stain for 5 d, dehydrated in graded concentrations of ethanol for 1 d, and embedded in methyl methacrylate (Wako Pure Chemical Industries, Ltd.) for 3 d. The tibia was cut into 5-µm-thick sections using a microtome (Leica, Wetzlar, Germany). The sections were observed by microscopy to measure bone structure parameters between the primary and secondary spongiosa, including erosion depth (µm), osteoid surface (OS/BS, %), eroded surface (ES/BS, %), quiescent surface (QS/BS, %), bone volume (BV/TV, %), trabecular number (Tb.N, N/mm), number of osteoblasts (N.Ob/BS, N/mm), mononuclear osteoclasts (N.Mo.Oc/BS, N/mm), and multinuclear osteoclast (N.Mu.Oc/BS, N/mm). Erosion depth was measured as the maximum distance between the absorbent surface which is the edge of bone remodeling compartment (BRC) and the bone marrow surface which is the edge of bone lining cell (BLC).
Primary Culture for Osteoclast DifferentiationBone marrow cells were obtained by flushing the inside of the left femurs of the mice bred for 12 weeks. The cells were suspended in α-modified eagle minimum essential medium (α-MEM; Gibco LT, Grand Island, NY, U.S.A.) supplemented with 10% heat-inactivated fetal bovine serum (Japan Bioserum Co., Ltd., Hiroshima, Japan) and 100 U/mL penicillin (Meiji Seika Pharma Co., Ltd., Tokyo, Japan). The cells were seeded at 2.0×10⁴ cells/well (0.32 cm2) in α-MEM/10% fetal bovine serum/50 U/mL penicillin, and were cultured in the presence of macrophage colony-stimulating factor (M-CSF) (30 ng/mL) and RANKL (50 ng/mL) for 7 d at 37°C under 5% CO2. Induced osteoclasts were fixed in 10% formalin and identified by staining for TRAP activity using an acid phosphatase and leukocyte (TRAP) kit (Sigma-Aldrich, St. Louis, MO, U.S.A.). TRAP-positive multinucleated cells with more than two nuclei were considered to be osteoclasts.
Statistical AnalysisData were expressed as the mean±standerd error (S.E.). The number of measurements is shown in the figures and tables. Rejection test was performed for the aberrant data of each experiment. Statistical analysis was carried out using StatMate 3 software (ATOMS Inc., Tokyo, Japan). The significance of variance was determined using one-way ANOVA followed by Tukey’s multiple comparison test. The probability level used to determine statistical significance was p<0.05.
RESULTS
Body and Uterine WeightWe investigated the effects of dietary GlcN and GlcNAc on the body indices of osteoporosis model OVX mice (Table 2). Food intake in the OVX groups was lower than that in the sham group. Although the final weight and the gain in body weight of GlcN and GlcNAc fed OVX groups were higher than those in the sham group at 4 weeks, no significant difference was observed among all groups at 12 weeks. Four weeks after overiectomy, the uterus weight in the OVX groups was significantly lower than that in the sham group. Although the uterus weight was more reduced in the OVX group compared with the sham group at 12 weeks, the weight among the OVX groups remained the same.
Table 2. Effect of Glucosamines Intake on Body Indexes of OVX Mice
| 4 Week | 12 Week |
|---|
| Sham | OVX | Sham | OVX |
|---|
| Control | GlcN | GlcNAc | Control | GlcN | GlcNAc |
|---|
| Food intake (g/d) | 4.443±0.08a | 4.422±0.10ab | 4.027±0.12c | 4.044±0.12bc | 4.630±0.03a | 4.131±0.05b | 3.796±0.06c | 4.185±0.05b |
| Initial weight (g) | 27.68±0.57a | 27.22±0.49a | 27.41±0.46a | 27.47±0.46a | 27.59±0.32a | 27.44±0.34a | 27.53±0.39a | 27.33±0.27a |
| Final weight (g) | 28.53±0.53b | 30.98±0.82ab | 32.33±1.17a | 32.16±1.14a | 36.30±2.03a | 42.16±2.09a | 40.07±1.76a | 38.42±1.33a |
| Gain weight (g) | 0.850±0.95b | 3.756±1.04ab | 4.920±1.00a | 4.690±1.32a | 8.706±2.15a | 14.72±2.00a | 12.54±1.71a | 11.09±1.35a |
| Uterus weight (mg) | 153.9±7.14a | 29.08±2.01b | 28.77±3.06b | 29.58±1.17b | 310.9±35.6a | 30.28±1.96b | 28.47±1.39b | 31.01±2.30b |
Data are the mean±S.E. (n=8–11). Values with different superscript letters are significantly different. The probability level used to determine statistical significance was p<0.05.
Serum inorganic phosphorus, ALP, and TRAP levels were similar among all groups (Table 3). However, the serum calcium level in the two glucosamines feeding OVX groups at 12 weeks was significantly higher than that in the sham and control OVX groups.
Table 3. Effect of Glucosamines on Bone Related Serum Parameters of OVX Mice
| 4 Week | 12 Week |
|---|
| Sham | OVX | Sham | OVX |
|---|
| Control | GlcN | GlcNAc | Control | GlcN | GlcNAc |
|---|
| Ca (mg/dL) | 5.96±0.054a | 6.11±0.049a | 6.07±0.077a | 3.95±0.052a | 3.97±0.12c | 6.01±0.13bc | 6.30±0.039ab | 6.48±0.086a |
| Mg (mg/dL) | 0.93±0.047a | 1.06±0.052a | 1.06±0.094a | 1.12±0.082a | 0.92±0.023a | 1.03±0.049a | 0.95±0.032a | 0.94±0.038a |
| P (mg/dL) | 2.14±0.081a | 2.02±0.071a | 2.10±0.094a | 2.23±0.17a | 2.13±0.16a | 2.14±0.25a | 2.17±0.21a | 2.14±0.15a |
| ALP (units/µL) | 1.95±0.10a | 1.94±0.13a | 1.60±0.093a | 1.84±0.096a | 1.59±0.11a | 1.77±0.13a | 1.78±0.18a | 1.74±0.13a |
| TRAP (Absorbance) | 0.40±0.038a | 0.45±0.074a | 0.42±0.044a | 0.46±0.067a | 0.53±0.073a | 0.51±0.059a | 0.49±0.059a | 0.51±0.064a |
Data are the mean±S.E. (n=8–11). Values with different superscript letters are significantly different. The probability level used to determine statistical significance was p<0.05.
To evaluate the bone quantity and quality, we measured the cancellous and cortical BMDs of femoral bone using peripheral quantitative computed tomography, an X-ray CT (Table 4). Both cancellous and cortical BMDs of the three OVX groups were significantly lower than those of the sham group at 4 and 12 weeks. Although there were no differences in BMDs among the OVX groups at 4 weeks, the cancellous BMD at 12 weeks in the GlcN and GlcNAc OVX groups was significantly higher than in the control OVX group.
Table 4. Effect of Glucosamines on Femoral Bone Quantity and Quality of OVX Mice
| 4 Week | 12 Week |
|---|
| Sham | OVX | Sham | OVX |
|---|
| Control | GlcN | GlcNAc | Control | GlcN | GlcNAc |
|---|
| Cancellous BMD (mg/cm3) | 480±8.0a | 349±7.7b | 351±9.2b | 364±10b | 529±11a | 363±9.1c | 410±8.8b | 409±8.2b |
| Cortical BMD (mg/cm3) | 682±15a | 542±10b | 546±14b | 551±14b | 699±11a | 592±8.0b | 58 9±12b | 594±10b |
| Minimum moment of inertia of cross-sectional areas (g·cm) | 0.18±0.009a | 0.16±0.009b | 0.15±0.007bc | 0.15±0.007c | 0.19±0.007a | 0.16±0.005c | 0.17±0.006b | 0.17±0.007b |
| Polar moment of inertia of cross-sectional areas (g·cm) | 0.41±0.02a | 0.35±0.02b | 0.35±0.01b | 0.35±0.01c | 0.45±0.02a | 0.36±0.008c | 0.38±0.01b | 0.38±0.01b |
Data are the mean±S.E. (n=8–11). Values with different superscript letters are significantly different. The probability level used to determine statistical significance was p<0.05.
Bone quality was estimated based on analyses of the peripheral quantitative computed tomography data using Latheta software. MMICSA is an index of bone strength against bending, while PMICSA is an index of bone strength to twist. Both MMICSA and PMICSA in the three OVX groups were significantly lower than those in the sham group at 4 and 12 weeks. MMICSA and PMICSA at 12 weeks in the GlcN and GlcNAc OVX groups were significantly higher than those in the control OVX group.
Bone Histomorphometric ParametersFigure 1 shows the histomorphometric parameters of trabecular bone analyzed using a semi-automatic measuring system. The BV/TV in all OVX groups was lower than that in the sham group. However, the BV/TV in the GlcN and GlcNAc OVX groups was generally higher than that in the control OVX group at 4 and 12 weeks, and significantly higher in the GlcNAc OVX group at 12 weeks (Fig. 1A). The results of Tb.N were similar to those of BV/TV (Fig. 1B). Although there were no significant differences in N.Ob/BS among all groups at 4 weeks, that in the GlcN and GlcNAc OVX groups were generally lower than that in the control OVX group at 12 weeks (Fig. 1C). N.Mo.Oc/BS in the control OVX group at 4 weeks was higher than that in the other groups (Fig. 1D). N.Mu.Oc/BS in the OVX groups were slightly higher than that in the sham group at 4 weeks. However, that in the control OVX group at 12 weeks maintained a higher value, which was suppressed in the GlcN and GlcNAc OVX groups at 12 weeks (Fig. 1E).
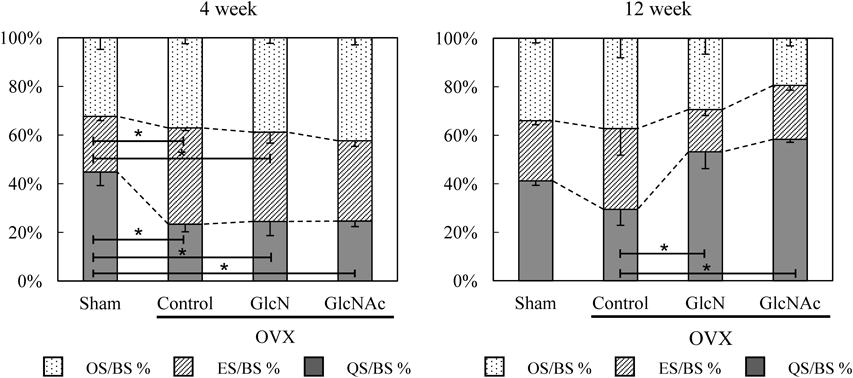
The OS/BS, ES/BS, and QS/BS, indicate the balance of bone metabolism (Fig. 2). At 4 weeks, a higher ratio of ES/BS was observed in the OVX groups compared to in the sham group. At 12 weeks, QS/BS in the GlcN and GlcNAc OVX groups was significantly higher than that in the control OVX group.
Erosion depth, one of the bone resorption indices, is the maximum distance between the absorbent surface and bone marrow surface. The erosion depth of the control OVX group was generally higher than that of the sham group at 12 weeks. However, erosion depth of the GlcN and GlcNAc OVX groups was significantly lower than that of the control OVX group at 12 weeks (Fig. 3).
Primary Culture of OsteoclastsWe examined whether continued intake of glucosamines affected responsiveness of precursor of osteoclast in mouse bone marrow. We isolated bone marrow-derived hematopoietic stem cells from the femurs of mice fed with glucosamines to examine the differentiation from the primary culture cells into TRAP-positive cells that were hyperactive osteoclasts. The number of TRAP-positive multinuclear cell induced from the stem cells in the control OVX group was significantly higher than that in the sham group. However, the induced TRAP-positive cell number in the GlcN and GlcNAc OVX groups was significantly lower than that in the control OVX groups (Fig. 4).
DISCUSSION
In this study, we investigated whether supplementation with glucosamines prevented bone loss in postmenopausal osteoporosis model mice. Our in vivo experiment revealed that long-term GlcN and GlcNAc intake (12 weeks) partly recovered bone quantity (cancellous BMD) and bone quality (MMICSA and PMICSA), which should have degraded after OVX operation. Although the mice were fed with approximately 10-fold higher amounts of these glucosamines (0.2 g/kg/d) compared to the daily allowance for humans (0.021 g/kg/d),20,21) no adverse effects on growth were observed following glucosamines intake. Soybean isoflavones such as daidzein may also recover postmenopausal bone loss.22) Isoflavones act as mimics of estrogen and can maintain bone structure, resulting in the recovery of uterine weight loss after menopause.23) However, this recovery was not observed in OVX mice after GlcN and GlcNAc intake. This suggests that the glucosamines we used do not function as estrogens. Additionally, the loss of cortical BMD was not recovered by glucosamines. The cortical tissue may not be affected by short-period supplementation (4 weeks).
Erosion depth may be an index of bone resorption activity on the absorption surface, and OVX treatment enhances the depth.24–26) Our results showed that GlcN and GlcNAc did not alter erosion depth. Thus, glucosamines suppress the increase in resorption activity caused by OVX. Moreover, the ratio of OS/BS and ES/BS to QS/BS of the tibias in the GlcN- and GlcNAc-fed OVX mice initially increased but then decreased, in contrast to in control OVX mice. Loss of estrogen after menopause activates the osteoclast function, resulting in enhanced bone metabolism.27) These results suggest that continuous intake of glucosamines maintained the bone structure by suppressing the enhancement of bone metabolism caused by menopause. However, the action of glucosamines may differ from that of estrogen-like substances because the loss of uterus weight was not recovered by glucosamines.
Histomorphometric analysis of bone sections was used to determine whether glucosamines intake increased bone quantity and quality. It has been reported that the number of osteoblasts and osteoclasts increased after OVX.28) Our OVX results showed increases in osteoblasts (N.Ob/BS) and osteoclasts (N.Mo.Oc/BS and N.Mu.Oc/BS). However, GlcN and GlcNAc feeding to OVX mice generally decreased these values. These results suggest that glucosamines intake suppresses the increase in the activity of both osteoblasts and osteoclasts, which are involved in bone metabolism.
The maturation steps of osteoclasts begin from hematopoietic stem cells in the bone marrow.29) The stem cells are transformed into mononuclear osteoclasts and then into multinuclear osteoclasts, which are hyperactive osteoclasts.29) We attempted to cultivate stem cells isolated from the mice used in this study. Interestingly, the cells from OVX mice matured into hyperactive osteoclasts, whereas those from GlcN- and GlcNAc-fed OVX mice did not, despite cultivation under the same conditions. This result indicates that glucosamines fed into the body do not directly affect stem cells, but rather indirectly alter the response of the cells during differentiation into osteoclasts.
Jung et al. reported that the intake of chitooligosaccharides enhanced the bioavailability of dietary Ca and recovered bone loss after OVX treatment in mice.30) The significantly higher level of serum Ca in the GlcN- and GlcNAc-fed mice in this study may be because of the enhanced bioavailability of dietary Ca by glucosamines.
In conclusion, GlcN and GlcNAc intake prevented postmenopausal osteoporosis by suppressing the enhancement of bone metabolism. These glucosamines may indirectly inhibit the differentiation and activation of osteoclasts. Further studies are necessary to investigate the mechanism of glucosamines supplements on attenuated bone loss in OVX mice.
Acknowledgments
We thank Akemi Ito of Ito Bone Histomorphometry Institute Co., Ltd. (Niigata, Japan) for providing useful advice regarding bone histomorphometric analysis. This study was supported by a Grant from the Program for Promotion of Basic and Applied Research for Innovations in Bio-oriented Industry in Japan.
Conflict of Interest
The authors declare no conflict of interest.
REFERENCES
- 1) Harada S, Rodan GA. Control of osteoblast function and regulation of bone mass. Nature, 423, 349–355 (2003).
- 2) Westerlind KC, Wronski TJ, Ritman EL, Luo ZP, An KN, Bell NH, Turner RT. Estrogen regulates the rate of bone turnover but bone balance in ovariectomized rat is modulated by prevailing mechanical strain. Proc. Natl. Acad. Sci. U.S.A., 94, 4199–4204 (1997).
- 3) Macari S, Duffles LF, Queiroz-Junior CM, Madeira MF, Dias GJ, Teixeira MM, Szawka RE, Silva TA. Oestrogen regulates bone resorption and cytokine production in the maxillae of female mice. Arch. Oral Biol., 60, 333–341 (2015).
- 4) Lacey JV Jr, Mink PJ, Lubin JH, Sherman ME, Troisi R, Hartge P, Schatzkin A, Schairer C. Menopausal hormone replacement therapy and risk of ovarian cancer. JAMA, 288, 334–341 (2002).
- 5) Zamani A, Jeihanipour A, Edebo L, Niklasson C, Taherzadeh MJ. Determination of glucosamine and N-acetyl glucosamine in fungal cell walls. J. Agric. Food Chem., 56, 8314–8318 (2008).
- 6) Uldry M, Ibberson M, Hosokawa M, Thorens B. GLUT2 is a high affinity glucosamine transporter. FEBS Lett., 524, 199–203 (2002).
- 7) Anderson JW, Nicolosi RJ, Borzelleca JF. Glucosamine effects in humans: a review of effects on glucose metabolism, side effects, safety considerations and efficacy. Food Chem. Toxicol., 43, 187–201 (2005).
- 8) Igarashi M, Kaga I, Takamori Y, Sakamoto K, Miyazawa K, Nagaoka I. Effects of glucosamine derivatives and uronic acids on the production of glycosaminoglycans by human synovial cells and chondrocytes. Int. J. Mol. Med., 27, 821–827 (2011).
- 9) Setnikar I, Giacchetti C, Zanolo G. Absorption, distribution and exceretion of radioactivity after a single intravenouse or oral administration of [14C] glucosamine to rat. Pharmatherapeutica, 3, 538–550 (1984).
- 10) Setnikar I, Giacchetti C, Zanolo G. Pharmacokinetics of glucosamine in the dog and in man. Arzenimittelforschung, 36, 729–735 (1986).
- 11) Setnikar I, Palumbo R, Canali S, Zanolo G. Pharmacokinetics of glucosamine in man. Arzenimittelforschung, 43, 1109–1113 (1993).
- 12) Hua J, Sakamoto K, Kikukawa T, Abe C, Kurosawa H, Nagaoka I. Evaluation of the suppressive actions of glucosamine on the interleukin-1beta-mediated activation of synoviocytes. Inflamm. Res., 56, 432–438 (2007).
- 13) Hua J, Sakamoto K, Nagaoka I. Nagaoka, I, Inhibitory actions of glucosamine, a therapeutic agent for osteoarthritis, on the functions of neutrophils. J. Leukoc. Biol., 71, 632–640 (2002).
- 14) Nakatani S, Mano H, Im R, Shimizu J, Wada M. Glucosamine regulates differentiation of a chondrogenic cell line, ATDC5. Biol. Pharm. Bull., 30, 433–438 (2007).
- 15) Imagawa K, de Andres MC, Hashimoto K, Pitt D, Itoi E, Goldring MB, Roach HI, Oreffo RO. The epigenetic effect of glucosamine and a nuclear factor-kappa B (NF-κB) inhibitor on primary human chondrocytes—implications for osteoarthritis. Biochem. Biophys. Res. Commun., 405, 362–367 (2011).
- 16) Hua J, Suguro S, Iwabuchi K, Tsutsumi-Ishii Y, Sakamoto K, Nagaoka I. Glucosamine, a naturally occurring amino monosaccharide, suppresses the ADP-mediated platelet activation in humans. Inflamm. Res., 53, 680–688 (2004).
- 17) Igarashi M, Sakamoto K, Nagaoka I. Effects of glucosamine, a therapeutic agent for osteoarthritis, on osteoblastic cell differentiation. Int. J. Mol. Med., 28, 373–379 (2011).
- 18) Wang SX, Laverty S, Dumitriu M, Plaas A, Grynpas MD. The effects of glucosamine hydrochloride on subchondral bone changes in an animal model of osteoarthritis. Arthritis Rheum., 56, 1537–1548 (2007).
- 19) Ivanovska N, Dimitrova P. Bone resorption and remodeling in murine collagenase-induced osteoarthritis after administration of glucosamine. Arthritis Res. Ther., 13, R44 (2011).
- 20) Clegg DO, Reda DJ, Harris CL, Klein MA, O’Dell JR, Hooper MM, Bradley JD, Bingham CO 3rd, Weisman MH, Jackson CG, Lane NE, Cush JJ, Moreland LW, Schumacher HR Jr, Oddis CV, Wolfe F, Molitor JA, Yocum DE, Schnitzer TJ, Furst DE, Sawitzke AD, Shi H, Brandt KD, Moskowitz RW, Williams HJ. Glucosamine, chondroitin sulfate, and the two in combination for painful knee osteoarthritis. N. Engl. J. Med., 354, 795–808 (2006).
- 21) Reginster JY, Deroisy R, Rovati LC, Lee RL, Lejeune E, Bruyere O, Giacovelli G, Henrotin Y, Dacre JE, Gossett C. Long-term effects of glucosamine sulphate on osteoarthritis progression: a randomised, placebo-controlled clinical trial. Lancet, 357, 251–256 (2001).
- 22) Fujioka M, Uehara M, Wu J, Adlercreutz H, Suzuki K, Kanazawa K, Takeda K, Yamada K, Ishimi Y. Equol, a metabolite of daidzein, inhibits bone loss in ovariectomized mice. J. Nutr., 134, 2623–2627 (2004).
- 23) Liang HD, Yu F, Lv P, Zhao ZN, Tong ZH. Role of sost in wnt signal pathway in osteoporosis rats and regulating effect of soybean isoflavones on wnt signal pathway. Mol. Biol. Rep., 41, 4447–4454 (2014).
- 24) Mellibovsky L, Marinoso ML, Cervantes F, Besses C, Nacher M, Nogues X, Florensa L, Munne A, Diez-Perez A, Serrano S. Relationship among densitometry, bone histomorphometry, and histologic stage in idiopathic myelofibrosis. Bone, 34, 330–335 (2004).
- 25) Allen MR, Erickson AM, Wang X, Burr DB, Martin RB, Hazelwood SJ. Morphological Assessment of Basic Multicellular unit resorption parameters in dogs shows additional mechanisms of bisphosphonate effects on bone. Calcif. Tissue Int., 86, 67–71 (2010).
- 26) Jobke B, Milovanovic P, Amling M, Busse B. Bisphosphonate-osteoclasts: changes in osteoclast morphology and function induced by antiresorptive nitrogen-containing bisphosphonate treatment in osteoporosis patients. Bone, 59, 37–43 (2014).
- 27) Imai Y, Youn MY, Kondoh S, Nakamura T, Kouzmenko A, Matsumoto T, Takada I, Takaoka I, Kato S. Estrogens maintain bone mass by regulating expression of genes controlling function and life span in mature osteoclasts. Ann. N. Y. Acad. Sci., 1173 (Suppl. 1), E31–E39 (2009).
- 28) Yu TY, Pang WJ, Yang GS. 3,3′-Diindolylmethane increases bone mass by suppressing osteoclastic bone resorption in mice. J. Pharmacol. Sci., 127, 75–82 (2015).
- 29) Muruganandan S, Sinal CJ. The impact of bone marrow adipocytes on osteoblast and osteoclast differentiation. IUBMB Life, 66, 147–155 (2014).
- 30) Jung WK, Moon SH, Kim SK. Effect of chitooligosaccharides on calcium bioavailability and bone strength in ovariectomized rats. Life Sci., 78, 970–976 (2006).