Abstract
Crush syndrome (CS) is the systemic manifestation of muscle cell damage resulting from pressure and crushing. It is associated with a high mortality rate, even when patients are treated with conventional therapy. We demonstrated the utility of intramuscular administration of dexamethasone (DEX) in disaster medical care by using a model of CS to characterize the pharmacokinetics and biochemical parameters. We compared intravenous (IV) and intramuscular (IM) injection. The IM sites were the right anterior limb (AL), bilateral hind limbs (bHL), and unilateral hind limb (uHL). DEX (5.0 mg/kg) was administered in sham-operated (sham, S-IV, S-AL, S-bHL, S-uHL groups) and CS rats (control, C-IV, C-AL, C-bHL, C-uHL groups). The survival rate in the IM groups was lower than that in the C-IV group. Survival was highest in the C-AL group, followed by the C-uHL and C-bHL groups. The blood DEX concentration of the C-AL group was similar to that in the C-IV group. The C-bHL and C-uHL groups had decreased blood DEX concentrations. Moreover, inhibition of inflammation was related to these changes. Administration of DEX to non-injured muscle, as well as IV administration, increased the survival rate by modulating shock and inflammatory mediators, consequently suppressing myeloperoxidase activity and subsequent systemic inflammation, resulting in a complete recovery of rats from lethal CS. These results demonstrate that injection DEX into the non-injured muscle is a potentially effective early therapeutic intervention for CS that could easily be used in transport to the hospital.
Crush syndrome (CS) is often reported as a traumatic disorder with high mortality and occurs after sudden catastrophes, such as the Hanshin-Awaji, Marmara, and Wenchan earthquakes.1–3) CS is defined as the systemic manifestation of muscle cell damage resulting from pressure and crushing.4) The typical clinical and pathological features of CS result predominantly from traumatic rhabdomyolysis and subsequent release of muscle cell contents upon rescue.5–7) Systemic manifestations may include bleeding, hypovolemic shock, cardiac failure, arrhythmia, electrolyte disturbance, psychological trauma, acute kidney injury (AKI), sepsis, systemic inflammatory response syndrome (SIRS), acute respiratory distress syndrome (ARDS), multiple organ dysfunction syndrome (MODS), and disseminated intravascular coagulation (DIC).8) After major earthquakes, up to 20% of deaths occur shortly after extrication.9) Some of these deaths include victims who were relatively stable before extrication, but deteriorated suddenly thereafter, and this phenomenon is called rescue death. Consequently, for affected victims and patients, it is necessary to identify who should receive an intensive care strategy. Most victims survive upon volume replacement or massive fluid resuscitation at the disaster site. However, this treatment improves symptoms of the acute phase (e.g., hyperkalemia, hypovolemic shock, AKI) rather than those of the chronic phase (e.g., SIRS, ARDS, MODS).10,11) The most important mechanism causing CS-related mortality is ischemia/reperfusion (I/R)-induced rhabdomyolysis and the subsequent onset of reactive oxygen species (ROS)-mediated systemic inflammation.12)
In our previous study, 5.0 mg/kg dexamethasone (DEX) dramatically improved the survival of CS rats, suggesting that DEX treatment could protect against I/R injury followed by inflammation (nitric oxide protection mechanism) and reverse or prevent hyperkalemia and hypovolemic shock (i.e., rescue death).13) Moreover, the pharmacokinetic (PK) parameters of CS rats administered DEX were significantly different from those of normal rats.14)
The medical staff at disaster sites often require simple and easily applied therapeutic methods. Intramuscular (IM) injection is an easier and faster route of administration than intravenous (IV) injection. However, administration to crush injuries and/or muscle tissues is expected to alter the PK characteristics. The purpose of this study was to characterize the utility and PK and biochemical parameters of DEX administered intramuscularly for CS in rats as a model of disaster medical care.
MATERIALS AND METHODS
Animal ModelMale Wistar rats weighing 250–300 g were obtained from Japan SLC Inc. (specific pathogen-free grade, Shizuoka, Japan). The rats were housed in a room maintained at a temperature of 23±3°C and a relative humidity of 55±15% with a 12 h light–dark cycle. The rats had free access to food and water. All animal experiments were conducted according to the guidelines for animal use approved by the Life Science Research Center of Josai University (approval numbers: H25013, H26026). All possible precautions were taken to minimize animal discomfort and suffering. Anesthesia was induced by an intraperitoneal injection of pentobarbital sodium (50 mg/kg body weight). Body temperature was maintained by a heating pad during the experiment.
The CS model was implemented as previously reported.15) In brief, a rubber tourniquet 2.4 cm in width and 1 mm in thickness was wrapped five times around a metal cylinder (22 mm outer diameter, 20 mm internal diameter, 70 mm in length) under a 2 kg load, and the end of the band was glued. The rat was held, ventral surface up, and its foot was inserted into the metal cylinder. Hindlimb compression was induced by pushing the tourniquet high onto the rat’s thigh. After a given period, compression was released by cutting and removing the tourniquet.
Experimental DesignAnimals were randomly assigned to eight groups. Five CS groups (abbreviated as C) were subjected to hindlimb compression for 5 h. This was followed by infusion with 100 µL of normal saline (control) or 5.0 mg/kg DEX infusion intravenously into the tail (C-IV) or intramuscular injection at different limb sites. The intramuscular injections were performed unilaterally at the right anterior triceps muscle without injury (C-AL), bilaterally at the right and left hindlimb gastrocnemius muscles with 2.5 mg/kg DEX (C-bHL), and unilaterally at the right hindlimb gastrocnemius muscle (C-uHL) immediately before reperfusion. Sham (S) groups were underwent the same procedure as the CS groups with the exception that rubber tourniquets were used for compression and decompression. These were the sham, S-IV, S-AL, S-uHL, and S-bHL groups. All rats were placed under anesthesia (intraperitoneal injection of pentobarbital sodium, 10–50 mg/kg body weight) over the 5 h compression period and then allowed to recover and kept under standard conditions with free access to food and water until they were sacrificed for sampling of blood and tissues at the designated times.
Experiment 1The most effective DEX administration route was identified by using the Kaplan–Meier method to determine survival rates. In this experiment, animals were randomly assigned to six groups of rats (sham (n=10), control (n=16), C-IV (n=10), C-AL (n=11), C-uHL (n=16), C-bHL (n=26) groups) that were treated with DEX injected IV or IM as previously described. Rats were observed for 48 h after reperfusion to determine survival rates.
Experiment 2We analyzed the blood concentration profile and pharmacokinetic (PK) parameters of DEX administered by several routes to sham or CS rats. Animals were randomly assigned to eight groups (sham, control, S-IV, S-AL, S-bHL, C-IV, C-AL, C-bHL groups).
Blood, Urine, and Tissue SamplingSampling for Pharmacokinetic Parameters of Blood and UrineThe right side jugular vein was cannulated with a polyethylene catheter by using PE-50 tubing. Blood samples from each group were obtained at the following times before and after reperfusion: 0 (immediately before), 0.083, 0.17, 0.25, 0.5, 1, 3, 6, 9, 12, 15, 18, 21, and 24 h (n=4–6). Venous blood was centrifuged at 2900×g for 10 min at 4°C to measure the plasma concentration of DEX.
The urinary bladder was cannulated in parallel to the jugular vein, also with PE-50 tubing. Urine samples from each group were obtained at 1 h prior to decompression to immediately after decompression (0 h). Urine samples were then collected every hour up to 24 h. Urine samples were centrifuged at 1500×g for 5 min at room temperature.
Sampling for Pharmacokinetic of Tissue and Biochemical ParametersBlood samples from both sides of the triceps and blood samples from each group were obtained at 0.5, 1, 3, 6, 12, and 24 h after reperfusion (n=4–6). These samples were subjected to determination of blood and/or tissue DEX concentration by HPLC; biochemical analyses for creatine phosphokinase (CPK), potassium ion (K+), blood urea nitrogen (BUN), and creatinine (Cre) levels; and measurement of thiobarbituric acid reactive substances (TBARS), myeloperoxidase (MPO) activity, and interleukin (IL)-6 level.
Sample Preparation and HPLC MethodsThe DEX concentration was measured by HPLC using previously described methods.14) Briefly, 50 µL of plasma and urine samples was extracted with 30 µL of methanol containing 0.02 µg/mL propyl p-pydroxybenzoate (internal standard: I.S.) (Wako Pure Chemical Industries, Ltd., Osaka, Japan) and 20 µL of methanol. These samples were vortexed and centrifuged at 12000×g for 20 min at 4°C. Tissue samples were accurately weighed and cut into slices, and the appropriate amount of methanol (4 mL per 1 g of tissue) was added. Samples were homogenized with a POLYTRON PT-MR 2100 at 26000 rpm for 1 min in an ice bath. The tissue homogenate was centrifuged at 12000×g for 20 min at 4°C. The supernatant (400 µL) was mixed with 800 µL of water and 30 µL of I.S. This mixture was loaded to an active Strata X solid phase extraction column (Shimadzu GLC Ltd., Kyoto, Japan). The column was washed with water, 10% methanol, and 20% acetone, and eluted with 1 mL of methanol. The eluate was dried under a stream of nitrogen at 37°C. The residue was dissolved in 100 µL of mobile phase (phosphate buffer (pH 5.4)–acetonitrile–methanol=1.73 : 1.16 : 1). The mobile phase was pumped at a flow rate of 1.2 mL/min through an Inertsil ODS-3 column (4.6 mm ×250 mm, φ5 µm). The chromatographic conditions were an injection volume of 10 µL, column temperature of 40°C, and detection wavelength of 254 nm. Data were analyzed using a Smart Chrome system (KYA TECH Corporation, Tokyo, Japan). The calibration curves were linear from 0.01 µg/mL to at least 100 µg/mL (R2>0.999). The minimum limit for the quantifiable concentration was 18–20 ng/mL (n=10).
Experiment 3Animals were randomly assigned to six groups (sham, control, C-IV, C-AL, C-bHL). The mean arterial pressure (MAP) and arterial blood gas concentrations were recorded and analyzed at 1, 3, 6, and 24 h. The femoral artery was cannulated with a polyethylene catheter using PE-50 tubing connected to a pressure transducer. Blood pressure was expressed as MAP by averaging over 15 cardiac cycles per rat. Arterial blood gas concentrations were obtained from the femoral artery for analysis of pH, PO2, PCO2, HCO3−, and base excess (BE) using a blood gas analyzer (i-STAT300F, FUSO Pharmaceutical Ind., Ltd., Osaka, Japan).
Biochemical Analyses, TBARS, and MPO ActivityThe plasma levels of CPK, K+, BUN, and Cre were determined by SRL Inc. (Tokyo, Japan). ROS production in the injured gastrocnemius muscle was determined by measuring TBARS according to the method previously reported by Bradley et al.16) The amount of malondialdehyde formed was measured spectrophotometrically at 535 and 520 nm (UV mini 1240, Shimadzu Co., Kyoto, Japan). MPO activity in the muscle tissues was measured according to the technique described by Uchiyama and Mihara.17) The results are expressed as MPO units (U)/g wet tissue. One unit of MPO activity was defined as the amount of MPO that degraded 1 µmol of hydrogen peroxide per min at 25°C.
Plasma Levels of IL-6The plasma levels of IL-6 were measured by ELISA (Rat IL-6 ELISA kit; Endogen, Inc.) according to the manufacturer’s instructions.
Statistical AnalysisThe results are expressed as the mean±standard error of the mean (S.E.M.). ANOVA was used for each of the variables to assess the differences among groups. Tukey’s honestly significant difference test or the Tukey–Kramer test was used to compare the results between the groups, with the level of significance set at p<0.05. Survival curves were calculated by the Kaplan–Meier method and survival was compared by a log-rank test.
RESULTS
Experiment 1Efficacy of Intramuscular Administration as Determined by Survival RateThe survival curve is shown in Fig. 1. The survival rate over the 48-h period after CS in the control group decreased to 81.3, 56.3, 31.3, and 23.4%, at 3, 6, 24, and 48 h, respectively. This significantly differed from the survival rate in the sham group, in which no animal died. Treatment of CS rats with DEX IV (the C-IV group) saved all CS rats and a 100% survival rate was maintained during the 48-h experimental period. The C-AL group showed significantly improved survival until 24 h after administration of DEX; however, the ultimate survival rate was only 72.7% at 48 h after administration of DEX. Survival in the C-bHL and C-uHL groups was significantly decreased when compared to that in the sham, C-IV, and C-AL groups, which showed similar survival rates to the control group.
Experiment 2Blood and Urine Concentration Profile and PK Parameters for IM Administration of DEXThe results for the C-uHL group were not significantly different from those of the sham, control, and C-IV groups. Thus, the following experiments were not conducted on the right side gastrocnemius muscle, i.e., in the C-uHL group.
We determined the plasma and urinary concentration profiles and PK parameters of DEX in sham and CS rats (Fig. 2, Table 1) using a 1-compartment model established using Akaike’s information criteria (data not shown). The plasma and urinary profiles and PK parameters of DEX were not significantly different among the DEX-treated sham rat groups (i.e., the S-IV, -AL, -bHL) (Figs. 2a, c, Table 1). The plasma concentration of DEX in the C-bHL group was significantly lower than that in the C-IV and C-AL groups at 0.083 to 3 h after administration. These profiles were similar to the changes in the C-IV and C-AL groups at 6 to 24 h (Fig. 2b). The mean residence time (MRT), volume of distribution (Vd), and time at maximum concentration (Tmax) for DEX in the C-bHL group were significantly increased relative to the values in the C-IV and C-AL groups, and the maximum concentration (Cmax) level of DEX in the C-bHL group was significantly decreased compared to that in the C-AL group. The cumulative urinary excretion profiles and PK parameters of the C-bHL group were significantly lower than those of the C-IV and C-AL groups (Fig. 2d). The amount of renal clearance (CLr) and ratio of renal clearance to total clearance (CLr/CLtot) in the C groups were significantly decreased compared to those in the S groups. The C-bHL group in particular showed a significant decrease compared with the C-IV and C-AL groups. Plasma and urinary profile and PK parameter changes of the C-AL group were similar to that reported for the C-IV group (Table 1).
Table 1. Plasma and Urine Pharmacokinetics Parameters of DEX in Sham and Crush Syndrome Rats
| AUC0–24 h | MRT | CLtot | Vd | Tmax | Cmax | CLr/CLtot |
|---|
| (µg×h/mL) | (h) | (L/h/kg) | (L/kg) | (h) | (µg/mL) | (%) |
|---|
| S-IV | 22.0±1.8 | 5.6±0.5 | 0.23±0.02 | 1.2±0.1 | none | none | 4.41±0.60 |
| S-AL | 16.0±1.7 | 6.4±0.3 | 0.32±0.04 | 1.6±0.3 | 0.12±0.04 | 6.10±1.58 | 3.86 0.17 |
| S-bHL | 16.1±1.5 | 5.7±0.7 | 0.32±0.03 | 2.4±0.3 | 0.10±0.02 | 3.96±0.84b) | 4.15 0.33 |
| C-IV | 25.2±0.8 | 8.0±0.3a) | 0.20±0.01 | 1.7±0.1 | none | none | 0.73±0.20a) |
| C-AL | 21.6±2.1 | 7.4±0.4 | 0.24±0.03 | 2.2±0.2 | 0.21±0.10 | 5.24±0.43 | 0.92 0.26b) |
| C-bHL | 19.8±2.9 | 10.3±0.4c) | 0.28±0.05 | 6.2±1.7c, d, e) | 4.54±1.91c, e) | 1.33±0.25c, e) | 0.18 0.74c, d, e) |
Values are presented as the mean±S.E.M. (respectively n=4). a) p<0.05 vs. S-IV, b) p<0.05 vs. S-AL, c) p<0.05 vs. S-bHL, d) p<0.05 vs. C-IV and e) p<0.05 vs. C-AL groups were analyzed by a one-way ANOVA followed by the Tukey–Kramer test. AUC: area under the concentration–time curve, MRT: mean residence time, CLtot: total body clearance, Vd: distribution volume, Tmax: time to maximum drug concentration, Cmax: maximum drug concentration, CLr/CLtot: renal; clearance/ total clearance ratio, S: sham rat, C: crush syndrome rat, IV: intravenous, AL: anterior limb, bHL: bilateral hind limb.
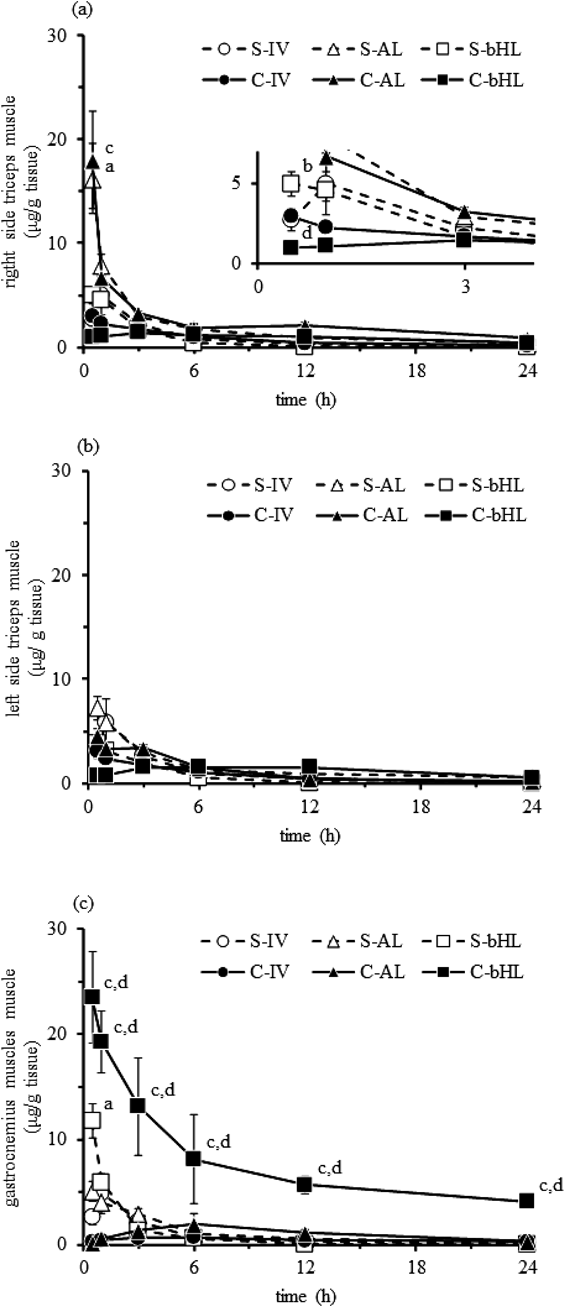
Figure 3 shows the DEX concentration in the right and left triceps and gastrocnemius muscles. The concentration of DEX in the right triceps muscle of the S- and C-AL groups and the gastrocnemius muscle of the S- and C-bHL groups was significantly increased compared to that in the muscles of the other groups. The concentration of DEX in the right triceps muscle of the AL group was significantly increased compared to that in the IV and bHL groups at 0.5 h after reperfusion (Fig. 3a). The concentration of DEX in the left triceps muscle did not significantly change during the experimental period (Fig. 3b). The concentration of DEX in the gastrocnemius muscle in the C-bHL group was significantly increased compared to that in the C-IV and C-AL groups during the experimental period (Fig. 3c). The PK parameters of the muscle tissue were difficult to calculate because of the lack of elimination period points.
Experiment 3Effects of DEX on MAP Levels and Blood Gas Parameters in CS RatsAs shown in Table 2, the MAP, pH, HCO3−, and BE levels for the control group progressively decreased 1 to 24 h after reperfusion. These decreases were significant compared with the sham group. In all CS rats injected intramuscularly with DEX, the MAP levels were significantly decreased relative to the sham group during the experimental period but were increased relative to the control group. The pH, HCO3−, BE, and lactate levels of the C-AL group were significantly improved compared with those of the control group, and the C-AL group in particular had levels similar to the C-IV group.
Table 2. Effects of Crush Syndrome and DEX on Mean Arterial Pressure and Arterial Blood Gas Analysis
| | Time after reperfusion (h) |
|---|
| | 1 | 3 | 6 | 24 |
|---|
| MAP (mmHg) | Sham | 120±2 | 126±5 | 122±3 | 125±2 |
| Control | 70±6a) | 64±3a) | 51±5a) | 53±2a) |
| C-IV | 91±4a) | 93±4a, b) | 88±2a, b) | 106±9b) |
| C-AL | 85±4a) | 84±5a, b) | 83±7a, b) | 95±4b) |
| C-bHL | 78±7a, c) | 68±3a, c) | 62±4a, c) | 75±7a, c) |
| pH | Sham | 7.40±0.01 | 7.41±0.02 | 7.40±0.06 | 7.42±0.01 |
| Control | 7.35±0.03a) | 7.31±0.01a) | 7.25±0.03a) | 7.21±0.02a) |
| C-IV | 7.42±0.02b) | 7.38±0.04 | 7.36±0.04b) | 7.39±0.02b) |
| C-AL | 7.38±0.00 | 7.36±0.01 | 7.33±0.05b) | 7.31±0.01b) |
| C-bHL | 7.35±0.02 | 7.33±0.02 | 7.31±0.01 | 7.33±0.05b) |
| HCO3− (mEq/L) | Sham | 26.0±0.7 | 27.0±0.7 | 26.3±1.1 | 26.2±0.5 |
| Control | 19.2±0.7a) | 18.7±0.4a) | 14.7±1.1a) | 14.0±0.7a) |
| C-IV | 26.1±0.5b) | 26.0±0.7b) | 25.0±0.4b) | 25.1±1.0b) |
| C-AL | 26.5±0.7b) | 24.6±2.4b) | 23.5±1.8b) | 22.5±1.2b) |
| C-bHL | 22.6±1.5b) | 21.5±1.0 | 20.4±0.9 | 19.9±3.0 |
| BE (mmol/L) | Sham | 2.3±0.4 | 1.8±0.2 | 2.2±0.5 | 1.3±0.4 |
| Control | −5.3±0.6a) | −7.7±0.4a) | −11.0±0.7a) | −8.3±0.8a) |
| C-IV | 1.3±0.4b) | 2.0±0.7b) | −0.7±1.1b) | 0.9±0.8b) |
| C-AL | 0.3±1.5b) | −0.8±2.6b) | −2.0±0.7b) | −0.7±0.7b) |
| C-bHL | −0.7±1.8b) | −3.3±1.1b) | −5.0±0.7b) | −2.0±0.7b) |
| Lactate (mmol/L) | Sham | 0.56±0.04 | 0.74±0.10 | 0.69±0.07 | 0.71±0.11 |
| Control | 1.51±0.17a) | 1.75±0.15a) | 2.34±0.15a) | 2.27±0.60a) |
| C-IV | 0.75±0.32b) | 0.82±0.26b) | 0.94±0.22b) | 0.67±0.19b) |
| C-AL | 1.00±0.32 | 1.06±0.08 | 1.56±0.13 | 1.34±0.37 |
| C-bHL | 1.16±0.36 | 1.00±0.12 | 1.76±0.06 | 2.27±0.40c) |
Values are presented as the mean±S.E.M. (n=4). a) p<0.05 vs. sham, b) p<0.05 vs. CS, c) p<0.05 vs. C-IV and d) p<0.05 vs. C-AL groups were analyzed by a one-way ANOVA followed by the Tukey–Kramer test. MAP: mean arterial pressure, HCO3−: bicarbonate ion, BE: base excess, C: crush syndrome rat, IV: intravenous, AL: anterior limb, and bHL: bilateral hind limb.
We determined biochemical marker levels, tissue levels of TBARS and MPO, and plasma IL-6 levels for DEX treatment in sham and CS rats (Tables 3, 4). CPK, K+, BUN, and Cre levels in the control group progressively increased over the experimental period. These changes were significantly increased compared with those in the sham group. The CPK, K+, and BUN levels of the CS rats treated with DEX were significantly increased compared to those in the sham group and significantly decreased compared to those in the control group. The improvement in the C-AL group in particular was similar to that observed for the C-IV group. These changes were similar to those observed for the sham group at 24 h after administration of DEX.
Table 3. Effects of Crush Syndrome and Dexamethasone on Plasma Biochemical Markers
| | Time after reperfusion (h) |
|---|
| | 1 | 3 | 6 | 24 |
|---|
| CPK (×102 IU/L) | Sham | 5±0 | 6±2 | 5±1 | 4±1 |
| Control | 246±22a) | 277±30a) | 295±26a) | 185±9a) |
| C-IV | 86±7a, b) | 149±27a, b) | 129±12a, b) | 66±12a, b) |
| C-AL | 87±6a, b) | 134±11a, b) | 148±12a, b) | 98±10a, b) |
| C-bHL | 177±16a) | 154±19a) | 221±28a) | 157±38a, c) |
| K+ (mEq/L) | Sham | 3.6±0.2 | 3.8±0.1 | 4.3±0.6 | 4.0±0.1 |
| Control | 7.9±0.4a) | 9.2±0.4a) | 9.5±0.2a) | 7.5±0.7a) |
| C-IV | 5.8±0.1b) | 5.8±0.8b) | 5.8±0.1a, b) | 4.9±0.3b) |
| C-AL | 5.1±0.5b) | 5.5±0.3b) | 6.4±0.6a, b) | 5.0±0.1b) |
| C-bHL | 7.9±0.4a) | 7.9±0.7a) | 8.8±0.3a) | 6.0±0.4 |
| BUN (mmol/L) | Sham | 13.0±1.8 | 14.4±1.4 | 13.5±0.3 | 21.9±2.2 |
| Control | 26.3±1.6a) | 43.7±3.3a) | 64.5±2.8a) | 53.2±6.2a) |
| C-IV | 27.6±2.1a) | 39.5±2.9a) | 52.4±5.1a) | 29.4±3.9b) |
| C-AL | 29.9±1.6a) | 37.6±1.7a) | 55.8±5.0a) | 33.5±4.6 |
| C-bHL | 25.3±2.5a) | 37.3±1.8a) | 55.2±1.0a) | 33.2±5.0 |
| Cre (mmol/L) | Sham | 0.15±0.00 | 0.16±0.01 | 0.17±0.03 | 0.20±0.07 |
| Control | 0.42±0.15a) | 1.85±0.23a) | 1.91±0.11a) | 0.86±0.06a) |
| C-IV | 0.17±0.03b) | 0.37±0.10b) | 0.37±0.04b) | 0.24±0.03b) |
| C-AL | 0.23±0.06 | 0.35±0.04b) | 0.45±0.18b) | 0.21±0.06b) |
| C-bHL | 0.32±0.12 | 0.49±0.09b) | 0.42±0.08b) | 0.31±0.13 |
Values are presented as the mean±S.E.M. (n=4). a) p<0.05 vs. sham, b) p<0.05 vs. CS and c) p<0.05 vs. C-IV groups were analyzed by a one-way ANOVA followed by the Tukey–Kramer test. CPK: creatine phosphokinase, K+: potassium ion, BUN: blood urea nitrogen, Cre: creatinine, C: crush syndrome rat, IV: intravenous, AL: anterior limb, and bHL: unilateral hind limb.
Table 4. Effects of Crush Syndrome and Dexamethasone on Plasma Inflammatory Makers
| | Time after reperfusion (h) |
|---|
| | 1 | 3 | 6 | 24 |
|---|
| Muscle TBARS (nmol/g tissue) | Sham | 157±13 | 169±21 | 164±5 | 170±10 |
| Control | 261±8a) | 567±25a) | 293±35a) | 180±1 |
| C-IV | 145±18b) | 145±12b) | 122±29b) | 126±27 |
| C-AL | 159±3b) | 213±4b) | 202±33 | 148±5 |
| C-bHL | 185±23 | 181±23b) | 125±22 | 172±11 |
| Muscle MPO activity (unit/g tissue) | Sham | 0.3±0.1 | 0.2±0.1 | 0.3±0.1 | 0.8±0.5 |
| Control | 0.6±0.0 | 2.3±0.2a) | 5.7±0.2a) | 10.3±0.8a) |
| C-IV | 0.3±0.0 | 0.1±0.0b) | 1.2±0.1b) | 2.3±0.5a, b) |
| C-AL | 0.3±0.0 | 0.1±0.0b) | 1.4±0.1b) | 2.2±0.7a, b) |
| C-bHL | 0.3±0.0 | 1.5±0.2c, d) | 3.8±0.2c, d) | 4.5±0.6a, b, c, d) |
| Lung MPO activity (unit/g tissue) | Sham | 3.0±0.5 | 4.5±0.7 | 4.5±0.6 | 5.3±0.9 |
| Control | 10.0±1.0a) | 16.3±2.0a) | 25.9±2.4a) | 33.9±2.4a) |
| C-IV | 6.3±0.8 | 11.0±1.8a) | 9.5±1.4b) | 8.5±0.3b) |
| C-AL | 7.0±0.5 | 12.1±2.9a) | 11.9±1.8b) | 7.3±0.7b) |
| C-bHL | 8.3±0.8a) | 10.9±2.4a) | 9.8±1.5b) | 16.9±0.9a, b) |
| Plasma IL-6 (pg/mL) | Sham | 67±15 | 54±19 | 38±2 | 35±7 |
| Control | 748±101a) | 1746±162a) | 4562±239a) | 4227±34a) |
| C-IV | 157±10b) | 178±2b) | 506±17a, b) | 474±29a, b) |
| C-AL | 253±27b) | 242±26b) | 970±149a, b) | 1020±210a, b) |
| C-bHL | 220±3b) | 286±17b) | 1260±20a, b, c) | 2209±496a, b, c) |
Values are presented as the mean±S.E.M. (n=4). a) p<0.05 vs. sham, b) p<0.05 vs. CS, c) p<0.05 vs. C-IV and d) p<0.05 vs. C-AL groups were analyzed by a one-way ANOVA followed by the Tukey–Kramer test. TBARS: thiobarbituric acid reactive substances, MPO: myeloperoxidase, IL: interleukin, C: crush syndrome rat, IV: intravenous, AL: anterior limb, and bHL: unilateral hind limb.
The muscle TBARS level of the control group was significantly increased compared to that in the sham group at 1, 3, and 6 h of the experimental period. Muscle and lung MPO activity and IL-6 levels in the control group progressively increased over the experimental period. In contrast, muscle TBARS levels of CS rats treated with DEX were decreased compared with those in the control group. Muscle and lung MPO activities and plasma IL-6 levels in the C-AL group was significantly decreased compared with those in the control group. These changes were similar to those observed in the C-IV group. The values in the C-bHL group were lower than those in the control group, but the changes observed were not significantly different from those in the sham, C-IV and C-AL groups at 24 h during the experimental period.
DISCUSSION
CS is well known as rescue death. Therapy requires rapid and correct treatment at the disaster site and emergency first aid. It has been reported that CS patients have lower extremity injuries more often than upper extremity injuries.18) Moreover, CS symptoms advance with ischemia reperfusion of the crushed muscle. We hypothesized that these symptoms could be prevented by IM injection of DEX.
The survival rate with administration of DEX to the non-injured muscle (AL group) was higher than that with administration to the injured muscle (bHL group) (Fig. 1). The PK parameters and urinary profiles for DEX injected into the non-injured muscle were similar to those of IV-injected DEX. This demonstrated result of IV administration is related to inhibition of CYP3A4 activity and impaired drug–protein binding, similar to that occurring in CS rats.14) However, administration to the injured muscle produced a significantly different result from IV administration and administration to the non-injured muscle. Blood concentration profiles showed sustained blood DEX concentrations, and the PK parameters of the uHL group were similar to those of the bHL group (data not shown). Samtani and Jusko reported that the PK parameters for IM DEX are similar to those for IV DEX.19) However, in the present study, the Tmax and Cmax for injured muscles were significantly increased in the IM group compared to the IV group (Fig. 2, Table 1).
We demonstrated that intramuscular DEX injection to non-injured sites resulted in a better outcome. Interestingly, decreased survival was associated with decreased Tmax and Cmax levels, which suggests that the AL and IV conditions both provided rapid increases in blood DEX concentration that resulted in the highest survival rates. Moreover, decreased bioavailability of DEX appeared to be associated with decreased survival (data not shown). We previously reported that 0.1 mg/kg IV DEX significantly increased survival time.13) A Cmax of approximately 0.5 µg/mL for 0.1 mg/kg DEX was calculated by normalizing to the concentration profile. The Cmax of the bHL group was approximately 3-fold higher than that obtained with 0.1 mg/kg DEX. However, the survival rate in the C-bHL group was not significantly different from that of rats treated with 0.1 mg/kg DEX.
Oda et al. reported that severity and mortality in CS patients is significantly correlated with the number of extremities involved because potassium leaks into the crushed muscle. In the associated model of CS, rats developed fatal abnormal cardiac rhythms because of hyperkalemia during the acute phase.18) DEX was shown to prevent this effect by increasing the resting potential.20) In the present study, the bHL group did not show improvement in MAP and gas parameters (Table 2). In fact, the potassium level in the C-bHL group was significantly increased compared to the group administered 0.1 mg/kg DEX, with a maximum level of 7.6±0.1 mEq/L.13) However, this change was not significantly different (Table 3) between the sham groups and the groups administered DEX to the non-injured muscle (e.g., the C-AL group). Our findings demonstrate that DEX administration to crushed injured muscle had a worse outcome than DEX administration to non-injured muscle.
Changes in inflammatory markers were similar for IV administration and administration to non-injured muscle (i.e., the C-AL group). These results were related to distant organ inflammation (Table 4) and blood and tissue DEX concentration profiles (Figs. 2, 3), and they suggest a reduction of levels of ROS generated by mitochondrial dysfunction and cellular injury and death in skeletal muscle after ischemia reperfusion.21) Injection of DEX into crushed muscle resulted in a higher residual drug concentration compared to the other conditions. Therefore, control of local inflammation, indicated by reduced ROS and muscle MPO activity levels, showed beneficial effects. However, systemic anti-inflammatory effects, indicated by IL-6 and lung MPO activity levels, did not seem to contribute to the overall therapeutic effect (Table 4). The ischemic stage of crush injury involves induction of pro-inflammatory cytokines in response to the low-oxygen status and extrinsic stimulation. Consequently, when DEX was administered in the present study, systemic inflammation was already activated. We speculate that the effectiveness of DEX (i.e., its bioavailability) was attenuated by the presence of residual drug at the injection site. In addition, we demonstrated that the concentration of DEX delivered by IV injection or injection into the non-injured muscle (the triceps in this study) was sufficient for inflammatory suppression, and thus provided more effective results than injection into the injured muscle, with an appropriate balance of local and systemic effects.
In conclusion, we suggest that IM injection of DEX is of high utility and could be easily implemented in transport to hospital. Injection of the non-injured muscle appears to provide the effect most similar to that of IV injection. In the case of injured muscle, the decision of whether or not to inject DEX should be based on assessment of patient status, transportation, and treatment strategy. In the present study, DEX therapy for CS was demonstrated to prevent rescue death and systemic symptoms. We expect that this research will contribute to the development and simplification of new treatment strategies for CS.
Acknowledgments
I am particularly grateful for the assistance given by the laboratory students, Mr. Yuji Abe, Mr. Yuji Sato, Ms. Yuka Yaginuma, and Ms. Kayako Yodo. I would also like to offer special thanks to Ms. Chikako Murata.
Conflict of Interest
The authors declare no conflict of interest.
REFERENCES
- 1) Matsuoka T, Yoshioka T, Tanaka H, Ninomiya N, Oda J, Sugimoto H, Yokota J. Long-term physical outcome of patients who suffered crush syndrome after the 1995 Hanshin–Awaji earthquake: prognostic indicators in retrospect. J. Trauma, 52, 33–39 (2002).
- 2) Sever MS, Erek E, Vanholder R, Akoğlu E, Yavuz M, Ergin H, Tekçe M, Korular D, Tülbek MY, Keven K, van Vlem B, Lameire N, Marmara Earthquake Study Group. The Marmara earthquake: epidemiological analysis of the victims with nephrological problems. Kidney Int., 60, 1114–1123 (2001).
- 3) Shi YK, Wang LL, Lin YD, Pei FX, Kang YM. Challenges for rear hospital care of Wenchuan earthquake casualties: experience from West China Hospital. Chin. J. Traumatol., 13, 131–136 (2010).
- 4) Greaves I, Porter K, Smith JE. Consensus statement on the early management of crush injury and prevention of crush syndrome. J. R. Army Med. Corps, 149, 255–259 (2003).
- 5) Better OS, Stein JH. Early management of shock and prophylaxis of acute renal failure in traumatic rhabdomyolysis. N. Engl. J. Med., 322, 825–829 (1990).
- 6) Slater MS, Mullins RJ. Rhabdomyolysis and myoglobinuric renal failure in trauma and surgical patients: a review. J. Am. Coll. Surg., 186, 693–716 (1998).
- 7) Bywaters EG, Beall D. Crush injuries with impairment of renal function. 1941. J. Am. Soc. Nephrol., 9, 322–332 (1998).
- 8) Sever MS, Vanholder R, Ashkenazi I, Becker G, Better O, Covic A, De Smet M, Eckardt K-U, Eknoyan G, Gibney N, Hoste E, Kazancioglu R, Lameire N, Luyckx V, Portilla D, Tuglular S, Van Biesen W, RDRTF of ISN Work Group on Recommendations for the Management of Crush Victims in Mass Disasters. Recommendation for the management of crush victims in mass disasters. Nephrol. Dial. Transplant., 27 (Suppl. 1), i1–i67 (2012).
- 9) Ashkenazi I, Isakovich B, Kluger Y, Alfici R, Kessel B, Better OS. Prehospital management of earthquake casualties buried under rubble. Prehosp. Disaster Med., 20, 122–133 (2005).
- 10) Gonzalez D. Crush syndrome. Crit. Care Med., 33 (Suppl.), S34–S41 (2005).
- 11) Sever MS, Vanholder R, Lameire N. Management of crush-related injuries after disaster. N. Engl. J. Med., 354, 1052–1063 (2006).
- 12) Murata I, Nozaki R, Ooi K, Ohtake K, Kimura S, Ueda H, Nakano G, Sonoda K, Inoue Y, Uchida H, Kanamoto I, Morimoto Y, Kobayashi J. Nitrite reduces ischemia/reperfusion-induced muscle damage and improves survival rates in rat crush injury model. J Trauma Acute Care Surg., 72, 1548–1554 (2012).
- 13) Murata I, Ooi K, Shoji S, Motohashi Y, Kan M, Ohtake K, Kimura S, Ueda H, Nakano G, Sonoda K, Inoue Y, Uchida H, Kanamoto I, Morimoto Y, Kobayashi J. Acute lethal crush-injured rats can be successfully rescued by a single injection of high-dose dexamethasone througt a pathway involving PI3K-Akt-eNOS signaling. J Trauma Acute Care Surg., 75, 241–249 (2013).
- 14) Murata I, Otsuka A, Hara C, Motohashi R, Kouno S, Inoue Y, Kanamoto I. Pharmacokinetics characteristics of dexamethasone in crush syndrome model rats. Yakugaku Zasshi, 135, 315–322 (2015).
- 15) Murata I, Ooi K, Sasaki H, Kimura S, Ohtake K, Ueda H, Uchida H, Yasui N, Tsutsui Y, Yoshizawa N, Hirotsu I, Morimoto Y, Kobayashi J. Characterization of systemic and histologic injury after crush syndrome and intervals of reperfusion in a small animal model. J. Trauma, 70, 1453–1463 (2011).
- 16) Bradley PP, Priebat DA, Christensen RD, Rothstein G. Measurement of cutaneous inflammation: estimation of neutrophil content with an enzyme marker. J. Invest. Dermatol., 78, 206–209 (1982).
- 17) Uchiyama M, Mihara M. Determination of malonaldehyde precursor in tissues by thiobarbituric acid test. Anal. Biochem., 86, 271–278 (1978).
- 18) Oda J, Tanaka H, Yoshioka T, Iwai A, Yamamura H, Ishikawa K, Matsuoka T, Kuwagata Y, Hiraide A, Shimazu T, Sugimoto H. Analysis of 372 patients with crush syndrome caused by the Hanshin–Awaji earthquake. J. Trauma, 42, 470–476, discussion, 475–476 (1997).
- 19) Samtani MN, Jusko WJ. Comparison of dexamethasone pharmacokinetics in female rats after intravenous and intramuscular administration. Biopharm. Drug Dispos., 26, 85–91 (2005).
- 20) Benditt DG, Kriett JM, Ryberg C, Gornick CC, Stokes KL, Detloff BL. Cellular electrophysiologic effects of dexamethasone sodium phosphate: implications for cardiac stimulation with steroid-eluting electrodes. Int. J. Cardiol., 22, 67–73 (1989).
- 21) Tran TP, Tu H, Pipinos II, Muelleman RL, Albadawi H, Li YL. Tourniquet-induced acute ischemia–reperfusion injury in mouse skeletal muscles: Involvement of superoxide. Eur. J. Pharmacol., 650, 328–334 (2011).