Regular Articles
Assessment of Genetic and Chemical Variability in Curcumae Longae Rhizoma (Curcuma longa) Based on DNA Barcoding Markers and HPLC Fingerprints
2017 年 40 巻 10 号 p. 1638-1645

詳細
2017 年 40 巻 10 号 p. 1638-1645
Curcumae Longae Rhizoma (Curcuma longa L.) is an important traditional Chinese medicine with multiple beneficial effects. To elucidate the genetic and chemical differences among Curcumae Longae Rhizoma samples, three DNA barcoding markers (rbcL, matK, and ITS-LSU D1/D3) and HPLC fingerprinting were employed in this study. The discriminatory power of rbcL and matK was low, as they only detected one sequence type that showed 100% similarity with more than 20 congeneric species in the Barcode of Life Data Systems (BOLD) database. In contrast, ITS-LSU D1/D3 showed sufficient discriminatory power to precisely identify all of the market samples as C. longa L. in a BLAST search as well as differentiate each sample based on 2–10 ITS-LSU D1/D3 haplotypes with intragenomic variability (mean p-distance: 0.7%, range: 0–2.6%; mean number of differences: 9.6 sites, range: 0–38 sites). HPLC fingerprinting of 13 commercial samples showed a similarity that ranged from 0.769 to 0.996, indicating that the sample quality varied. A cluster analysis based on 5 common peak areas from the HPLC chromatogram resulted in two groups. Group I included 9 samples with a relatively high chemical content, and group II contained 4 samples with a low chemical content. A Mantel test revealed a low correlation (r=0.1721, p=0.047) between genetic and chemical differences. Our findings suggest that the integrated approach of ITS-LSU D1/D3 DNA barcoding and HPLC fingerprinting provides a comprehensive, precise, and convenient method to clarify the genetic and chemical differences in Curcumae Longae Rhizoma.
Curcumae Longae Rhizoma, also known as Jiang Huang or turmeric, is an important traditional Chinese medicine and food spice prepared from the dry rhizome of Curcuma longa L. (Zingiberaceae). It has been widely used in traditional Chinese medicine to promote Qi circulation, dissolve blood sludge, induce menstruation, and relieve pain.1) In the food industry, Curcumae Longae Rhizoma is commonly used as a spice and food coloring agent.2) It is widely produced in South China, including the Sichuan, Guangxi, Guangdong, Yunnan, and Zhejiang Provinces. Due to highly similar morphological traits, Curcumae Longae Rhizoma is frequently confused with herbs of the same genus, such as Curcumae Radix (also known as Yujin), which is the dry tuber of C. longa L., C. phaeocaulis VAL., C. wenyujin Y. H. CHEN et C. F. LING, or C. kwangsiensis S. G. LEE et C. F. LING, and Curcumae Rhizoma (also known as Ezhu), which is the dry rhizome of C. phaeocaulis VAL., C. wenyujin Y. H. CHEN et C. F. LING, or C. kwangsiensis S. G. LEE et C. F. LING.1,3) The chemical composition of turmeric rhizomes often vary between varieties, medicinal parts, geological locations, cultivation conditions, and post-harvest processing,4,5) which can affect the quality, stability, and homogeneity of medical materials. Thus, it is necessary to investigate the genetic and chemical differences in Curcumae Longae Rhizoma for quality control.
DNA barcoding is a species identification system that uses short DNA sequences of a standardized gene region. In 2009, rbcL and matK were proposed as plant core barcodes by the Plant Working Group of Consortium for the Barcode of Life (CBOL)6); however, the discriminatory power of these regions was insufficient. Thus, other regions, such as ITS27) and ITS,8) were proposed. Previous studies tested the ability of DNA barcoding to identify Curcuma species.9–12) This research yielded sequence data that are stored in GenBank and can be used as a reference library. To improve the efficiency of rbcL and matK, we used the nuclear ribosome fragment ITS-LSU D1/D3 (Fig. 1) as a DNA barcoding marker because this fragment contains several quickly evolving regions, including internal transcribed spacers (ITS1 and ITS2) and part of the 5′ end of a large subunit (D1, D2, and D3).13,14)
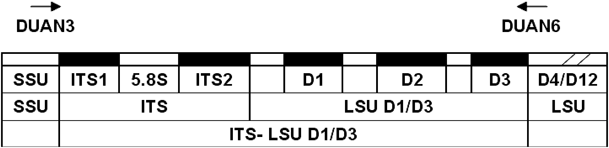
The ITS-LSU D1/D3 is partial of the ribosomal DNA, which generally shows multiple tandem repeats in the chromosome, containing the small subunit (SSU), the internal transcribed spacer 1 (ITS1), the 5.8 S subunit, the internal transcribed spacer 2 (ITS2), and the large subunit (LSU). Arrows indicate the locations and directions of forward primer DUAN3 (positions at the 3′ ends of SSU) and reverse primer DUAN6 (positions at the middle of LSU).
Many analytical methods, including twice development TLC,15) HPLC,16) GC-MS,17,18) capillary electrophoresis (CE),19) and NMR,20) are used to distinguish the rhizomes or radixes of curcuma species based on their chemical composition. With high efficiency and rapid separation, HPLC fingerprinting has been widely used for species identification and quality control for traditional Chinese medicines,21,22) including Curcumae Longae Rhizoma23–25) and ginger.22) The optimization of HPLC conditions enabled the simultaneous detection of the major chemical compounds in Curcumae Longae Rhizoma, including curcuminoids (curcumin (CUR), desmethoxycurcumin (DMC), bisdesmethoxycurcumin (BDMC)) and volatile constituents.25)
To clarify the genetic and chemical differences of Curcumae Longae Rhizoma in the traditional Chinese medicine market, we developed a comprehensive, precise, and simple method that combines DNA barcoding with HPLC fingerprinting. The sequences of three loci (rbcL, matK, and ITS-LSU D1/D3) and HPLC profiles were obtained for each commercial sample, and cluster analyses were performed on these genetic and chemical data.
In this study, 13 commercial samples of Curcumae Longae Rhizoma [the dry rhizome of C. longa L. (Zingiberaceae)] were collected from medicinal markets and drug stores (Table S1). An authentic sample (CL10) of C. longa L. was provided by Mr. Yushi Ye from the South China Botanical Garden of the Chinese Academy of Sciences (Guangzhou, Guangdong Province, China). The corresponding voucher specimens were verified by Prof. Min Ye (Peking University, China) and deposited in the State Key Laboratory of Natural and Biomimetic Drugs, School of Pharmaceutical Sciences at Peking University in Beijing, China.
Generation of DNA Barcoding MarkersGenomic DNA was extracted from 30 mg of dried and powdered rhizomes or leaves using a Plant Genomic DNA Kit (Tiangen Biotech Co., Beijing, China) according to the manufacturer’s instructions. Three DNA barcoding markers (rbcL, matK, and ITS-LSU D1/D3) were amplified by PCR using a set of universal primers for each locus26–28) (Table 1). PCR reactions were performed on a T100™ Thermal Cycler (BioRad, Hercules, CA, U.S.A.) in a 25 µL reaction volume containing 1 µL genomic DNA, 0.5 µL each forward/reverse primer (10 µM), and 23 µL PCR Gold Mix TSE101-1 (Beijing Tsingke Biotech Co., Beijing, China). The PCR products were separated in a 1% agarose gel by electrophoresis and visualized under UV light. The PCR products of rbcL and matK were directly subjected to sequencing using the same PCR primers. The PCR products of ITS-LSU D1/D3 were purified using a DNA Gel Recovery Kit (Tsingke Biotech Co.) and cloned into Escherichia coli DH5α using a pClone007 Blunt Simple Vector Kit (Tsingke Biotech Co.). Ten clones for each sample were sent to Tsingke Biotech Co. for DNA sequencing using sequencing primers M13F (5′-TGT AAA ACG ACG GCC AGT-3′) and M13R (5′-CAG GAA ACA GCT ATG ACC-3′). He obtained sequence files were imported into Sequence Scanner software version 1.0 (Applied Biosystems, Foster, CA, U.S.A.) to assess sequence quality. Traces with a trace score lower than 20 or a contiguous read length lower than 300 bp were considered as low-quality sequences and discarded. High-quality sequence traces were trimmed, assembled, manually edited using the SeqMan program (DNAStar Inc., Madison, WI, U.S.A.), and deposited in GenBank with the following accession numbers: kx832045 for rbcL, kx832044 for matK, and kx831971-kx832025 for ITS-LSU D1/D3 (Table S1). Sequences from fungal contamination or fungal endophytes were excluded.
| Region | Primer name | Sequence (5′→3′) | Reaction conditions | Reference |
|---|---|---|---|---|
| ITS-LSU D1/D3 | Duan3 | GTCGTAACAAGGTTTCCGTA | 95°C 3 min; 95°C 30 s, 55°C 30 s, 72°C 1 min, 35 cycles; 72°C 5 min | Duan et al., 2009 |
| Duan6 | GGCATAGTTCACCATCTTTC | |||
| rbcL | rbcLa-F | ATGTCACCACAAACAGAGACTAAAGC | 95°C 3 min; 95°C 30 s, 55°C 30 s, 72°C 30 s, 35 cycles; 72°C 5 min | Kress et al., 2009 |
| rbcLa-R | GTAAAATCAAGTCCACCRCG | |||
| matK | 390F | CGATCTATTCATTCAATATTTC | 95°C 3 min; 95°C 30 s, 52°C 40 s, 72°C 1 min, 45 cycles; 72°C 5 min | Cuénoud et al., 2002 |
| 1326R | TCTAGCACACGAAAGTCGAAGT |
Sequences were aligned in MEGA 6.029) using the Muscle algorithm. The intragenomic variability of the multiple ITS-LSU D1/D3 sequences within individual and overall samples was analyzed. The number of haplotypes, variable sites, and indel sites were determined using DnaSP 5.10.01 software.30) Using MEGA 6.0 software, the p-distance and number of differences were calculated, and cluster analyses were conducted using a neighbor-joining tree based on pairwise p-distances between individuals. Species identification for rbcL and matK sequences were performed using the Barcode of Life Data Systems (BOLD) (http://v3.boldsystems.org/index.php/databases). To identify species with our ITS-LSU D1/D3 sequences or ITS (extracted from the corresponding ITS-LSU D1/D3 sequences), we established a reference database and performed a local BLAST search. The reference database included 10 ITS-LSU D1/D3 sequences from the reference sample CL10 of C. longa L. The sequences were verified and incorporated with 2946 sequences mined from GenBank (http://www.ncbi.nlm.nih.gov/genbank/) using the key words “internal transcribed spacer” and “zingiberaceae.”
HPLC/UV AnalysisTo prepare sample solution, 0.01 g of powdered Curcumae Longae Rhizoma was extracted with 10 mL of methanol at room temperature with sonication for 30 min. To prepare standard solutions, reference standards of BDMC, DMC and CUR were mixed and dissolved in methanol to make the mixed standard solution (each 0.1 mg/mL) and then diluted continuously to construct the standard curves. All solutions were filtered through a 0.22-µm filter membrane before injection to the HPLC system.
For HPLC/UV analysis, chromatographic separation was completed using an Agilent 1260 HPLC instrument (Agilent, Waldbronn, Germany) equipped with a C18 column (250×4.6 mm, 5 µm). The mobile phase consisted of acetonitrile (A) and water containing 0.1% (v/v) formic acid (B) with the following gradient program: 0 min: 20% A, 80% B; 33 min: 80% A, 20% B; 38 min: 90% A, 10% B; 45 min: 90% A, 10% B; 46 min: 20% A, 80% B; 53 min: 20% A, 80% B. The flow rate was 1.0 mL/min, and the column temperature was 30°C. To monitor multiple chemical compounds simultaneously, the detection wavelengths were set at 250, 254, 280, 320, 370, and 430 nm. Chromatographic data were accessed and processed using the Agilent OpenLAB CDS Chemstation Edition C.01.05 (Agilent, Waldbronn, Germany). A similarity analysis was completed using Chromatographic Fingerprint Similarity Evaluation Software (2012. 130723 version) from the Chinese Pharmacopoeia Commission. A pairwise Euclidean distance matrix was generated from the peak areas of the 5 common peaks in the HPLC chromatograms, and a cluster analysis was performed using the nearest distance method in MATLAB 7.0.
HPLC/MS AnalysisHPLC/MS analysis was performed on an Agilent series 1100 HPLC instrument coupled with an LCQ Advantage ion-trap mass spectrometer (Thermo Fisher, U.S.A.) via an electrospray ionization interface. The HPLC conditions were the same as those for HPLC/UV analysis. The HPLC eluent was introduced into the electrospary ionization source in a post-column splitting ratio of 4 : 1. It was operated in the positive ion mode: source voltage 4.0 kV; sheath gas (N2) 40 arbitrary units; auxiliary gas (N2) 10 units; capillary temperature 320°C; capillary voltage 30 V; and tube lens offset voltage 20 V. Data were analyzed using Xcalibur™ 1.4 software (Thermo Fisher).
Relationship between Genetic Distance and Chemical DistanceTo determine how well the chemical composition corresponded to the genetic background, we compared the p-distance matrix of ITS-LSU D1/D3 sequences with the Euclidean distance matrix of the HPLC data using the vegan Mantel function in R with 999 permutations.31)
The rbcL and matK regions were PCR amplified and sequenced with a 100% success rate, resulting in 14 rbcL and matK sequences each. A previous study2) showed that the primer pair 390F/1326R did not work for matK gene amplification in turmeric. In contrast, we found that this primer pair produced PCR products if additional PCR cycles (45) were completed (Table 1). The sequence alignment showed only one sequence for rbcL (527 bp) and matK (873 bp) in all of the samples. A unique species identification using the rbcL (KX832045) and matK (KX832044) sequences is difficult because the BOLD results showed that the rbcL and matK haplotypes were shared by 21 and 27 species, respectively (Tables S2, S3). The rbcL sequence showed 100% similarity with 85 accessions from 21 species in 5 genera and 4 families. Out of these 85 accessions, approximately 36.5% were from C. longa and 11.8% were from C. amada. The rbcL sequence was mainly detected in Curcuma spp. (95.3%); however, it was also detected in other genera (e.g., Alpinia nigra), classes (e.g., Cryptolepis buchananii and Barleria montana), and phyla (e.g., Cycas rumphii). The matK sequence showed 100% similarity with 45 accessions from 27 species (except sp. JLS 71485 and sp. SS-0909401) in the Curcuma genus. Out of these 45 accessions, 11.1% were from C. zedoaria and 8.9% were from C. longa. These results indicate that the plant core barcodes rbcL and matK have insufficient discriminatory power for identifying Curcumae Longae Rhizoma.
Identifying Commercial Samples Using ITS-LSU D1/D3 SequencesThe ITS-LSU D1/D3 fragment was PCR amplified, cloned, and successfully sequenced for all samples. A total of 73 high-quality ITS-LSU D1/D3 sequences with a sequence length ranging from 1464 to 1492 bp were obtained. The sequences contained a total of 62 haplotypes with 2–10 haplotypes in each specimen (Table 2). We also obtained 56 sequences from fungus contamination and endophytes, which were excluded from further analyses. Sequence difference in ITS-LSU D1/D3 region among samples was shown as Fig. S1. An analysis of intragenomic variability in the samples revealed 85 variable sites (including 50 singletons and 35 parsimonies) and 72 indel sites. The mean p-distance was 0.7% (range: 0–2.6%), and the mean number of differences was 9.6 sites (range: 0–38 sites). A cluster analysis showed that each specimen was located on a unique branch, and CL8 was isolated from the remaining 13 samples, i.e., CL8 was not a close relative (Fig. 2). These results suggest that the ITS-LSU D1/D3 region has sufficient intragenomic variability to distinguish C. longa L. samples of different origins.
| Samples | No. of sequences | Haplotypes | Sequence length (bp) | Variable sites (singletons) | Variable sites (parsimonys) | Total variable sites | Indel sites | % mean p-distance (range) | Mean No. of difference (range) |
|---|---|---|---|---|---|---|---|---|---|
| CL1 | 3 | 3 | 1477–1486 | 12 | 0 | 12 | 27 | 0.6 (0.1–0.8) | 8.0 (1.0–12.0) |
| CL2 | 4 | 4 | 1483–1491 | 6 | 0 | 6 | 14 | 0.2 (0.0–0.5) | 3.0 (0.0–6.0) |
| CL3 | 2 | 2 | 1468–1485 | 10 | 0 | 10 | 25 | 0.6 (0.6–0.6) | 9.0 (9.0–9.0) |
| CL4 | 5 | 4 | 1470–1486 | 2 | 3 | 5 | 22 | 0.2 (0.0–0.3) | 2.6 (0.0–4.0) |
| CL7 | 2 | 2 | 1469–1478 | 6 | 0 | 6 | 25 | 0.4 (0.4–0.4) | 6.0 (6.0–6.0) |
| CL8 | 2 | 2 | 1472–1474 | 34 | 0 | 34 | 36 | 2.3 (2.3–2.3) | 34.0 (34.0–34.0) |
| CL9 | 3 | 3 | 1478–1492 | 15 | 0 | 15 | 27 | 0.7 (0.5–0.8) | 10.0 (7.0–11.0) |
| CL10 | 10 | 10 | 1467–1486 | 20 | 14 | 34 | 56 | 0.7 (0.1–1.4) | 10.6 (1.0–21.0) |
| CL11 | 8 | 8 | 1465–1486 | 14 | 4 | 18 | 38 | 0.4 (0.1–0.8) | 5.2 (1.0–9.0) |
| CL12 | 7 | 7 | 1469–1486 | 14 | 7 | 21 | 51 | 0.5 (0.1–1.0) | 7.5 (0.0–15.0) |
| CL13 | 8 | 7 | 1477–1488 | 7 | 12 | 19 | 37 | 0.5 (0.0–0.9) | 7.5 (0.0–13.0) |
| CL14 | 5 | 5 | 1469–1490 | 12 | 9 | 21 | 53 | 0.7 (0.3–1.2) | 10.2 (3.0–16.0) |
| CL15 | 8 | 8 | 1464–1489 | 6 | 16 | 22 | 59 | 0.6 (0.1–1.3) | 8.9 (2.0–17.0) |
| CL16 | 6 | 6 | 1464–1486 | 14 | 8 | 22 | 49 | 0.6 (0.3–0.9) | 9.0 (4.0–13.0) |
| Overall | 73 | 62 | 1464–1492 | 50 | 35 | 85 | 72 | 0.7 (0.0–2.6) | 9.6 (0.0–38.0) |

The intragenomic ITS-LSU D1/D3 sequences of each sample were assigned as one group. The evolutionary divergence was estimated by the p-distance from averaging all sequence pairs between groups. The scale bar indicates 0.1% differences. The analysis included 73 nucleotide sequences.
The taxonomy for Curcuma spp. remains controversial. Therefore, we used an authenticated sample of C. longa L. from the South China Botanical Garden as a reference plant. A BLAST search was used to verify our reference samples of C. longa L. (CL10). Three out of 10 ITS LSU D1-D3 sequences (KX831974, KX831979, and KX831982) showed >99% similarity with the GenBank sequences of C. longa isolate Zn_45.5 (KF304500, KF304501, KF304502, KF304504, KF304505, and KF304506), C. longa voucher 360 (KM226976), C. longa voucher 361 (KM226977), C. haritha isolate 118.1 (KJ872082 and KJ872083), and C. amada isolate Zn_44.1 (KF304458, KF304456, and KF304455), indicating that these samples were congeneric species. Therefore, the ITS-LSU D1/D3 sequences of CL10 were incorporated into the ITS sequence file downloaded from GenBank, which served as the reference database. Next, we used different ribosome fragments (ITS-LSU D1/D3 and ITS) to identify the botanical origin of the commercial samples. The BLAST (Expected value <0.00001) results of both ITS-LSU D1/D3 and ITS consistently assigned our reference plant of C. longa L. CL10 as one of the top hits for each query sequence (identity for ITS-LSU D1/D3 and ITS ranged from 97.64–100% and 96.37–100%, respectively) (Table S4). Thus, we identified all of the market samples as C. longa L. and submitted their ITS-LSU D1/D3 sequences into GenBank.
Chemical Discrimination Using HPLC FingerprintingMethanol extracts of the 13 commercial samples were analyzed using HPLC. All of the compounds had different UV absorptivities at different UV wavelengths. A wavelength of 250 nm was chosen for generating chromatograms because it showed better signal responses for the detection of all analyte peaks, whereas 430 nm was selected for detecting CUR, DMC, and BDMC because it resulted in higher signal intensities. Using a gradient solvent system, the chemical profile, consisting of clearly separated peaks, was obtained during a 40-min run for each sample (Fig. 3, Fig. S2). Five common peaks (labeled as 1–5) were detected in all samples at retention times of 21.8, 22.54, 23.2, 32.8, and 36.1 min. Three common peaks, 1, 2, and 3 were identified as BDMC, DMC and CUR, respectively, by comparing with reference standards. The other common peaks were tentatively identified as arturmerone (m/z 217.0, common peak 4), α-Turmerone (m/z 219.0, common peak 5) and β-Turmerone (m/z 219.0, common peak 5′) by HPLC/MS/MS analysis (Fig. 4). To reveal the chemical difference among samples, similarity, peak areas and the content of curcuminoids were determined from the HPLC fingerprints. The similarities of the fingerprints ranged from 0.769 to 0.996 when each sample was compared with the reference chromatogram. The peak areas of the 5 investigated chemical compounds were different significantly with a maximum/minimum value ranged from 6.6–161.1-fold (Table 3). The contents of the three curcuminoids in each sample were determined by reference standards (Fig. S3). As shown in Table 4, the content of BDMC, DMC and CUR were 0.428–21.921, 0.316–16.190, and 1.133–34.961 mg/g, respectively. BDMC, DMC and CUR were markedly varied among samples with a maximum/minimum value of 51.2, 51.2, and 30.9-fold (Table 4), respectively.

The chemical compounds from the 5 labeled peaks were selected for the UPGMA clustering analysis. Standards: 1. bisdemethoxycurcumin (BDMC); 2. demethoxycurcumin (DMC); 3. curcumin (CUR).
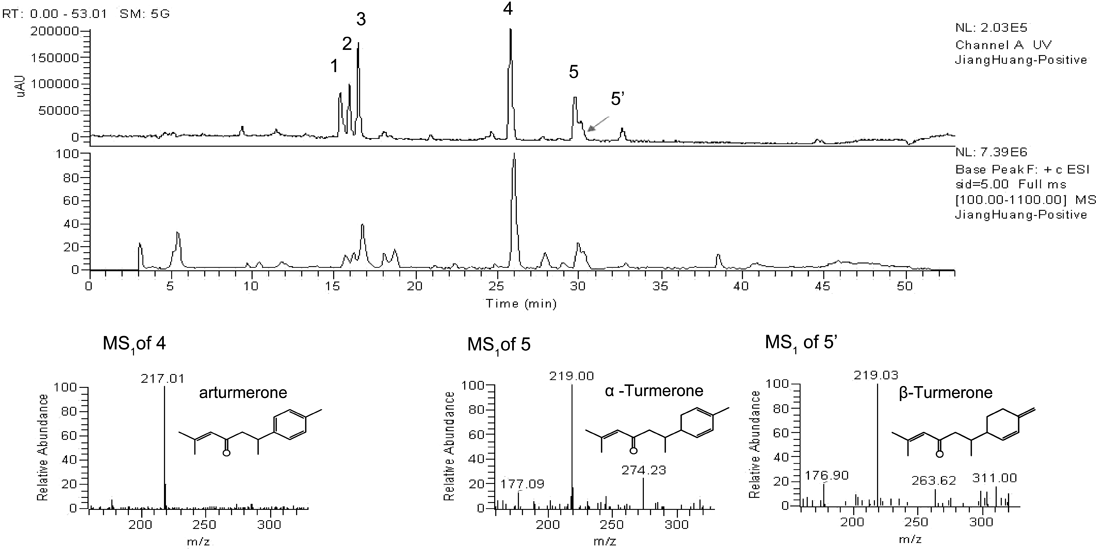
Peak 4: Arturmerone; Peak 5: α-Turmerone; Peak 5′: β-Turmerone.
| Voucher No. | Peak 1 | Peak 2 | Peak 3 | Peak 4 | Peak 5 | Total |
|---|---|---|---|---|---|---|
| CL1 | 5131.7 | 8068.4 | 13157.5 | 2880.2 | 1908.9 | 31146.7 |
| CL2 | 6195.3 | 4361.2 | 8004.7 | 1632.8 | 1157.9 | 21351.9 |
| CL3 | 10281 | 5976.3 | 10666.8 | 2171.9 | 1280.7 | 30376.7 |
| CL4 | 8315.4 | 5494.7 | 12113.5 | 1707.8 | 1087.1 | 28718.5 |
| CL7 | 4153.8 | 5798.5 | 16525.1 | 2185.6 | 962.7 | 29625.7 |
| CL8 | 133.7 | 227.4 | 887.9 | 451.9 | 225.3 | 1926.2 |
| CL9 | 6655.4 | 8026.4 | 12474.4 | 1861.7 | 1162.4 | 30180.3 |
| CL11 | 2970.9 | 3139.2 | 8349.1 | 1308.4 | 518.1 | 16285.7 |
| CL12 | 6253.3 | 7057.3 | 12082.2 | 1853.4 | 1111.4 | 28357.6 |
| CL13 | 152.0 | 478 | 1707.3 | 599.8 | 237.3 | 3174.4 |
| CL14 | 63.8 | 374.5 | 476.2 | 439.4 | 103.2 | 1457.1 |
| CL15 | 125.7 | 1051.9 | 1435.9 | 449.9 | 191.6 | 3255.0 |
| CL16 | 3492.9 | 5043.4 | 8653.7 | 1547 | 44.8 | 18781.8 |
| Max/min | 161.1 | 35.5 | 34.7 | 6.6 | 42.6 | 21.4 |
The peak area data for peaks 1–3 were detected at 430 nm, and the peak area data for peaks 4–5 were detected at 250 nm.
| Voucher No. | BDMC | DMC | CUR | Total |
|---|---|---|---|---|
| CL9 | 14.295 | 16.105 | 26.425 | 56.825 |
| CL3 | 21.921 | 11.954 | 22.613 | 56.488 |
| CL7 | 9.032 | 11.594 | 34.961 | 55.587 |
| CL1 | 11.089 | 16.190 | 27.863 | 55.142 |
| CL4 | 17.786 | 10.979 | 25.662 | 54.427 |
| CL12 | 13.449 | 14.143 | 25.596 | 53.188 |
| CL2 | 13.327 | 8.684 | 17.001 | 39.012 |
| CL16 | 7.642 | 10.066 | 18.369 | 36.077 |
| CL11 | 6.544 | 6.211 | 17.727 | 30.482 |
| CL15 | 0.559 | 1.985 | 3.156 | 5.700 |
| CL13 | 0.614 | 0.823 | 3.728 | 5.165 |
| CL8 | 0.576 | 0.316 | 2.000 | 2.892 |
| CL14 | 0.428 | 0.613 | 1.133 | 2.174 |
| Max/min | 51.2 | 51.2 | 30.9 | 26.0 |
To investigate weather the HPLC fingerprint profiles can discriminate the samples with different content of compounds, a pairwise Euclidean distance matrix was generated from the peak area for the 5 common peaks in the HPLC chromatogram, and a cluster analysis was completed using the nearest distance method. The results revealed that two main groups (Fig. 5). Group I included 9 samples (CL1–4, CL7, CL9, CL11, CL12, CL16) with relatively high chemical content (total curcuminoids: 30.482–56.825 mg/g; curcumin: 17.001–34.961 mg/g), including all of the samples of Guangxi province (CL1–3, CL7, CL12), three samples of Sichuan province (CL9, CL11, CL16), and one sample of Yunnan province (CL4). Group II consisted of 4 samples (CL8, CL13–15) of Sichuan province with relatively low chemical content (total curcuminoids: 2.174–5.700 mg/g; curcumin: 1.133–3.728 mg/g). The clustering results indicated that the chemical composition of the samples was similar within groups but markedly different between groups.

A pairwise Euclidean distance matrix was generated from the peak areas of the 5 common peaks in the HPLC chromatograms.
The Mantel test is often used to compare two sets of dissimilarities or distances, i.e., measure the correlation between two dissimilarity/distance matrices. In this study, we employed the Mantel test to assess how well the chemical composition corresponded to the genetic background of samples. First, the ITS-LSU D1/D3 sequences of each sample were grouped, imported, and aligned in MEGA software. The p-distances between groups were calculated to create a p-distance matrix. Second, the peak area of the 5 common peaks for each sample were extracted, and the pairwise Euclidean distances were calculated in MATLAB to create a Euclidean distance matrix. We then compared the p-distance matrix of ITS-LSU D1/D3 sequences with the Euclidean distance matrix of the HPLC data using a Mantel permutation test (999 times) in R. The Mantel test showed a low correlation (r=0.1721, p=0.047) between genetic distance and HPLC distance, suggesting that chemical composition differences do not correspond well with genetic variations among the Curcumae Longae Rhizoma samples.
In the present study, 13 commercial samples of Curcumae Longae Rhizoma and an authenticated sample of C. longa L. were identified and distinguished using three DNA barcoding markers (rbcL, matK and ITS-LSU D1/D3). We found that the rbcL and matK markers could not assign unique species for all of the market samples of Curcumae Longae Rhizoma (Tables S2 and S3), whereas ITS-LSU D1/D3 sequences assigned them as C. longa L. and precisely distinguished each individual sample (Table S4). Although the rbcL and matK markers have been widely used as core barcodes for identifying land plant species by the CBOL since 2009,6) their discriminatory power is limited.32) Therefore, a new DNA barcode was suggested. Our results highlight the high discriminatory power of ITS-LSU D1/D3 as a novel DNA barcode. ITS-LSU D1/D3 contains three well-documented divergent regions (ITS1, ITS2, and LSU D1/D3), and ITS2,7) ITS,8) and LSU D1/D314) have been proposed as barcoding markers. In addition, there are multiple haplotypes with intragenomic variability (Table 2) that may provide sufficient discriminatory power for the barcoding of each species and the discrimination of herbs with different origins.
Several previous studies identified a single sequence of ITS1 or ITS2 for each individual of C. longa by directly sequencing PCR products.9,12) Using clone sequencing for ITS-LSU D1/D3, we identified 2–10 haplotypes within each sample. Our results are consistent with other studies10,11) reported different ITS sequences among specimens. Therefore, our findings support the use of clone sequencing rather than the direct sequencing of PCR products to obtain accurate sequence data for ribosomal DNA (rDNA) fragments (ITS, ITS2, ITS-LSU D1/D3).
We developed a method for the HPLC fingerprinting of Curcumae Longae Rhizoma using a gradient solvent system with detection at 250 and 430 nm. This method allows for the simultaneous discrimination of the 5 main chemical compounds in these specimens. In addition, the cluster analysis based on the 5 common peak areas clearly distinguished low-content samples. Previous studies reported that the content of curcumin was different significantly within different sources24,33) or different lines.4) Similarly, we showed that the content of curcuminoids varied among samples, especially in samples of Sichuan province which included four samples (CL8, 13–15) with relatively low content of curcumin (Table 4). Although it is qualified according to the requirement of Chinese Pharmacopeia (curcumin content >1.0%), these samples could not be considered as the desirable medical materials with high quality. The various in content of curcuminoids may make it difficult to control the purity, stability and consistency in Traditional Chinese Medicine. Thus, the HPLC fingerprinting method developed in this study may be useful for quality control of Curcumae Longae Rhizoma.
Many researches have used DNA barcoding or HPLC analysis for identifying the species of C. longa L. or its medical materials of Curcumae Longae Rhizoma (turmeric).2,9,12,16,33,34) However, little is known about the relationship of genetic and chemical differences by using integrated approach. In this study, we found a low correlation (r=0.1721, p=0.047) between genetic distance and HPLC distance using the Mantel test. This result indicates that chemical composition differences do not correspond well with genetic variations among Curcumae Longae Rhizoma samples. Our findings were similar to He et al.35) who reported that the relationships (for Coptis spp.) inferred by chemical taxonomy are different to molecular phylogeny. The phytochemical profile of herbs was affected by several factors, such as genetic compositon, growing stage, ambient environmental condition, post-harvest processing, etc.36) Thus, it is necessary to investigate the chemical composition of herbs and identify species based on their genetic background.
Our findings highlight the combined use of HPLC fingerprinting and DNA barcoding with ITS-LSU D1/D3 to assess the quality of Curcumae Longae Rhizoma sold in the medicinal market. ITS-LSU D1/D3 showed high discriminatory power for species identification. HPLC fingerprinting is a simple, sensitive, and accurate method to determine the chemical composition of herb samples. Thus, these combined systems can precisely identify the genetic and chemical differences within herbs and may be useful for the screening of high-quality medical materials.
This work was supported by the Department of Education of Guangdong Province [Grant No.: Guangdong higher education letter (2013) 113] and provincial key platform and key scientific research projects in colleges and universities of Guangdong in 2016 (Grant No.: 2016KTSCX133. Combining DNA barcoding and HPLC fingerprint for authentication of traditional Chinese medicine: a case study of Curcumae Longae Rhizoma). We thank Professor Jingping Liao and Mr. Yushi Ye of the South China Botanical Garden at the Chinese Academy of Sciences for their kind help with sample collection.
The authors declare no conflict of interest.
The online version of this article contains supplementary materials.