Abstract
Halophyte Limonium tetragonum has recently been of interest in Korea for its nutritional value and salty taste which made it an ideal vegetable. In this study, the potential of L. tetragonum preventing excess weight gain, obesity and the related health problem has been evaluated in vitro and in vivo. The treatment with 100 mg/kg of L. tetragonum EtOAc soluble fraction (EALT) apparently prevented the body weight gain, adipose tissue weight gain, and the increase of triglyceride and total cholesterol level in mice fed a high-fat diet for 8 weeks. In addition, both glucose tolerance and insulin resistance in dietary obese mice were improved by EALT administration. A marked decrease in adipocyte differentiation was observed in the EALT (50 µg/mL)-treated 3T3-L1 cells, which was mediated by the suppression of adipogenesis-related transcription factors including peroxisome proliferator-activated receptor (PPAR) γ, CCAAT/enhancer binding protein (C/EBP)α, and Sterol regulatory element binding protein-1 (SREBP-1) and adipocyte-specific proteins such as fatty acid synthase (FAS), lipoprotein lipase (LPL), and adipocyte fatty acid-binding protein (aP2). The major components contained in EALT were identified as (−)-epigallocatechin-3-(3″-O-methyl) gallate, (−)-epigallocatechin-3-gallate, and myricetin-3-O-β-D-galactopyranoside based on its phytochemical analysis. Results suggested that EALT might be available as functional crop and bioactive diet supplement for the prevention and/or treatment of obesity.
Obesity arises from dysregulation of energy balance due to excessive energy intake and insufficient energy expenditure.1) Epidemic increase in overweight and obesity is of medical concern because it is an important risk factor for several chronic diseases, particularly dyslipidemia, cardiovascular disease, and type 2 diabetes.2,3) Besides, obesity is a strong causal factor for sleep-disordered breathing such as sleep apnea and sleep disruption, which contributes to the increased cardiovascular mortality.4) Naturally occurring products have attracted researchers’ attentions as sources of new drugs and drug leads for the treatment of obesity.5) Numerous trials have been conducted to discover pharmacological features of plant-derived extracts, compounds, and phytochemical combinations as anti-obesity agents.6,7)
Adipocyte differentiation, also known as adipogenesis, results from the transcriptional activation and repression of adipocyte genes.8) Cross-regulation of peroxisome proliferator-activated receptor (PPAR) and CCAAT/enhancer binding protein (C/EBP) controls the transcriptional action of adipogenesis and insulin sensitivity.9,10) Adipocytes express high levels of adipogenic transcription factors including PPARγ and C/EBPα during the development of obesity.10) PPARγ2, a isoform of PPARγ is described as an adipocyte-specific nuclear hormone receptor which is capable of activating the adipocyte-specific adipocyte fatty acid-binding protein (aP2) enhancer in heterologous cells.9) Sterol regulatory element binding protein-1 (SREBP-1) is also found to be an essential transcriptional regulator involved in adipogenesis. Regulatory interactions between SREBP-1 and PPARγ/C/EBPα can coordinate full differentiation of preadipocytes into adipocytes.11,12) In addition, PPARγ/C/EBPα and SREBP-1 induces gene expression of aP2, fatty acid synthase (FAS) and lipoprotein lipase (LPL) linked to fatty acid metabolism, thus promotes adipogenesis.9,13) Taken together, inhibition of adipogenesis by modulating the concerted action of adipocyte-specific genes (PPARγ, C/EBPα, SREBP-1, FAS, LPL, and aP2) would be expected to provide a key strategy to control obesity.11)
A biennial herbaceous halophytes Limonium tetragonum (THUNB.) Bullock (Plumbaginaceae) is widely distributed in the southwestern costal area of South Korea.14) Young buds and shoots of L. tetragonum, growing in a harsh environment of high salinity, have been used as edible vegetables in Korea.15) The L. tetragonum are known to have biological properties such as anticancer and antioxidant activities due to the presence of bioactive flavonoids.16–18) Our previous researches mainly focused on the liver protection of L. tetragonum by suppression of hepatic satellite cells (HSC-T6) proliferation,19) liver injury induced by acute alcohol,20) and diethylnitrosamine-induced liver fibrosis.21) However, current studies do not contain any reports on the beneficial effects of certain extract from L. tetragonum in prevention and/or treatment of obesity. Adipogenesis inhibitory activity of the halophyte L. tetragonum was reported by Kwon et al., but it was related to metabolic bone disorders such as osteoporosis.22) This study was undertaken to determine the in vivo anti-obesity effect of EtOAc soluble fraction of L. tetragonum extract (EALT) in high-fat diet-induced obese mouse model. Besides, its anti-adipogenic mechanism mediated through modulation of PPARγ, C/EBPα, SREBP1, FAS, LPL, and aP2 was investigated using 3T3-L1 cells.
MATERIALS AND METHODS
Plant Material and Sample PreparationThe aerial part of L. tetragonum was collected from the foreshore in Sinan-gun, Korea (July 2013) and identified by Prof. Eun Ju Jeong of Gyeongnam National University of Science and Technology. A voucher specimen (GNP-70) has been deposited in the laboratory of pharmacognosy, college of life sciences and natural resources, Gyeongnam National University of Science and Technology. EALT were prepared as previously described.14) In brief, dried samples of L. tetragonum (2 kg) were extracted with MeOH and evaporated under reduced pressure to yield a methanolic extract (560.9 g). The L. tetragonum extract was suspended in distilled water and partitioned with CHCl3, EtOAc, and n-BuOH. EALT (42.69 g) was filtered and evaporated in vacuum, and then dissolved in dimethyl sulfoxide (DMSO) (0.1% (w/v) final concentration) for biological tests in 3T3-L1 cells and in 0.5%-carboxymethyl cellulose (CMC) for the treatment to experimental animals.
Chromatographic ConditionsAgilent 1100 series HPLC system with a quaternary pump, an autosampler, a diode array detector (DAD) were used for HPLC analysis. The freeze dried EALT was weighed accurately and diluted with 50% methanol. Followed by filtered through 0.45 µm membrane filter (Millipore, polyvinylidene difluoride (PVDF), 170 mm) and analyzed with HPLC. Chromatographic separation was achieved on a Phenomenex hyrdo-RP18 (5 µm, 4.6×250 mm) in the mobile phase composed of (A) MeOH and (B) H2O with 0.1% acetic acid at a flow rate of 0.8 mL/min, with gradient elution as follows: 0–20 min, 35–40% A; 20–30 min, 40% A; 30–40 min, 45–50% A; 40–50 min, 50% A. The eluent was monitored at 254 nm.
Isolation of Standard Compounds from L. tetragonumEALT was subjected to column chromatography on a silica gel column using mixtures of CHCl3−MeOH of increasing polarity as eluents to give 19 fractions (E1–19). E5 was further subjected to ODS gel column chromatography with a gradient elution of MeOH−H2O (25→62% MeOH) to give five fractions (E5-1–5). Compound 1 was isolated from E5-1. E10 was subjected to column chromatography on Sephadex LH-20 with elution of MeOH to give fourteen fractions (E10-1–14). Compounds 2 and 3 were obtained from E10-13 and E10-11, respectively. E14 and E15 were combined and subjected to ODS gel column chromatography with a gradient elution of MeOH−H2O (5→80% MeOH) to give eleven fractions (E1415-1–11). Compounds 4, 5, 7 and 9 were isolated from E1415-10 through C18 RP HPLC using as eluent a mixture of MeCN and H2O (20 : 80) at a flow rate of 2.0 mL/min. E1415-11 was applied to C18 RP HPLC using as eluent a mixture of AcCN and H2O (26 : 74) at a flow rate of 2.0 mL/min to yield compounds 6 and 8.
Animals and DietsMale C57BL/6J mice (3 weeks old) were purchased from Central Lab. Animal Inc. (Seoul, Korea). Animals were acclimatized for two weeks under a 12h : 12h light–dark cycle and constant temperature (20±2°C) and humidity (50±5%), with water and food freely available. The mice were divided into 4 groups and then fed a normal diet containing 10% kcal fat (3.85 kcal/g) or a high-fat diet containing 60% kcal fat (5.24 kcal/g) (Research Diets Inc., New Brunswick, NJ, U.S.A.). EALT dissolved in 0.5% CMC was orally administered (100 mg/kg body weight) once a day for 8 weeks. The high-fat diet mice received either 15 mg/kg body weight Orlistat (Zenical®, Roche Pharm Ltd., Reinach, Switzerland) or 0.5% CMC (10 mL/kg body weight) orally as a positive or negative control. A normal diet group was also treated with only 0.5% CMC (10 mL/kg body weight) as a vehicle. All animal experiments were carried out according to the guidelines of the Gyeongnam Department of Environment & Toxicology, Korea Institute of Toxicology on the Care and Use of Laboratory Animals. Four groups are as follows.
-
Group I (ND): received oral 0.5%-CMC and fed a normal diet (Normal control group)
-
Group II (VC): received oral 0.5%-CMC and fed a high-fat diet, used as a disease group (Negative control group)
-
Group III (LT): received EALT (100 mg/kg body weight/rat, per os (p.o.)) and fed a high-fat diet
-
Group IV (PC): received Orlistat (15 mg/kg body weight/rat, p.o.) and fed a high-fat diet (Positive control group)
The body weight and food consumption per cage were measured under the condition of non-fasting once a week. After 8 weeks of treatment, mice were sacrificed by cervical dislocation and the epididymal and perirenal adipose tissue were dissected and weighed. Blood samples were obtained from the abdominal aorta. After leaving a serum separation tube in room temperature for 30 min, blood sample was then centrifuged at 3000 rpm for 15 min to separate serum and plasma cells. The serum levels of triglyceride (TG), total cholesterol (TC), low-density lipoprotein cholesterol (LDLC), and high-density lipoprotein cholesterol (HDLC) were estimated by Hitachi 7180 Automatic Analyzer (Hitachi High Technologies Korea, Seoul, Korea).
Determination of Oral Glucose Tolerance Test (OGTT) and Intraperitoneal Insulin Tolerance Test (IPITT)Non-fasting glucose level was measured once a week during 8 weeks of diet feeding. OGTT and IPITT were performed after 7 weeks on the high fat diet (HFD). Mice weighing over 30 g were selected and fasted for 4 h followed by glucose (2 g/kg) was given orally for OGTT, or insulin (1 U/kg; Actrapid, Novo Nordisk, Bagsvaerd, Denmark) was given intraperitoneally for IPITT, at time 0. Two hundred µL of blood was sampled from tail at 15, 30, 60 and 120 min for both OGTT and IPITT. Blood glucose concentration was determined with a glucometer (Accu-Chek Active; Roche Applied Science, Indianapolis, IN, U.S.A.), and the areas under the curve (area under curve (AUC); millimolar per minute) were calculated.
3T3-L1 Cell Culture and Cytotoxicity TestMouse embryo preadipocyte (3T3-L1) cell lines was obtained from ATCC (American Type Culture Collection, Manassas, VA, U.S.A.) and cultured in Dulbecco’s modified Eagle’s medium (DMEM) containing 10% calf serum, 100 U/mL penicillin and 100 µg/mL streptomycin in a humidified atmosphere of 5% CO2 at 37°C. Cell viability was determined by using a colorimetric 3-(4,5-dimethylthiazol-2-yl)-2,5-diphenyl tetrazolium bromide (MTT) assay based on the reduction of MTT (Sigma, St. Louis, MO, U.S.A.) to formazan by cellular dehydrogenase. Cells were seeded at a density of 5×10⁴/mL in 48-well plate and grown to adhere overnight. Various concentrations (25, 50, 100, and 200 g/mL) of EALT was treated and incubated at 37°C for 48 h. MTT dye reagent was then prepared at 2 mg/mL in distilled water and added to each well for 4 h. The insoluble formazan precipitates were dissolved in DMSO and the absorbance was measured at 550 nm in a microplate reader (Synergy H1 hybrid reader, Biotek, VT, U.S.A.).
3T3-L1 Adipocyte Differentiation and Oil Red O StainingAdipocyte differentiation was induced in 100% confluent 3T3-L1 cells with adipogenic medium (DMEM containing 10% FBS with 0.5 mM IBMX, 1 µM dexamethasone, and 1 µg/mL insulin) for two days with or without samples (6.25–50 µg/mL). This was followed by changing the medium to 10% FBS/DMEM containing 1 µg/mL insulin with or without samples for additional two days. The medium was then maintained in 10% FBS/DMEM for another four days. Lipid accumulation in adipocytes was estimated by staining with Oil Red O. Eight days after the initiation of differentiation, 3T3-L1 cells were washed with PBS and fixed in 70% ethanol as described previously.23) The cells were stained with 0.6% Oil red O dye for 1 h to show accumulated cytoplasmic lipid. The visualization of lipids was performed by Olympus IX50 microscope (Olympus, Tokyo, Japan).
Quantitative Real Time PCR AnalysisQuantification of gene expression of PPARγ, C/EBPα, SREBP1, FAS, LPL, and aP2 was measured using a real-time PCR system. 3T3-L1 cells were treated with vehicle, positive control (epigallocatechin gallate, EGCG, 50 µg/mL), or EALT (12.5, 25, and 50 µg/mL) for 24 h. Total RNA of 3T3-L1 adipocytes was isolated using the RNease Plus Kit. cDNA was synthesized from l g of total RNA using a QuantiTech Reverse Transcription Kit, followed by mixing with QuantiFast SYBR Green PCR master mix. PCR was performed in a final volume of 20 µL (QIAGEN Korea Ltd., Seoul, Korea). The amplification cycles was conducted at 95°C for 20 s, 60°C for 20 s, and 72°C for 20 s, followed by a final extension step at 72°C for 5 min. The relative amount of each gene Quantitative SYBR Green real-time PCR was performed with an Stratagene Mx3000P (Agilent Technologies, CA, U.S.A.) and analyzed by means of comparative Ct quantification using glyceraldehyde-3-phosphate dehydrogenase (GAPDH) as an internal control.
Statistical AnalysisEach data value was presented as the mean±standard error (S.E.) Data of body weight were analyzed by two-way ANOVA, while in vitro assay and in vivo biochemical parameters were analyzed by one-way ANOVA. The data were considered to be significant statistically if the probability had a value of 0.05 or less. (GraphPad Prism version 5.00, GraphPad Software, San Diego, CA, U.S.A.)
RESULTS
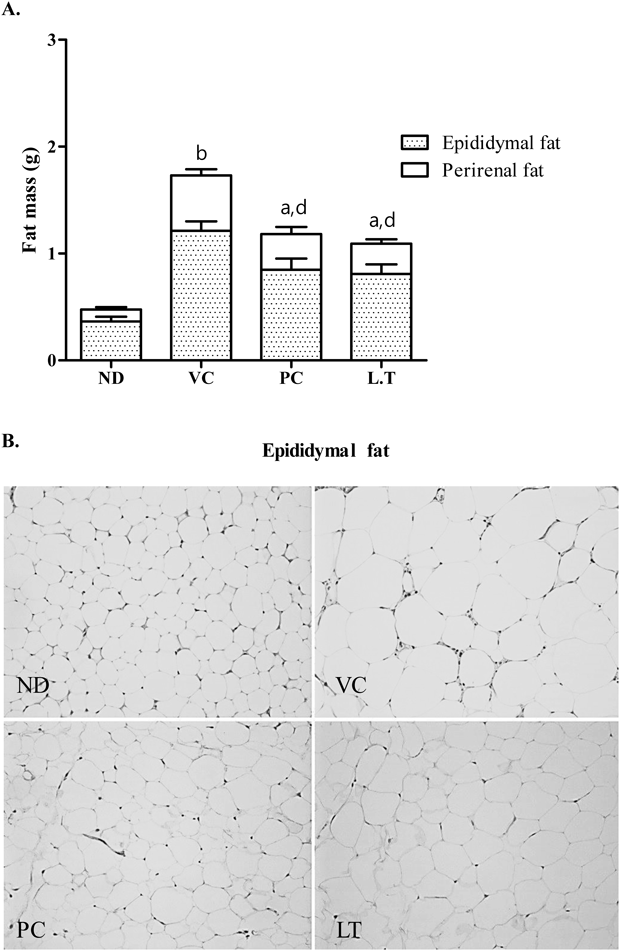
Effects of EALT on Body Weight Gain and Adipose Tissue Weight in High-Fat Diet-Induced MiceThe body weight gain of VC (high-fat diet) group was greater than the value for the ND (normal diet) group (Fig. 1). Two-fold increase in body weight gain was observed in VC group compared with ND group. Orlistat is an anti-obesity drug that is currently available as a strong gastrointestinal lipase inhibitor.24) In the present study, Orlistat has been used as a positive control in which it effectively decreased weight gain by 28.28% (p<0.05) at the end of experiment (week 8). The average body weight of LT group (29.24 g) was considerably lower than that of the VC group (32.62 g). The adipose tissue weight, including epididymal and perirenal fat, of obese mice were also markedly reduced by treatment of Orlistat and EALT (Fig. 2A). Cumulative fat mass of VC group was estimated as the 3.6-fold value of ND group. Treatment of Orlistat and EALT lowered the adipose tissue weight to 56.30 and 49.12%, respectively, when compared to the VC group, yet its values were still high compare to those of ND group. Histological analysis showed that the size of epididymal fat in PC and LT groups were significantly smaller compared with the VC group (Fig. 2B). Since food consumption was not significantly different between the cages, data was not shown.
Effects of EALT on Serum Lipid Levels in Mice Fed a High-Fat DietSerum lipid profiles including TG, TC, LDLC, and HDLC of the four groups of mice were shown in Fig. 3. High-fat diet feeding increased in the serum levels of TG (1.59-fold), TC (1.33-fold), and low density lipoprotein (LDL) (1.23-fold) compared to the ND group. EALT administration markedly prevented the elevation of serum TG and TC by 61.34% and 13.32%, respectively, compared to VC group. Furthermore, increased LDL level in VC group was reduced by the treatment of EALT by 15.50% (p<0.01). However, the difference in plasma HDLC level between the treatment groups was not statistically significant.
Effects of EALT on High-Fat Diet-Induced Glucose Intolerance and Insulin ResistanceOGTT and IPITT were performed to evaluate the effect of EALT on glucose and insulin tolerance. Feeding a high-fat diet to mice for 8 weeks developed severe glucose intolerance and insulin resistance, characterized by increased area under the blood glucose curves and the integrated AUCs (Figs. 4, 5). During OGTT, the blood glucose of VC group increased to 488 mg/dL after 30 min from a baseline value of 253.6 mg/dL (Fig. 4A). AUC-OGTT of VC group was 48618 (p<0.001), which was significant rise (180.66%) in AUC-OGTT over corresponding value of ND group (25869.4) (Fig. 4B). In contrast, mice that received EALT exhibited a significant decrease in the post glucose challenge AUC-OGTT (35371.6). In IPITT, mice in VC group also exhibited severe insulin resistance (Fig. 5A). In mice of LT group that treated with EALT following intraperitoneally (i.p.) insulin load, the level of blood glucose decreased to 116.4 mg/dL after 30 min from a baseline value of 188.8 mg/dL (Fig. 5A). AUC-IPITT values of PC, a positive control, and LT mice were 12568.8 and 16143.2, respectively, which were 44.35 and 28.53% less as compared to corresponding values observed in VC mice (22587.2) (Fig. 5B).
Effects of EALT on 3T3-L1 Cell Viability and Adipogenic DifferentiationIn the MTT cell viability assay, EALT did not show any appreciable cytotoxicity at the concentration range of maximum 50 µg/mL (Fig. 6). Therefore, 3T3-L1 adipogenesis inhibition test of EALT was performed at the concentrations below 50 µg/mL. After 8 d of treatment, morphological changes in 3T3-L1 adipocytes were detected by microscope. EALT (6.25–50 µg/mL) dose-dependently inhibited fat accumulation during the differentiation of 3T3-L1 preadipocytes as shown in Fig. 7. EGCG was used as a positive control since it has been known as potent inhibitor of adipocyte differentiation in 3T3-L1 cells.25) Under the same experimental condition, the significant suppression in adipgenesis was found in EGCG (50 µg/mL) treated cells.
Effects of EALT on the Expression of Adipocyte-Specific GenesThe effect of EALT on the expression of the adipocyte-specific genes such as PPARγ, C/EBPα, SREBP1, FAS, LPL, and aP2 was investigated in maturing 3T3-L1 preadipocytes. Exposure of EALT to adipocytes resulted in dose-dependent inhibitions of PPARγ and C/EBPα in the concentration range of 12.5-50 µg/mL. EALT decreased PPARγ and C/EBPα mRNA expression by 65.99 and 68.76%, respectively, at a concentration of 50 µg/mL (Figs. 8A, B). The mRNA expression of adipocyte-related proteins SREBP1, FAS, LPL, and aP2 were also down-regulated by EALT (50 µg/mL) to 50.39, 54.65, 72.22, and 66.37%, respectively (Figs. 8C–F). At a concentration of 50 µg/mL, EGCG (a positive control) showed considerable decreases in mRNA levels of adipocyte-related genes such as PPARγ (88.31% decrease), C/EBPα (93.96% decrease), SREBP1 (71.88% decrease), FAS (78.09% decrease), LPL (77.01% decrease), and aP2 (94.35% decrease).
Phytochemical Analysis of EALTPhytochemical characterization of the EALT was performed by HPLC system. The chemical profile is shown in Fig. 9A for the EALT and in Fig. 9B for chemical structures of components. The EALT contained gallincin (1), (−)-epigallocatechin-3-(3″-O-methyl) gallate (2), (−)-epigallocatechin-3-gallate (3), myricetin-3-O-β-D-galactopyranoside (4), myricetin-3-O-α-L-rhamnopyranoside (5), myricetin-3-O-α-L-arabinopyranoside (6), quercetin-3-O-β-D-galactopyranoside (7), myricetin-3-O-(2″-O-galloyl)-α-L-rhamnopyranoside (8), and myricetin-3-O-(3″-O-galloyl)-α-L-rhamnopyranoside (9) as main compounds.
DISCUSSION
The development of obesity in adipose tissue is accompanied by adipocyte hypertrophy (cell enlargement) followed by hyperplasia (cell proliferation).26) Excess lipid accumulation during adipocyte differentiation results in adipocyte hypertrophy and ultimately obesity. Adipogenesis is regulated by a transcriptional cascade composed of several transcriptional factors, among which PPARγ, C/EBPs, and the basic helix–loop–helix family (ADD1/SREBP1c) directly influence fat cell development.27) Besides, lipogenic enzymes such as FAS and LPL play an important role in adipocyte lipid accumulation during adipogenesis.28) Thus, searching for new anti-adipogenic agents from natural materials targeting these key adipogenic markers might be a promising strategy for the prevention and treatment of obesity.29)
Anti-obesity and hypolipidemic effects of EALT were investigated in dietary obese mice. It has been reported that animal model of obesity induced by high-fat diet resembles the human obesity.30) Adipocyte hypertrophy, hyperplasia, and insulin resistance, similar to those in human obese subjects, were observed in rodents after high-fat diet feeding. In our present study, as expected, exposure of mice to a high-fat diet caused severe obesity characterized by an enlargement in fat cell size. A significant reduction in body weight gain and fat deposition in obese mice was detected by treatment of EALT. According to histological analyses of epididymal fat, adipocytes from VC group were markedly larger than those from ND group. An increase in total white adipose tissue mass of epididymal and perirenal fat under high-fat diet was inhibited in 100 mg/kg EALT-administered mice. It could be ruled out the possibility of appetite-suppressing effect by EALT administration, because there were no differences of food consumption rate between the cages (data not shown). The prevention of fat accumulation by EALT in high-fat diet-induced obese mice was correlated with its anti-adipogenesis activity in 3T3-L1 cells.
Many studies have reported that prolonged feeding with fat-enriched diets led to fasting hypertriglyceridemia and hypercholesterinemia.30) Elevated TG and TC concentrations are a common feature of obesity itself or closely linked metabolic diseases.30,31) Changes in plasma lipid profiles revealed that EALT apparently decreased levels of TG, TC, and LDL in dietary obese mice. In contrast, we failed to observe significant change in the high density lipoprotein (HDL) level with EALT treatment. Consumption of high levels of dietary fat is considered to be a major factor in the promotion of hyperglycemia and whole-body insulin resistance.32) In this regard, high-fat diet-induced obesity is directly connected with an increased risk of type 2 diabetes.33) Our observations of hyperglycemia and insulin tolerance in mice fed high-fat diet confirmed induction of dietary obesity. EALT co-administration with high-fat diet prevented both glucose and insulin tolerance during OGTT and IPITT. Taken together, EALT might contribute to improvement of insulin sensitivity and resultant lowering of the elevated blood glucose level in obesity.
PPARγ is recognized as a master regulator of adipocyte differentiaion in vivo and in vitro through transcription of various fat-cell specific genes.34) The expression of PPARγ is both necessary and sufficient to initiate adipogenesis and helps the activation of C/EBPα to maintain the differentiated status.9) Furthermore, PPARγ has been reported to cooperate with SREBP1, also referred to as ADD1, through production of endogenous PPARγ ligand and stimulation of PPARγ expression by SREBP1.35) The EALT (50 µg/mL) suppressed adipocyte differentiation in 3T3-L1 cells by down-regulating mRNA levels of PPARγ, a pivotal transcription factor in adipogenesis, together with C/EBPα and SREBP1. Under the same experimental condition, EALT (50 µg/mL) treatment also inhibited mRNA expression of the main lipogenic enzymes FAS and LPL. PPARγ, C/EBPα, and SREBP1 synergistically promotes adipocyte differentiation by activating the downstream promoters of adipocyte-specific genes such as FAS and LPL.36,37) In addition to its role in activating the enzymes involved in lipid metabolism, PPARγ induces the adipose cell-selective protein named adipocyte P2 (aP2).27) The adipocyte lipid binding protein aP2 appear to be involved in the transcriptional activation of adipocyte differentiation as a key protein in the link between obesity and diabetes.38,39) Our in-depth mechanism study demonstrated that anti-adipogenesis effect of EALT was mediated not only by the regulation of adipogenic transcription factors such as PPARγ, C/EBPα, and SREBP1 but also by modulating adipocyte-specific genes such as FAS, LPL, and aP2.
Fingerprint analysis identified (−)-epigallocatechin-3-(3″-O-methyl) gallate, (−)-epigallocatechin-3-gallate, and myricetin-3-O-β-D-galactopyranoside present in the EALT as major components. Out of three isolates from EALT, (−)-epigallocatechin-3-gallate called EGCG has already been reported to inhibit adipocyte differentiation by down-regulation of PPARγ, C/EBPα, and AMP-activated protein kinase.40,41) In addition, methylated catechins such as (−)-epigallocatechin-3-(3″-O-methyl) gallate (EGCG3Me) contained in the EALT were also known to play important role in reducing weight gain.42) Taken together, (−)-epigallocatechin-3-gallate and (−)-epigallocatechin-3-(3″-O-methyl) gallate appear to be responsible for the anti-obesity effect of EALT.
Collectively, administration of EALT enriched with bioactive catechins and flavonoids effectively prevented weight gain and decreased body fat mass induced by high-fat diet feeding in animal model. EALT was also useful in improving blood chemistry and mitigating both glucose tolerance and insulin tolerance thus improved hyperglycemia in dietary obese mice. These beneficial effects of EALT were mediated by the suppression of mRNA expression of adipocyte-specific genes including PPARγ, C/EBPα, SREBP1, FAS, LPL, and aP2. Further study is warranted to confirm the anti-obesity effect of EALT in the obese human.
Acknowledgments
This research was supported by Basic Science Research Program through the National Research Foundation of Korea (NRF) funded by the Ministry of Science, ICT & Future Planning (2016R1C1B2007694) and supported by Korea Institute of Planning and Evaluation for Technology in Food, Agriculture, Forestry and Fisheries (IPET) through High Value-added Food Technology Development Program (116016-3), funded by Ministry of Agriculture, Food and Rural Affairs (MAFRA).
Conflict of Interest
The authors declare no conflict of interest.
REFERENCES
- 1) Rössner S. Obesity: the disease of the twenty-first century. Int. J. Obes. Relat. Metab. Disord., 26 (Suppl. 4), S2–S4 (2002).
- 2) Flegal KM, Graubard BI, Williamson DF, Gail MH. Cause-specific excess deaths associated with underweight, overweight, and obesity. Obstet. Gynecol. Surv., 63, 157–159 (2007).
- 3) Nikolopoulou A, Kadoglou NP. Obesity and metabolic syndrome as related to cardiovascular disease. Expert Rev. Cardiovasc. Ther., 10, 933–939 (2012).
- 4) Wolk R, Shamsuzzaman AS, Somers VK. Obesity, sleep apnea, and hypertension. Hypertension, 42, 1067–1074 (2003).
- 5) Newman DJ, Cragg GM. Natural products as sources of new drugs over the last 25 years. J. Nat. Prod., 70, 461–477 (2007).
- 6) Sergent T, Vanderstraeten J, Winand J, Beguin P, Schneider YJ. Phenolic compounds and plant extracts as potential natural anti-obesity substances. Food Chem., 135, 68–73 (2012).
- 7) Yun JW. Possible anti-obesity therapeutics from nature—A review. Phytochemistry, 71, 1625–1641 (2010).
- 8) Gregoire FM. Adipocyte differentiation: from fibroblast to endocrine cell. Exp. Biol. Med., 226, 997–1002 (2001).
- 9) Wu Z, Rosen ED, Brun R, Hauser S, Adelmant G, Troy AE, McKeon C, Darlington GJ, Spiegelman BM. Cross-regulation of C/EBPα and PPARγ controls the transcriptional pathway of adipogenesis and insulin sensitivity. Mol. Cell, 3, 151–158 (1999).
- 10) Ntambi JM, Kim YC. Adipocyte differentiation and gene expression. J. Nutr., 130, 3122S–3126S (2000).
- 11) Fajas L, Schoonjans K, Gelman L, Kim JB, Najib J, Martin G, Fruchart JC, Briggs M, Spiegelman BM, Auwerx J. Regulation of peroxisome proliferator-activated receptor γ expression by adipocyte differentiation and determination factor 1/sterol regulatory element binding protein 1: implications for adipocyte differentiation and metabolism. Mol. Cell. Biol., 19, 5495–5503 (1999).
- 12) Fajas L, Fruchart JC, Auwerx J. Transcriptional control of adipogenesis. Curr. Opin. Cell Biol., 10, 165–173 (1998).
- 13) Kim JB, Spiegelman BM. ADD1/SREBP1 promotes adipocyte differentiation and gene expression linked to fatty acid metabolism. Genes Dev., 10, 1096–1107 (1996).
- 14) Ihm BS, Lee JS, Kim JW. Coastal vegetation on the western, southern, and eastern coasts of South Korea. J. Plant Biol., 44, 163–167 (2001).
- 15) Min BM. Vegetation on the west coast of Korea. Ocean. Res., 20, 167–178 (1998).
- 16) Lee JI, Kong CS, Jung ME, Hong JW, Lim SY, Seo Y. Antioxidant activity of the halophyte Limonium tetragonum and its major active components. Biotechnol. Bioprocess Eng.; BBE, 16, 992–999 (2011).
- 17) Kong CS, Um YR, Lee JI, Kim YA, Lee JS, Seo YW. Inhibition effects of extracts and its solvent fractions isolated from Limonium tetragonum on growth of human cancer cells. Korean J. Biotechnol. Bioeng., 23, 177–182 (2008).
- 18) Kim NH, Sung SH, Heo JD, Jeong EJ. The extract of Limonium tetragonum protected liver against acute alcohol toxicity by enhancing ethanol metabolism and antioxidant enzyme activities. Nat. Prod. Sci., 21, 54–58 (2015).
- 19) Yang MH, Kim NH, Heo JD, Sung SH, Jeong EJ. Hepatoprotective effects of Limonium tetragonum, edible medicinal halophyte growing near seashores. Pharmacogn. Mag., 10 (Suppl. 3), 563–568 (2014).
- 20) Kim NH, Sung SH, Heo JD, Jeong EJ. The extract of Limonium tetragonum protected liver against acute alcohol toxicity by enhancing ethanol metabolism and antioxidant enzyme activities. Nat. Prod. Sci., 21, 54–58 (2015).
- 21) Kim NH, Heo JD, Kim TB, Rho JR, Yang MH, Jeong EJ. Protective effects of ethyl acetate soluble fraction of Limonium tetragonum on diethylnitrosamine-induced liver fibrosis in rats. Biol. Pharm. Bull., 39, 1022–1028 (2016).
- 22) Kwon MS, Karadeniz F, Kim JA, Seo Y, Kong CS. Adipogenesis inhibitory effects of Limonium tetragonum in mouse bone marrow stromal D1 cells. Food Sci. Biotechnol., 25 (S1), 125–131 (2016).
- 23) Kasturi R, Joshi VC. Hormonal regulation of stearoyl coenzyme A desaturase activity and lipogenesis during adipose conversion 3T3-L1 cells. J. Biol. Chem., 257, 12224–12230 (1982).
- 24) Heck AM, Yanovski JA, Calis KA. Orlistat, a new lipase inhibitor for the management of obesity. Pharmacotherapy, 20, 270–279 (2000).
- 25) Furuyashiki T, Nagayasu H, Aoki Y, Bessho H, Hashimoto T, Kanazawa K, Ashida H. Tea catechin suppresses adipocyte differentiation accompanied by down-regulation of PPARγ2 and C/EBPα in 3T3-L1 cells. Biosci. Biotechnol. Biochem., 68, 2353–2359 (2004).
- 26) Nishimura S, Manabe I, Nagasaki M, Hosoya Y, Yamashita H, Fujita H, Ohsugi M, Tobe K, Kadowaki T, Nagai R, Sugiura S. Adipogenesis in obesity requires close interplay between differentiating adipocytes, stromal cells, and blood vessels. Diabetes, 56, 1517–1526 (2007).
- 27) Rosen ED, Walkey CJ, Puigserver P, Spiegelman BM. Transcriptional regulation of adipogenesis. Genes Dev., 14, 1293–1307 (2000).
- 28) Ranganathan G, Unal R, Pokrovskaya I, Yao-Borengasser A, Phanavanh B, Lecka-Czernik B, Rasouli N, Kern PA. The lipogenic enzymes DGAT1, FAS, and LPL in adipose tissue: effects of obesity, insulin resistance, and TZD treatment. J. Lipid Res., 47, 2444–2450 (2006).
- 29) Nawrocki AR, Scherer PE. Keynote review: the adipocyte as a drug discovery target. Drug Discov. Today, 10, 1219–1230 (2005).
- 30) Buettner R, Schölmerich J, Bollheimer LC. High-fat diets: modeling the metabolic disorders of human obesity in rodents. Obesity, 15, 798–808 (2007).
- 31) Dixon JB, O’brien PE. Lipid profile in the severely obese: changes with weight loss after lap-band surgery. Obes. Res., 10, 903–910 (2002).
- 32) Rivellese AA, De Natale C, Lilli S. Type of dietary fat and insulin resistance. Ann. N. Y. Acad. Sci., 967, 329–335 (2002).
- 33) Kahn BB, Flier JS. Obesity and insulin resistance. J. Clin. Invest., 106, 473–481 (2000).
- 34) Cristancho AG, Lazar MA. Forming functional fat: a growing understanding of adipocyte differentiation. Nat. Rev. Mol. Cell Biol., 12, 722–734 (2011).
- 35) Kim JB, Wright HM, Wright M, Spiegelman BM. ADD1/SREBP1 activates PPARγ through the production of endogenous ligand. Proc. Natl. Acad. Sci. U.S.A., 95, 4333–4337 (1998).
- 36) Spiegelman BM, Flier JS. Obesity and the regulation review of energy balance. Cell, 104, 531–543 (2001).
- 37) Gregoire FM, Smas CM, Sul HS. Understanding adipocyte differentiation. Physiol. Rev., 78, 783–809 (1998).
- 38) Distel RJ, Ro HS, Rosen BS, Groves DL, Spiegelman BM. Nucleoprotein complexes that regulate gene expression in adipocyte differentiation: direct participation of c-fos. Cell, 49, 835–844 (1987).
- 39) Reese-Wagoner A, Thompson J, Banaszak L. Structural properties of the adipocyte lipid binding protein. Biochim. Biophys. Acta, 1441, 106–116 (1999).
- 40) Hwang JT, Park IJ, Shin JI, Lee YK, Lee SK, Baik HW, Ha J, Park OJ. Genistein, EGCG, and capsaicin inhibit adipocyte differentiation process via activating AMP-activated protein kinase. Biochem. Biophys. Res. Commun., 338, 694–699 (2005).
- 41) Furuyashiki T, Nagayasu H, Aoki Y, Bessho H, Hashimoto T, Kanazawa K, Ashida H. Tea catechin suppresses adipocyte differentiation accompanied by down-regulation of PPARgamma2 and C/EBPalpha in 3T3-L1 cells. Biosci. Biotechnol. Biochem., 68, 2353–2359 (2004).
- 42) Imbe H, Sano H, Miyawaki M, Fujisawa R, Miyasato M, Nakatsuji F, Haseda F, Tanimoto K, Terasaki J, Maeda-Yamamoto M, Tachibana H, Hanafusa T. “Benifuuki” green tea, containing O-methylated EGCG, reduces serum low-density lipoprotein cholesterol and lectin-like oxidized low-density lipoprotein receptor-1 ligands containing apolipoprotein B: A double-blind, placebo-controlled randomized trial. J. Funct. Foods, 25, 25–37 (2016).