Abstract
Aniline and its dimethyl derivatives reportedly become haematotoxic after metabolic N-hydroxylation of their amino groups. The plasma concentrations of aniline and its dimethyl derivatives after single oral doses of 25 mg/kg in rats were quantitatively measured and semi-quantitatively estimated using LC–tandem mass spectrometry. The quantitatively determined elimination rates of aniline; 2,4-dimethylaniline; and 3,5-dimethylaniline based on rat plasma versus time curves were generally rapid compared with those of 2,3-; 2,5-; 2,6-; and N,2-dimethylaniline. The primary acetylated metabolites of aniline; 2,4-dimethylaniline; and 3,5-dimethylaniline, as semi-quantitatively estimated based on their peak areas in LC analyses, were more extensively formed than those of 2,3-; 2,5-; 2,6-; and N,2-dimethylaniline. The areas under the curve of unmetabolized (remaining) aniline and its dimethyl derivatives estimated using simplified physiologically based pharmacokinetic models (that were set up using the experimental plasma concentrations) showed an apparently positive correlation with the reported lowest-observed-effect levels for haematotoxicity of these chemicals. In the case of 2,4-dimethylaniline, a methyl group at another C4-positon would be one of the determinant factors for rapid metabolic elimination to form aminotoluic acid. These results suggest that rapid and extensive metabolic activation of aniline and its dimethyl derivatives occurred in rats and that the presence of a methyl group at the C2-positon may generally suppress fast metabolic rates of dimethyl aniline derivatives that promote metabolic activation reactions at NH2 moieties.
INTRODUCTION
Aniline is often used as a chemical intermediate in a variety of chemical processes such as those in the rubber and pesticide industries.1) Aniline has also been detected in indoor/outdoor air and in drinking water treatment plants.2) The general human population is known to be ubiquitously exposed to aniline,3,4) in addition to workers in occupational settings.5,6) The primary toxicity of aniline is characterized by methemoglobinemia.1,7) Aniline is reportedly metabolized to haematotoxic compounds via the metabolic N-hydroxylation of the amino group following conjugations.8) The dimethyl aniline derivative 2,6-dimethylaniline is found in tobacco smoke,7) and a multiplicity of 2,6-dimethylaniline adducts after metabolic activation has been reported.7) There have been several reports on the relationships between the chemical structures of amino aromatics and their biotransformation pathways.1,7,8)
The lowest-observed-effect levels (LOELs) of many haematotoxic compounds are available from the Hazard Evaluation Support System Integrated Platform (HESS).9) We recently reported that the differences in the pharmacokinetics of bromobenzene; 1,2-dibromobenzene; and 1,4-dibromobenzene administered to rats and to humanized-liver mice were related to the positions of the bromo substituents.10) There are only a limited number of reports on the urinary excretion of aniline,3) but the relationship between the positions of the aniline substituents and their oxidative metabolism has not been extensively researched in experimental animals or in humans.
Although the elimination kinetics and urinary excretion levels after a single oral dose (5 mg) of isotope-labelled aniline has been reported in four human volunteers,3) the plasma exposure of aniline was not investigated in terms of toxicokinetics. Physiologically based pharmacokinetic (PBPK) modelling is a broadly accepted method for estimating toxicokinetics.11,12) Simplified PBPK models consisting of chemical receptor, metabolizing, excreting, and central compartments have been developed.13,14) The purpose of the current study was to investigate quantitatively and semi-quantitatively the pharmacokinetics and haematotoxicity of aniline and its dimethyl derivatives after single oral doses of 25 mg/kg to rats. The investigations were carried out using LC–tandem mass spectrometry (LC-MS/MS). We report herein an apparent positive correlation for these chemicals between plasma exposures and the reported lowest effect levels for haematotoxicity.
MATERIALS AND METHODS
In Vivo Metabolic Studies of Aniline and Its DerivativesSprague–Dawley male rats (Charles River Laboratory, Tokyo, Japan) were used in this study. This study was approved by the Institutional Animal Care and Use Committees of Shin Nippon Biomedical Laboratories and Showa Pharmaceutical University. Aniline (CAS No. 62-53-3) and its dimethyl derivatives, 2,3-dimethylaniline (CAS No. 87-59-2); 2,4-dimethylaniline (CAS No. 95-68-1); 2,5-dimethylaniline (CAS No. 95-78-3); 2,6-dimethylaniline (CAS No. 87-62-7); N,2-dimethylaniline (CAS No. 611-21-2); and 3,5-dimethylaniline (CAS No. 108-69-0), as shown in Fig. 1, were obtained from Tokyo Chemical Industry (Tokyo, Japan). Blood samples (100 µL) were collected at times in range 0.083–4.0 h after single oral doses (25 mg/kg) of aniline and these dimethyl derivatives dissolved in corn oil administered by gavage to rats. The dose of 25 mg/kg was selected on the basis of no effect dose of aniline (20 mg/kg)15) and LOEL values6) of dimethyl aniline derivatives (10–300 mg/kg).
In Vitro Permeability Study of Aniline and Its DerivativesThe general procedures employed to prepare in vitro human intestinal Caco-2 monolayers were described previously.16) The permeability coefficients were calculated from the time-dependent in vitro absorption from the apical to basal sides of Caco-2 monolayers.
LC-MS/MS AnalysesPlasma samples or culture media (approx. 20 µL) were deproteinized by adding 40 µL of methanol and centrifuged at 20000 × g for 5 min at 4 °C. To measure the plasma or medium concentrations of aniline and its dimethyl derivatives, supernatant samples (10 µL) were analysed using LC-MS/MS with an octadecylsilane (C18) column (YMC-Triart C18 plus, 3 µm, 2.1 × 50 mm, YMC, Kyoto, Japan). The LC conditions were as follows: solvent A was methanol and solvent B was 10 mM ammonium acetate in water. The following gradient program was used, with a flow rate of 0.30 mL/min: 0–6.5 min, linear gradient from 5% A to 65% A (v/v); 6.51–8.5 min, hold at 100% A; and 8.51–10.5 min, hold at 5% A. The temperature of the column was maintained at 40 °C. Quantitative analyses of aniline and its dimethyl derivatives and their metabolites were performed using authentic standards in this study. The retention times (tR) and m/z values of aniline and its dimethyl derivatives are shown in Fig. 1. Semi-quantitative estimations of the observed primary metabolites of aniline and its dimethyl derivatives were also performed based on the peak area determinations of the LC-MS/MS analyses.
PBPK Modelling for Aniline and Its DerivativesSimplified rat PBPK models consisting of gut, liver, kidney, and central compartments were set up for aniline and its dimethyl derivatives.10,17) The values of the plasma unbound fraction (fu,p), octanol–water partition coefficient (logP), blood-to-plasma concentration ratio (Rb), and the liver-to-plasma or kidney-to-plasma concentration ratio (Kp,h or Kp,r) for aniline and its dimethyl derivatives were calculated using in silico tools (Simcyp and ChemDraw software) as described previously18,19); the results are shown in Table 1. The values used for the hepatic and renal blood flow rates (Qh and Qr) in rats were 0.853 L/h, and hepatic and renal volumes of 8.5 mL (8.5 g) and 3.7 mL (3.7 g), respectively, were used as described previously.10,17) Initial values for the fraction absorbed × intestinal availability (Fa·Fg), the hepatic clearance (CLh), and the renal clearance (CLr) for PBPK modelling were derived from the elimination constants obtained using one-compartment models. The input parameters for the PBPK models shown in Table 2, i.e., the absorption rate constant (ka), the volume of the systemic circulation (V1), and the hepatic intrinsic clearance (CLh,int), were computed using simplex and modified Marquardt methods so that the model results were consistent with the measured plasma substrate concentrations obtained in this study. The general ratios of CLh to CLr were set at 9 : 1.18,19) Fg values were estimated from the gut extraction ratios as one-tenth of the hepatic extraction ratios in the hepatic well-stirred model. The resulting system of differential equations was solved to conduct the modelling of substrate concentrations:
where Xg is the amount of compound in the gut; Vh and Vr are the volumes of the liver and kidney; and Cb, Ch, and Cr are the blood, hepatic, and renal substrate concentrations, respectively.
Table 1. Chemical Properties of Aniline and Its Derivatives Used for PBPK Modelling
| Parameter | Symbol | Aniline | 2,3-Dimethyl-aniline | 2,4-Dimethyl-aniline | 2,5-Dimethyl-aniline | 2,6-Dimethyl-aniline | N,2-Dimethyl-aniline | 3,5-Dimethyl-aniline |
|---|
| Molecular weight | MW | 93 | 121 | 121 | 121 | 121 | 121 | 121 |
| Octanol–water partition coefficient | logP | 0.915 | 1.81 | 1.86 | 1.86 | 1.81 | 2.14 | 1.91 |
| Acid dissociation constant (base) | pKa | 4.67 | 4.76 | 5.00 | 4.75 | 4.17 | 4.93 | 5.06 |
| Plasma unbound fraction | fu,p | 0.539 | 0.317 | 0.306 | 0.306 | 0.317 | 0.249 | 0.296 |
| Blood–plasma concentration ratio | Rb | 0.906 | 0.920 | 0.918 | 0.918 | 0.920 | 0.907 | 0.917 |
| Liver–plasma concentration ratio | Kp,h | 0.709 | 1.20 | 1.25 | 1.25 | 1.20 | 1.61 | 1.31 |
Table 2. Experimental and Calculated Parameters for PBPK Models of Aniline and Its Derivatives
| Parameter | Abbreviation (unit) | Aniline | 2,3-Dimethyl-aniline | 2,4-Dimethyl-aniline | 2,5-Dimethyl-aniline | 2,6-Dimethyl-aniline | N,2-Dimethyl-aniline | 3,5-Dimethyl-aniline |
|---|
| Apparent permeability coefficient | Papp (nm/s) | 544 | 624 | 661 | 597 | 603 | 547 | 674 |
| Fraction absorbed × intestinal availability | Fa·Fg | 0.824 | 0.279 | 0.496 | 0.260 | 0.292 | 0.321 | 0.416 |
| Absorption rate constant | ka (1/h) | 18.8 ± 1.3a) | 11.3 ± 1.3a) | 11.5 ± 0.6a) | 10.8 ± 1.2a) | 7.02 ± 0.20a) | 2.40 ± 0.32a) | 14.3 ± 0.2a) |
| Volume of systemic circulation | V1 (L) | 0.402 ± 0.061a) | 0.579 ± 0.053a) | 0.503 ± 0.044a) | 0.314 ± 0.020a) | 0.367 ± 0.006a) | 0.480 ± 0.062a) | 0.548 ± 0.023a) |
| Hepatic intrinsic clearance | CLh,int (L/h) | 3.43 ± 0.47a) | 0.299 ± 0.045a) | 2.70 ± 0.28a) | 0.110 ± 0.017a) | 0.454 ± 0.008a) | 0.952 ± 0.119a) | 1.88 ± 0.10a) |
| Hepatic clearance | CLh (L/h) | 0.584 | 0.0852 | 0.420 | 0.0323 | 0.123 | 0.185 | 0.336 |
| Renal clearance | CLr (L/h) | 0.063 | 0.0089 | 0.045 | 0.0033 | 0.013 | 0.019 | 0.036 |
| Estimated values | | | | | | | | |
| Cmax in plasma | ng/mL | 3200 (1.24)b) | 2680 (1.02)b) | 2570 (0.95)b) | 4870 (1.00)b) | 3740 (0.96)b) | 2360 (1.39)b) | 2540 (1.10)b) |
| AUC0-4 in plasma | ng h/mL | 2570 (1.31)b) | 8170 (0.91)b) | 3490 (1.03)b) | 16000 (0.93)b) | 9100 (1.00)b) | 6270 (1.43)b) | 4150 (1.12)b) |
| Observed levels | | | | | | | | |
| Cmax in plasma | ng/mL | 2580 | 2630 | 2720 | 4890 | 3910 | 1700 | 2310 |
| AUC0-4 in plasma | ng h/mL | 1960 | 9000 | 3380 | 17300 | 9080 | 4380 | 3710 |
a) Data are means ± standard deviations by fitting to measured concentrations. b) Values in parentheses are ratios to the reported/observed values. AUC0-4, area under the concentration curve from 0 to 4 h.
RESULTS
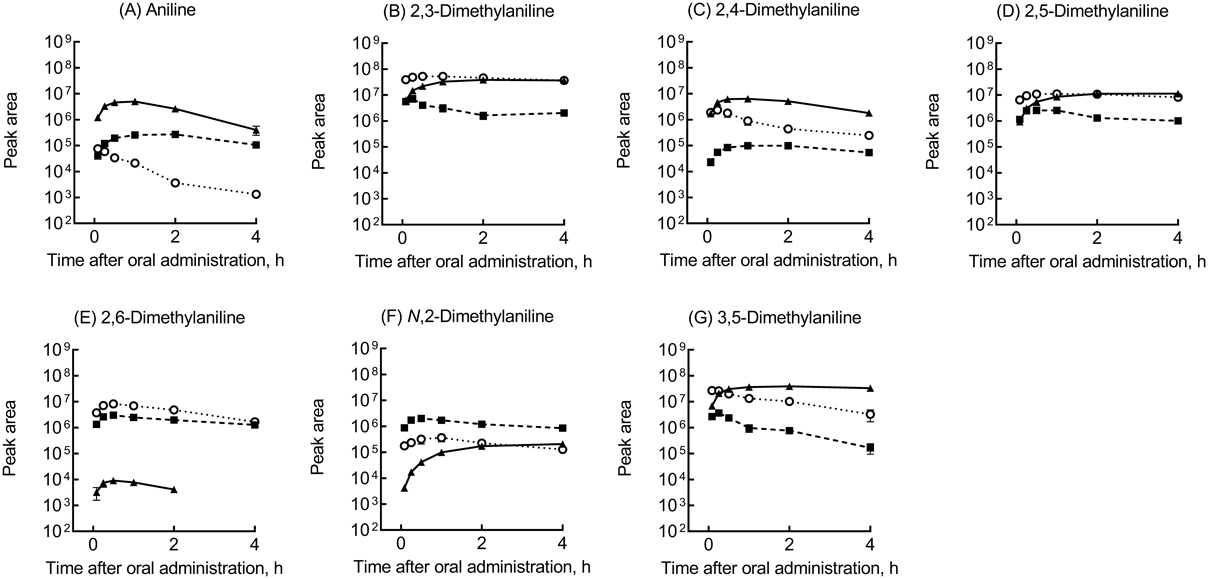
The apparent in vitro Caco-2 permeability values of aniline and its dimethyl derivatives were in the range 544–674 nm/s (Table 2), suggesting similar chemical absorbance rates after oral administration of aniline and its dimethyl derivatives. The plasma concentrations of aniline and its dimethyl derivatives were measured and compared after single oral doses of 25 mg/kg administered in rats (Fig. 2). After oral administrations of aniline and its dimethyl derivatives in rats in vivo, the pharmacokinetics of aniline and its dimethyl derivatives and their primary metabolites were quantitatively determined and semi-quantitatively estimated using LC-MS/MS analyses. Under the present conditions, the apparent elimination rates of aniline (Fig. 2A); 2,4-dimethylaniline (Fig. 2C); and 3,5-dimethylaniline (Fig. 2G) in terms of their plasma concentrations were generally rapid in rats compared with those of 2,3- (Fig. 2B); 2,5- (Fig. 2D); 2,6- (Fig. 2E); and N,2-dimethylaniline (Fig. 2F).
Virtual plasma concentration curves of aniline and its dimethyl derivatives were generated by PBPK modelling for rats using the physical properties of these substrates (Table 1) and experimentally determined values (Table 2). The resulting in silico concentration curves of aniline and its dimethyl derivatives are also shown in Fig. 2, along with the experimentally determined data. Because the values in rat plasma of Cmax and the area under the concentration curve from 0–4 h after administrations (AUC0-4) of aniline and its dimethyl derivatives extrapolated using the rat PBPK models (Table 2) were consistent (within roughly 1.5-fold) with the experimentally observed mean values in rats (Fig. 2), the current PBPK models were considered to reasonably reflect the observed in vivo plasma data.
Semi-quantitatively estimations of the observed primary metabolites of aniline and its dimethyl derivatives were also performed using peak area-based determinations of the LC-MS/MS data. The primary metabolites of aniline and its dimethyl derivatives were shown in this study to be acetylated metabolites and oxidative metabolites (Fig. 1), after determinations of the sulphate forms of the oxidative metabolites (except for aminophenol from aniline and aminotoluic acid from 2,4-dimethylaniline). The observed peak areas of the acetylated forms of 2,4- and 3,5-dimethylaniline metabolites were higher than those of their substrates (Figs. 3C, G), just as they were for aniline (Fig. 3A). However, the peak areas of the acetylated metabolites of 2,3- and 2,5-dimethylaniline were similar to those of their substrates (Figs. 3B, D). In contrast, the peak areas of the acetylated metabolites of 2,6-, and N,2-dimethylaniline were the lowest among the aniline dimethyl derivatives tested (Figs. 3E, F).
DISCUSSION
Aniline and its dimethyl derivatives are reportedly metabolized to haematotoxic compounds after N-hydroxylation of their amino groups.7,8) In the current study, the pharmacokinetics of aniline and its dimethyl derivatives and their primary metabolites after single oral doses of 25 mg/kg in rats were quantitatively and semi-quantitatively investigated using LC-MS/MS systems. The plasma concentrations of aniline; 2,4-dimethylaniline; and 3,5-dimethylaniline indicated higher clearance rates in rats than those of 2,3-; 2,5-; 2,6-; and N,2-dimethylaniline (Fig. 2), all of which have a methyl group at the C2-positon (Fig. 1). Moreover, the primary acetylated metabolites of 2,4- and 3,5-dimethylaniline semi-quantitatively estimated from their peak areas in LC analyses were more extensively formed than those of 2,3-; 2,5-; 2,6-; and N,2-dimethylaniline (Fig. 3). It should be noted that 2,4-dimethylaniline was also converted to 2,4-dimetylaminophenols, including aminotoluic acid (Fig. 1C). In the case of 2,4-dimethylaniline, a methyl group at another C4-positon would be one of the determinant factors for rapid metabolic elimination to form aminotoluic acid. These results suggest that the amounts produced of the primary metabolites of dimethyl derivatives may differ depending on the positions of the methyl substituents.
Virtual plasma concentration curves of unmetabolized aniline and its dimethyl derivatives (Fig. 2) were generated for rats using PBPK models based on the physical properties shown in Table 1 and the experimentally determined values shown in Table 2. It should be noted that the hepatic intrinsic clearances of 2,3-; 2,5-; 2,6-; and N,2-dimethylaniline (0.299, 0.110, 0.454, and 0.952 L/h, respectively) in rats were lower than those of aniline; 2,4-dimethylaniline; and 3,5-dimethylaniline (3.43, 2.70, and 1.88 L/h). It should be also noted that the presence of a methyl group at the C2-position may be partly responsible for the different metabolic rates and hepatic intrinsic clearances of aniline and its dimethyl derivatives. Although the availability of LOELs for haematoxicity of the relevant compounds from the HESS database was limited,9) the LOEL values of dimethyl anilines and the AUC values estimated using PBPK modelling were apparently positively correlated (Fig. 4). In this context, the lower AUC values of unmetabolized dimethylaniline derivatives (resulting from their extensive metabolic clearances) were reflected by their lower reported LOELs for haematotoxicity. In our preliminary analyses, the virtual hepatic and renal AUC0-4 values estimated using the rat PBPK models and the experimentally determined rat plasma AUC0-4 values for these five dimethylaniline derivatives were not correlated with the reported LOELs for haematoxicity (data not shown). In this study, because the N-hydroxylated metabolites of aniline and its dimethyl derivatives could not be detected in LC-MS/MS analyses, presumably because of unstable forms,7,8) the detectable N-acetylated metabolites were alternatively used as proxy metabolites of the NH2 groups (Fig. 4B). These results suggested that the slow clearances of 2,3-; 2,5-; 2,6-; and N,2-dimethylaniline from rat plasma reflects their apparent limited metabolic activation. These findings notwithstanding, a multiplicity of activated adducts of 2,6-dimethylaniline has been reported.7) In contrast, 2,4- and 3,5-dimethylaniline would be extensively activated via fast N-hydroxylation of their amino groups resulting in possible haematotoxicity (Fig. 4).
In conclusion, the amounts of unmetabolized (remaining) dimethylaniline derivatives indicated by simplified physiologically based pharmacokinetic models (set up based on experimental plasma concentrations) showed an apparently positive relationship with the reported LOELs for haematotoxicity. These results suggest that rapid and extensive metabolic activation of aniline and its dimethyl derivatives occurred in rats, and that the presence of a methyl group at the C2-positon (except for the case of 2,4-dimethylaniline) may suppress the fast metabolic rates of dimethyl aniline derivatives that are involved in the metabolic activation reactions at NH2 moieties. The application of simple PBPK models and plasma data from rats has potential for predicting and evaluating the pharmacokinetic and haematotoxic differences of aniline and its dimethyl derivatives.
Acknowledgments
The authors thank Drs. Fumiaki Shono, Masato Kitajima, and Akiko Toda for their assistance and David Smallbones for copyediting a draft of this article. This work was supported in part by the METI Artificial Intelligence-based Substance Hazard Integrated Prediction System Project, Japan. T.M. was partly supported by the Japan Society for the Promotion of Science Grant-in-Aid for Young Scientists 202021210.
Conflict of Interest
The authors declare no conflict of interest.
REFERENCES
- 1) Pauluhn J. Subacute inhalation toxicity of aniline in rats: analysis of time-dependence and concentration-dependence of hematotoxic and splenic effects. Toxicol. Sci., 81, 198–215 (2004).
- 2) Palmiotto G, Pieraccini G, Moneti G, Dolara P. Determination of the levels of aromatic amines in indoor and outdoor air in Italy. Chemosphere, 43, 355–361 (2001).
- 3) Modick H, Weiss T, Dierkes G, Koslitz S, Kafferlein HU, Bruning T, Koch HM. Human metabolism and excretion kinetics of aniline after a single oral dose. Arch. Toxicol., 90, 1325–1333 (2016).
- 4) Korinth G, Weiss T, Penkert S, Schaller KH, Angerer J, Drexler H. Percutaneous absorption of aromatic amines in rubber industry workers: impact of impaired skin and skin barrier creams. Occup. Environ. Med., 64, 366–372 (2007).
- 5) el-Bayoumy K, Donahue JM, Hecht SS, Hoffmann D. Identification and quantitative determination of aniline and toluidines in human urine. Cancer Res., 46, 6064–6067 (1986).
- 6) Riffelmann M, Muller G, Schmieding W, Popp W, Norpoth K. Biomonitoring of urinary aromatic amines and arylamine hemoglobin adducts in exposed workers and nonexposed control persons. Int. Arch. Occup. Environ. Health, 68, 36–43 (1996).
- 7) Gonçalves LL, Beland FA, Marques MM. Synthesis, characterization, and comparative 32P-postlabeling efficiencies of 2,6-dimethylaniline-DNA adducts. Chem. Res. Toxicol., 14, 165–174 (2001).
- 8) Lewalter J, Korallus U. Blood protein conjugates and acetylation of aromatic amines. New findings on biological monitoring. Int. Arch. Occup. Environ. Health, 56, 179–196 (1985).
- 9) Sakuratani Y, Zhang HQ, Nishikawa S, Yamazaki K, Yamada T, Yamada J, Gerova K, Chankov G, Mekenyan O, Hayashi M. Hazard Evaluation Support System (HESS) for predicting repeated dose toxicity using toxicological categories. SAR QSAR Environ. Res., 24, 351–363 (2013).
- 10) Miura T, Shimizu M, Uehara S, Yoshizawa M, Nakano A, Yanagi M, Kamiya Y, Murayama N, Suemizu H, Yamazaki H. Different hepatic concentrations of bromobenzene, 1,2-dibromobenzene, and 1,4-dibromobenzene in humanized-liver mice predicted using simplified physiologically based pharmacokinetic models as putative markers of toxicological potential. Chem. Res. Toxicol., 33, 3048–3053 (2020).
- 11) Wambaugh JF, Hughes MF, Ring CL, MacMillan DK, Ford J, Fennell TR, Black SR, Snyder RW, Sipes NS, Wetmore BA, Westerhout J, Setzer RW, Pearce RG, Simmons JE, Thomas RS. Evaluating in vitro-in vivo extrapolation of toxicokinetics. Toxicol. Sci., 163, 152–169 (2018).
- 12) Sayre RR, Wambaugh JF, Grulke CM. Database of pharmacokinetic time-series data and parameters for 144 environmental chemicals. Sci. Data, 7, 122 (2020).
- 13) Miura T, Uehara S, Shigeta K, Yoshizawa M, Kamiya Y, Murayama N, Shimizu M, Suemizu H, Yamazaki H. Metabolic profiles of tetrabromobisphenol a in humans extrapolated from humanized-liver mouse data using a simplified physiologically based pharmacokinetic model. Chem. Res. Toxicol., 34, 522–528 (2021).
- 14) Miura T, Kamiya Y, Uehara S, Murayama N, Shimizu M, Suemizu H, Yamazaki H. Hepatotoxicological potential of P-toluic acid in humanised-liver mice investigated using simplified physiologically based pharmacokinetic models. Xenobiotica, 51, 636–642 (2021).
- 15) Jenkins FP, Robinson JA, Gellatly JB, Salmond GW. The no-effect dose of aniline in human subjects and a comparison of aniline toxicity in man and the rat. Food Cosmet. Toxicol., 10, 671–679 (1972).
- 16) Kamiya Y, Takaku H, Yamada R, Akase C, Abe Y, Sekiguchi Y, Murayama N, Shimizu M, Kitajima M, Shono F, Funatsu K, Yamazaki H. Determination and prediction of permeability across intestinal epithelial cell monolayer of a diverse range of industrial chemicals/drugs for estimation of oral absorption as a putative marker of hepatotoxicity. Toxicol. Rep., 7, 149–154 (2020).
- 17) Miura T, Uehara S, Mizuno S, Yoshizawa M, Murayama N, Kamiya Y, Shimizu M, Suemizu H, Yamazaki H. Steady-state human pharmacokinetics of monobutyl phthalate predicted by physiologically based pharmacokinetic modeling using single-dose data from humanized-liver mice orally administered with dibutyl phthalate. Chem. Res. Toxicol., 32, 333–340 (2019).
- 18) Kamiya Y, Otsuka S, Miura T, Takaku H, Yamada R, Nakazato M, Nakamura H, Mizuno S, Shono F, Funatsu K, Yamazaki H. Plasma and hepatic concentrations of chemicals after virtual oral administrations extrapolated using rat plasma data and simple physiologically based pharmacokinetic models. Chem. Res. Toxicol., 32, 211–218 (2019).
- 19) Kamiya Y, Otsuka S, Miura T, Yoshizawa M, Nakano A, Iwasaki M, Kobayashi Y, Shimizu M, Kitajima M, Shono F, Funatsu K, Yamazaki H. Physiologically based pharmacokinetic models predicting renal and hepatic concentrations of industrial chemicals after virtual oral doses in rats. Chem. Res. Toxicol., 33, 1736–1751 (2020).