Abstract
Background:
The effect of diabetes mellitus (DM) status on the long-term risk for heart failure (HF) in patients undergoing coronary revascularization has not been adequately evaluated.
Methods and Results:
In this study, 15,231 patients who underwent coronary revascularization in the CREDO-Kyoto Registry Cohort-2 were divided into 2 groups according to DM status (DM group: n=5,999; Non-DM group: n=9,232). The DM group was further divided into 2 groups according to insulin treatment (insulin-treated DM [ITDM]: n=1,353; non-insulin-treated DM [NITDM]: n=4,646). The primary outcome measure was HF hospitalization. The cumulative 5-year incidence of HF hospitalization was significantly higher in the DM than non-DM group (11.0% vs. 6.6%, respectively; log-rank P<0.0001), and in the ITDM than NITDM group (14.6% vs. 10.0%, respectively; log-rank P<0.0001). After adjusting for confounders, the increased risk of HF hospitalization with DM relative to non-DM remained significant (hazard ratio [HR] 1.47, 95% confidence interval [CI] 1.30–1.67, P<0.0001), whereas the risk associated with ITDM relative to NITDM was not significant (HR 1.17, 95% CI 0.96–1.43, P=0.12).
Conclusions:
The adjusted long-term risk for HF hospitalization after coronary revascularization was significantly higher in DM than non-DM patients, regardless of revascularization strategy, but did not differ between ITDM and NITDM patients.
Diabetes mellitus (DM), a chronic disease affecting a large number of people worldwide, is a major risk factor for cardiovascular disease, and so the management of DM remains an issue of interest.1–4
Recently, 3 large-scale clinical trials reported cardiovascular benefit of sodium glucose cotransporter 2 (SGLT2) inhibitors in DM patients.5–7
In these trials, the risk for heart failure (HF) was significantly lower in the group treated with SGLT-2 inhibitors than in the control group. Preventing HF in DM patients may reduce the cardiovascular mortality in this group. However, the association between DM and the risk of developing HF among patients with coronary artery disease (CAD) has not been adequately evaluated as yet, although the prevalence of DM is high in CAD patients.
Editorial p 382
Therefore, the aim of this study was to evaluate the effect of DM status on the long-term risk for HF in patients who underwent coronary revascularization in a large-scale Japanese multicenter registry.
Methods
Study Population
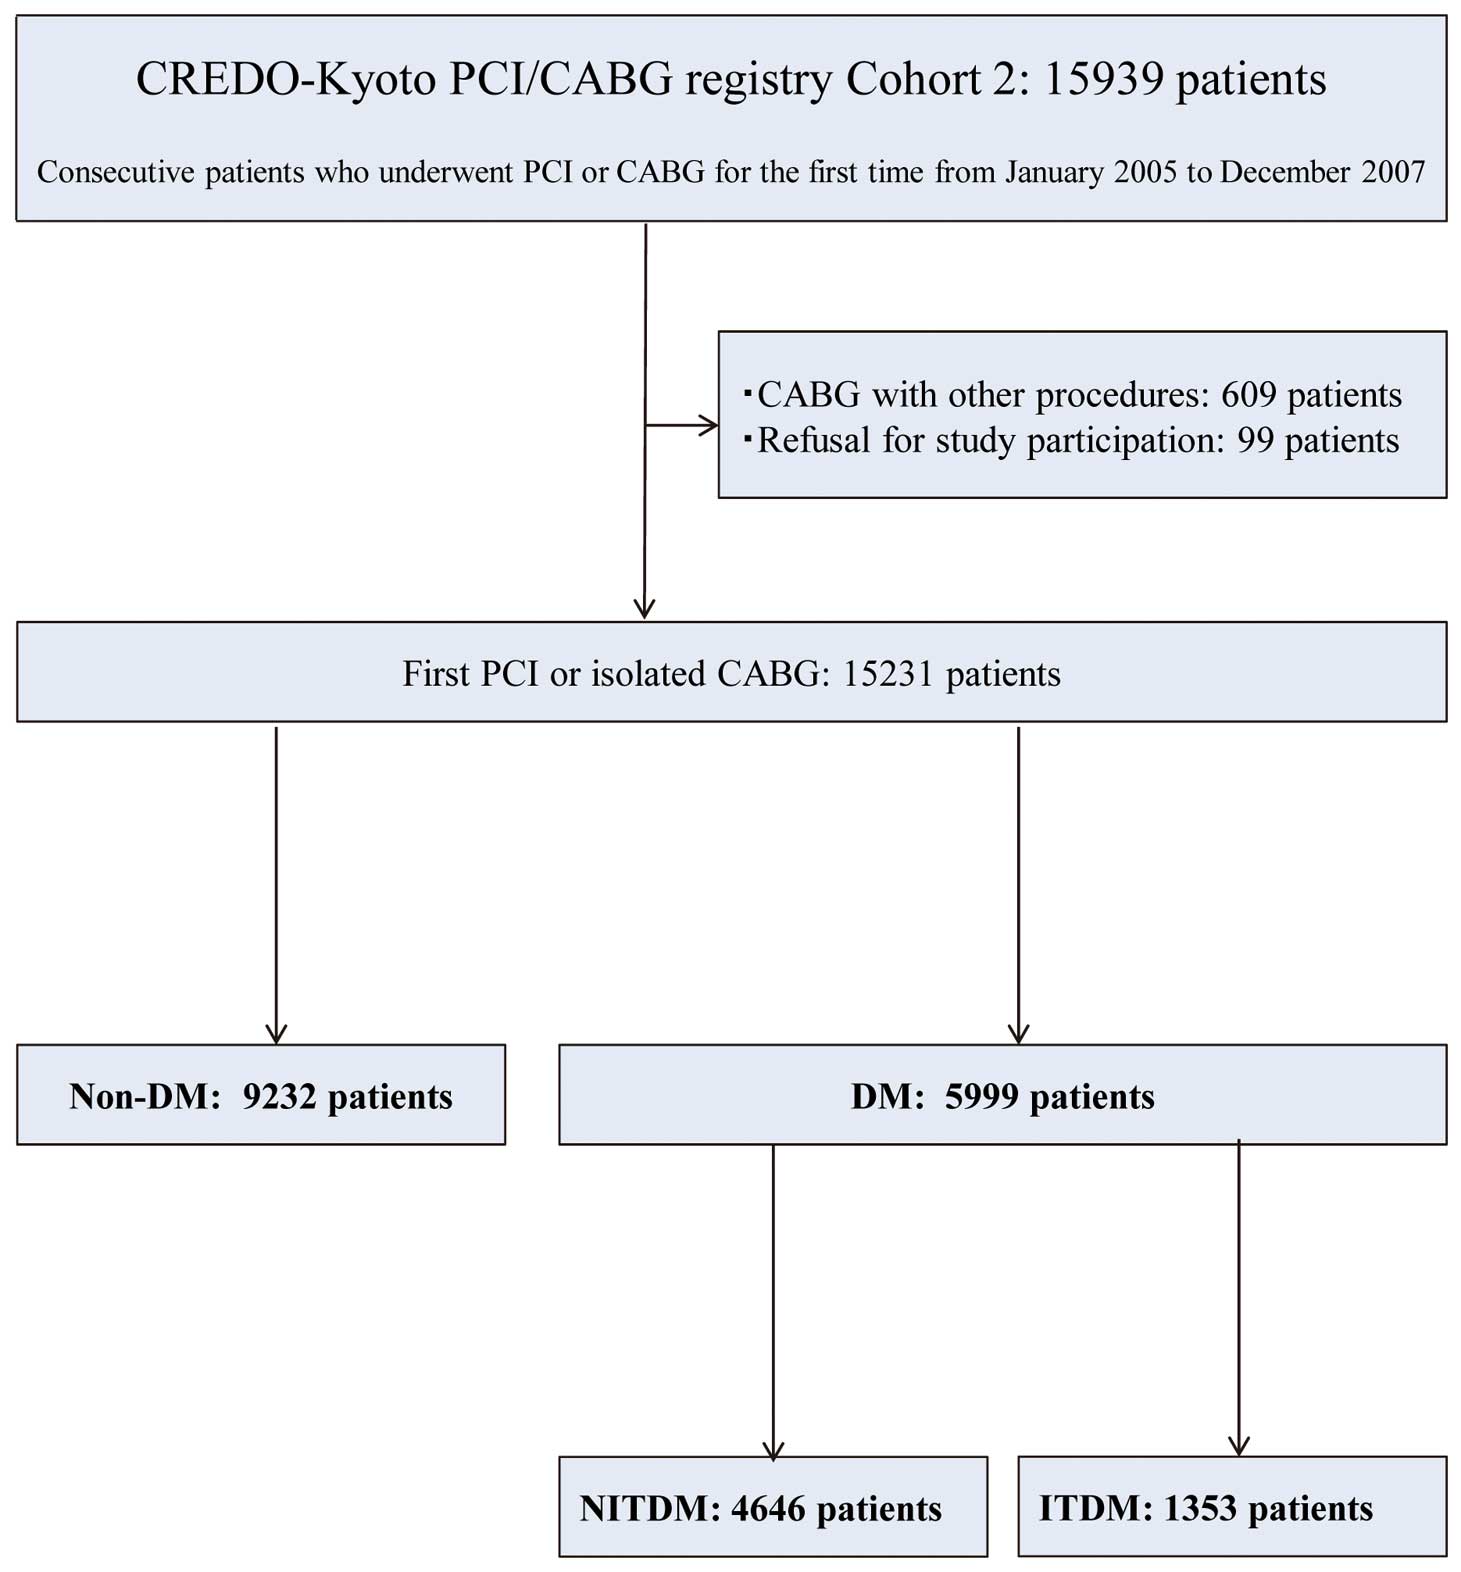
The Coronary REvascularization Demonstrating Outcome study in Kyoto (CREDO-Kyoto) percutaneous coronary intervention (PCI)/coronary artery bypass grafting (CABG) Registry Cohort-2 was a physician-initiated multicenter registry that enrolled consecutive patients who underwent their first coronary revascularization between January 2005 and December 2007.8,9
In all, 15,939 patients were enrolled from 26 centers in Japan (Supplementary Appendix 1). The research protocol was approved by the ethics committees in all participating centers. Because of retrospective enrollment, written informed consent from patients was waived; however, patients who declined to take part in the study when contacted for follow-up were excluded. This strategy is concordant with the guidelines of the Japanese Ministry of Health, Labor and Welfare.
In the present study we sought to explore the long-term risk of HF according to DM status. DM was defined as a fasting plasma glucose concentration ≥126 mg/dL, glucose concentration ≥200 mg/dL 2 h after a 75-g oral glucose tolerance test, a random plasma glucose concentration ≥200 mg/dL, or the patient taking antidiabetic medications at baseline. Insulin-treated DM (ITDM) was defined as DM with insulin therapy, whereas non-insulin-treated DM (NITDM) was defined as DM without insulin therapy at baseline. After excluding 609 CABG patients with concomitant non-coronary surgery and 99 patients who declined to take part in the study, the final study population for this analysis consisted of 15,231 patients (DM group: n=5,999; Non-DM group: n=9,232). The 5,999 DM patients were further divided into 1,353 ITDM patients and 4,646 NITDM patients (Figure 1).
Data Collection
Experienced clinical research coordinators from the independent clinical research organization (Research Institute for Production Development, Kyoto, Japan;
Supplementary Appendix 2) collected baseline clinical, angiographic and procedural characteristics from hospital charts or hospital databases according to prespecified definitions. Follow-up information was primarily collected through review of hospital charts by the clinical research coordinators; although additional follow-up information (e.g., vital status, subsequent hospitalizations, and status of antiplatelet therapy) was collected from patients, relatives, and/or referring physicians, who were contacted by mail. Death, myocardial infarction (MI), and stroke were adjudicated by the clinical event committee (Supplementary Appendix 3).
Clinical Outcome Measures and Definitions
The primary outcome measure in this study was HF hospitalization during follow-up. Secondary outcome measures were all-cause death, cardiac death, MI, and stroke. HF hospitalization was defined as hospitalization for worsening HF requiring intravenous drug therapy. Death was regarded as cardiac in origin unless obvious non-cardiac causes could be identified. Any death during the index hospitalization for coronary revascularization was regarded as cardiac death. The definition of MI was according to the Arterial Revascularization Therapy Study.10
Stroke was defined as ischemic or hemorrhagic stroke with lasting symptoms over 24 h during the index hospitalization or requiring hospitalization.8
Statistical Analysis
Continuous variables are expressed as the mean±SD or median with interquartile range (IQR). Continuous variables were compared using the Student’s t-test or Wilcoxon rank sum test based on their distribution. Categorical variables are expressed as frequencies and percentages and were compared using χ2
tests. Cumulative incidence was estimated by the Kaplan-Meier method, and differences were assessed with the log-rank test. The adjusted risks of DM vs. non-DM and ITDM vs. NITDM for the primary and secondary outcome measures were estimated using multivariable Cox proportional hazard models by incorporating the variables DM or ITDM together with 31 risk-adjusting variables listed in
Tables 1
and
2. Continuous risk-adjusting variables were dichotomized according to clinically meaningful reference values. The results are expressed as adjusted hazard ratios (HRs) and 95% confidence intervals (CIs). A subgroup analysis was conducted for the primary outcome measure according to the revascuralization strategies (PCI: n=13,058; CABG: n=2,173). In addition, we evaluated the interaction between the revascuralization strategies and the effect of DM status on HF hospitalization.
Table 1.
Baseline Characteristics of DM and Non-DM Patients
| |
DM |
Non-DM |
P-value |
| No. patients |
5,999 |
9,232 |
|
| Clinical characteristics |
| PCI |
4,901 (82) |
8,157 (88) |
<0.0001 |
| CABG |
1,098 (18) |
1,075 (12) |
<0.0001 |
| Age (years) |
67.6±10.1 |
68.7±11.3 |
<0.0001 |
| Age ≥75 years* |
1,558 (26) |
3,141 (34) |
<0.0001 |
| Male sex* |
4,279 (71) |
6,730 (73) |
0.03 |
| BMI (kg/m2) |
24.1±3.6 |
23.4±3.4 |
<0.0001 |
| BMI <25.0 kg/m2* |
3,907 (65) |
6,586 (71) |
<0.0001 |
| Hypertension* |
5,055 (84) |
7,457 (81) |
<0.0001 |
| Current smoker* |
1,776 (30) |
2,933 (32) |
0.005 |
| HF* |
1,458 (24) |
1,676 (18) |
<0.0001 |
| EF ≤40%* |
662 (13) |
757 (9.8) |
<0.0001 |
| Mitral regurgitation grade 3/4* |
224 (3.7) |
367 (4.0) |
0.45 |
| Acute myocardial infarction* |
1,632 (27) |
3,260 (35) |
<0.0001 |
| Prior myocardial infarction* |
839 (14) |
978 (11) |
<0.0001 |
| Prior symptomatic stroke* |
773 (13) |
915 (9.9) |
<0.0001 |
| Peripheral vascular disease* |
517 (8.6) |
708 (7.7) |
0.04 |
| eGFR <30 mL/min/1.73 m2, without hemodialysis* |
366 (6.1) |
316 (3.4) |
<0.0001 |
| Hemodialysis* |
363 (6.1) |
237 (2.6) |
<0.0001 |
| HbA1c |
|
|
<0.0001 |
| Mean±SD (%) |
7.3±1.54 |
5.3±0.42 |
|
| No. patients |
4,895/5,999 |
5,621/9,232 |
|
| Anemia (hemoglobin <11.0 g/dL)* |
939 (16) |
988 (11) |
<0.0001 |
| Thrombocytopenia (platelets <100,000/μL)* |
111 (1.9) |
136 (1.5) |
0.07 |
| Chronic obstructive pulmonary disease* |
177 (3.0) |
352 (3.8) |
0.004 |
| Liver cirrhosis* |
190 (3.2) |
214 (2.3) |
0.002 |
| Malignancy* |
573 (9.6) |
829 (9.0) |
0.23 |
| Procedural characteristics |
| No. target lesions or anastomoses |
1.86±1.11 |
1.62±0.94 |
<0.0001 |
| Target of proximal LAD* |
3,876 (65) |
5,483 (59) |
<0.0001 |
| Target of chronic total occlusion* |
1,074 (18) |
1,327 (14) |
<0.0001 |
| Medication at hospital discharge |
| Antiplatelet therapy |
| Thienopyridines |
4,881 (81) |
8,010 (87) |
<0.0001 |
| Ticlopidine |
4,417 (74) |
7,216 (78) |
<0.0001 |
| Clopidogrel |
454 (7.6) |
773 (8.4) |
0.07 |
| Aspirin |
5,918 (99) |
9,081 (98) |
0.16 |
| Cilostazol* |
1,005 (17) |
1,673 (18) |
0.03 |
| Other medications |
| Statins* |
2,900 (48) |
4,430 (48) |
0.67 |
| β-blockers* |
1,771 (30) |
2,753 (30) |
0.69 |
| ACEi/ARB* |
3,356 (56) |
4,925 (53) |
0.002 |
| Nitrates* |
2,140 (36) |
3,252 (35) |
0.57 |
| Calcium channel blockers* |
2,622 (44) |
3,706 (40) |
<0.0001 |
| Nicorandil* |
1,676 (28) |
2,315 (25) |
<0.0001 |
| Warfarin* |
793 (13) |
1,084 (12) |
0.007 |
| Proton pump inhibitors* |
1,785 (30) |
2,459 (26) |
<0.0001 |
| H2 blockers* |
1,554 (26) |
2,567 (28) |
0.01 |
| Diuretics |
1,550 (26) |
1,672 (18) |
<0.0001 |
| MRA |
692 (12) |
753 (8.2) |
<0.0001 |
| OHAs |
2,940 (49) |
– |
– |
| α-GI |
1,368 (23) |
– |
– |
| Sulfonylurea |
2,085 (35) |
– |
– |
| Biguanide |
411 (6.9) |
– |
– |
| Pioglitazone |
492 (8.2) |
– |
– |
Data are presented as mean±SD or n (%). HF was regarded as present when it was recorded in the hospital charts. *Risk-adjusting variables used in Cox proportional hazard models. ACEi/ARB, angiotensin-converting enzyme inhibitor/angiotensin receptor blocker; BMI, body mass index; CABG, coronary artery bypass grafting; DM, diabetes mellitus; EF, ejection fraction; eGFR, estimated glomerular filtration rate; HF, heart failure; H2, histamine H2
receptor; LAD, left anterior descending coronary artery; MRA, mineralocorticoid receptor antagonists; OHAs, oral hypoglycemic agents; PCI, percutaneous coronary intervention; α-GI, α-glucosidase inhibitor.
Table 2.
Baseline Characteristics of ITDM and NITDM DM Patients
| |
ITDM |
NITDM |
P-value |
| No. patients |
1,353 |
4,646 |
|
| Clinical characteristics |
| PCI |
993 (73) |
3,908 (84) |
<0.0001 |
| CABG |
360 (27) |
738 (16) |
<0.0001 |
| Age (years) |
67.0±9.6 |
67.7±10.2 |
0.02 |
| Age ≥75 years* |
306 (23) |
1,252 (27) |
0.001 |
| Men* |
874 (65) |
3,405 (73) |
<0.0001 |
| BMI (kg/m2) |
23.7±3.6 |
24.2±3.5 |
0.0002 |
| BMI <25.0 kg/m2* |
930 (69) |
2,977 (64) |
0.001 |
| Hypertension* |
1,127 (83) |
3,928 (85) |
0.27 |
| Current smoker* |
335 (25) |
1,441 (31) |
<0.0001 |
| HF* |
416 (31) |
1,042 (22) |
<0.0001 |
| EF ≤40%* |
186 (16) |
476 (12) |
0.001 |
| Mitral regurgitation grade 3/4* |
43 (3.2) |
181 (3.9) |
0.21 |
| Acute myocardial infarction* |
228 (17) |
1,404 (30) |
<0.0001 |
| Prior myocardial infarction* |
234 (17) |
605 (13) |
<0.0001 |
| Prior symptomatic stroke* |
207 (15) |
566 (12) |
0.003 |
| Peripheral vascular disease* |
152 (11) |
365 (7.9) |
0.0002 |
| eGFR <30 mL/min/1.73 m2, without hemodialysis* |
151 (11) |
215 (4.6) |
<0.0001 |
| Hemodialysis* |
177 (13) |
186 (4.0) |
<0.0001 |
| HbA1c |
|
|
<0.0001 |
| Mean±SD (%) |
7.8±1.8 |
7.1±1.4 |
|
| No. patients |
1,119/1,353 |
3,776/4,646 |
|
| Anemia (hemoglobin <11.0 g/dL)* |
357 (26) |
582 (13) |
<0.0001 |
| Thrombocytopenia (platelets <100,000/μL)* |
31 (2.2) |
80 (1.7) |
0.18 |
| Chronic obstructive pulmonary disease* |
38 (2.8) |
139 (3.0) |
0.72 |
| Liver cirrhosis* |
55 (4.1) |
135 (2.9) |
0.04 |
| Malignancy* |
141 (10) |
432 (9.3) |
0.22 |
| Procedural characteristics |
| No. target lesions or anastomoses |
2.1±1.2 |
1.8±1.1 |
<0.0001 |
| Target of proximal LAD* |
925 (68) |
2,951 (64) |
0.001 |
| Target of chronic total occlusion* |
284 (21) |
790 (17) |
0.0009 |
| Medication at hospital discharge |
| Antiplatelet therapy |
| Thienopyridines |
998 (74) |
3,883 (84) |
<0.0001 |
| Ticlopidine |
909 (67) |
3,508 (76) |
<0.0001 |
| Clopidogrel |
87 (6.4) |
367 (7.9) |
0.07 |
| Aspirin |
1,332 (98) |
4,586 (99) |
0.47 |
| Cilostazol* |
183 (14) |
822 (18) |
0.0002 |
| Other medications |
| Statins* |
583 (43) |
2,317 (50) |
<0.0001 |
| β-blockers* |
366 (27) |
1,405 (30) |
0.02 |
| ACEi/ARB* |
732 (54) |
2,624 (56) |
0.12 |
| Nitrates* |
505 (37) |
1,635 (35) |
0.15 |
| Calcium channel blockers* |
628 (46) |
1,994 (43) |
0.02 |
| Nicorandil* |
407 (30) |
1,269 (27) |
0.047 |
| Warfarin* |
217 (16) |
576 (12) |
0.0006 |
| Proton pump inhibitors* |
473 (35) |
1,312 (28) |
<0.0001 |
| H2 blockers* |
323 (24) |
1,231 (27) |
0.051 |
| Diuretics |
459 (34) |
1,091 (23) |
<0.0001 |
| MRA |
188 (14) |
504 (11) |
0.003 |
| OHAs |
359 (27) |
2,581 (56) |
<0.0001 |
| α-GI |
217 (16) |
1,151 (25) |
<0.0001 |
| Sulfonylurea |
141 (10) |
1,944 (42) |
<0.0001 |
| Biguanide |
64 (4.7) |
347 (7.5) |
0.0003 |
| Pioglitazone |
45 (3.3) |
447 (9.6) |
<0.0001 |
Data are presented as mean±SD or n (%). HF was regarded as present when it was recorded in the hospital charts. *Risk-adjusting variables used in Cox proportional hazard models. ITDM, insulin-treated DM; NITDM, non-insulin-treated DM. Other abbreviations as in Table 1.
All analyses were performed using JMP12.0.1 (SAS Institute, Cary, NC, USA). All reported P-values are 2-tailed, and P<0.05 was considered significant.
Results
Clinical Characteristics: DM vs. Non-DM
Compared with the non-DM group, patients in the DM group were younger, more frequently women, and more often had prior HF, ejection fraction (EF) ≤40%, prior MI, and end-stage renal failure (Table 1). More patients in the DM than non-DM group underwent CABG as the coronary revasucularization procedure. With regard to procedural characteristics, DM patients had more target lesions, and more often had target lesions of the proximal left anterior descending coronary artery or chronic total occlusion than non-DM patients (Table 1). Similar differences between DM and non-DM groups were observed in the PCI and CABG subgroups (Supplementary Table 1).
Clinical Outcomes: DM vs. Non-DM
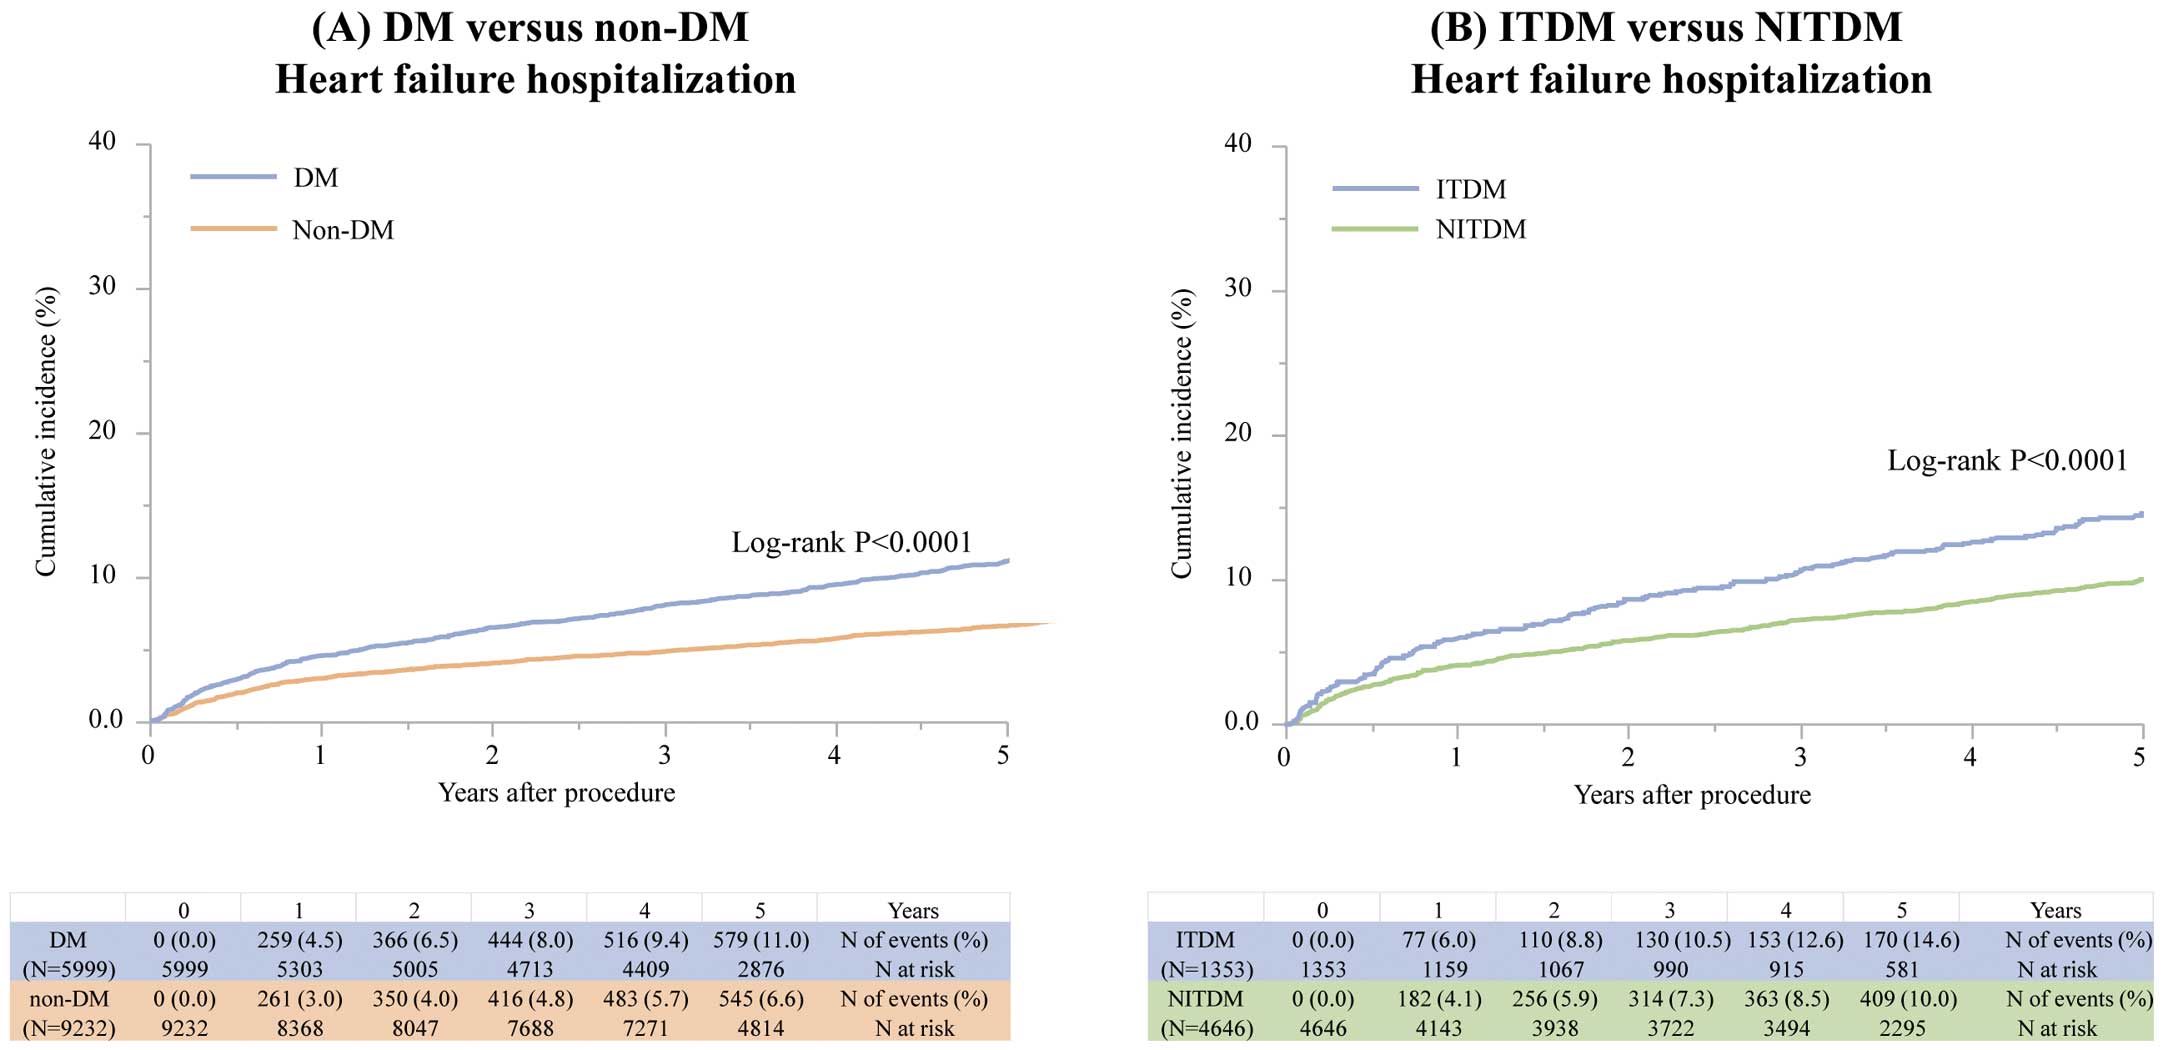
The cumulative 5-year incidence of HF hospitalization was 11.0% and 6.6% in the DM and non-DM groups, respectively (log-rank P<0.0001;
Table 3; Figure 2A). After adjusting for confounders, the excess risk of the DM group relative to the non-DM group for HF hospitalization remained statistically significant (HR 1.47, 95% CI 1.30–1.67, P<0.0001;
Table 3). In both the PCI and CABG subgroups, the excess risk of the DM group relative to the non-DM group for HF hospitalization was also significant (HR 1.44 [95% CI 1.25–1.66; P<0.0001] and HR 1.74 [95% CI 1.25–2.41; P=0.0009], respectively) without interaction (Interaction P=0.37;
Table 3).
Table 3.
Clinical Outcomes in DM and Non-DM Patients
| Endpoint |
No. patients (%) with event
(cumulative 5-year incidence) |
Absolute
difference
(%; 95% CI) |
HR (95% CI) |
Interaction P |
| DM |
Non-DM |
Crude |
P-value |
Adjusted |
P-value |
| HF hospitalization |
| Entire cohort |
625
(11.0) |
598
(6.6) |
4.38
(3.37~5.49) |
1.67
(1.49~1.87) |
<0.0001 |
1.47
(1.30~1.67) |
<0.0001 |
– |
| PCI |
495
(10.6) |
533
(6.7) |
3.95
(2.86~5.05) |
1.60
(1.42~1.81) |
<0.0001 |
1.44
(1.25~1.66) |
<0.0001 |
0.37 |
| CABG |
130
(12.5) |
65
(5.9) |
6.54
(3.96~9.12) |
2.03
(1.52~2.76) |
<0.0001 |
1.74
(1.25~2.41) |
0.0009 |
| All-cause death |
| Entire cohort |
1,249
(19.6) |
1,588
(16.1) |
3.44
(2.13~4.74) |
1.24
(1.15~1.33) |
<0.0001 |
1.21
(1.11~1.32) |
<0.0001 |
– |
| Cardiac death |
| Entire cohort |
620
(10.1) |
703
(7.4) |
2.70
(1.72~3.68) |
1.38
(1.24~1.54) |
<0.0001 |
1.37
(1.20~1.57) |
<0.0001 |
– |
| Myocardial infarction |
| Entire cohort |
468
(8.0) |
638
(7.0) |
1.01
(1.07~1.91) |
1.14
(1.01~1.29) |
0.03 |
1.10
(0.96~1.26) |
0.19 |
– |
| Stroke |
| Entire cohort |
472
(8.1) |
531
(5.8) |
2.36
(1.45~3.26) |
1.41
(1.25~1.60) |
<0.0001 |
1.35
(1.17~1.55) |
<0.0001 |
– |
The number of events includes all events that occurred until the end of the follow-up for the entire follow-up period. CI, confidence interval; HR, hazard ratio. Other abbreviations as in Table 1.
The excess adjusted risk of the DM group relative to the non-DM group was also significant for both all-cause and cardiac death (Table 3;
Supplementary Figure 1). Compared with the non-DM group, the DM group was associated with a significantly higher adjusted risk for stroke, but not MI (Table 3).
Clinical Characteristics: ITDM vs. NITDM
Patients in the ITDM group were younger, more frequently women, and more often had prior HF, EF≤40%, and end-stage renal failure than those in the NITDM group (Table 2). Patients in the ITDM group more often underwent CABG as the coronary revascularization procedure than those in the NITDM group. Regarding procedural characteristics, ITDM patients had more target lesions and more often had target lesions of the proximal left anterior descending coronary artery than NITDM patients. Similar differences between the ITDM and NITDM groups were observed in both the PCI and CABG subgroups (Supplementary Table 2).
Clinical Outcomes: ITDM and NITDM
The cumulative 5-year incidence of HF hospitalization was 14.6% and 10.0% in the ITDM and NITDM groups, respectively (log-rank P<0.0001;
Table 4; Figure 2B). However, after adjusting for confounders, the excess risk of the ITDM group relative to the NITDM group for HF hospitalization was no longer significant (HR 1.17, 95% CI 0.96–1.43, P=0.12;
Table 4). There was no significant interaction between PCI or CABG and the effect of ITDM relative to NITDM for HF hospitalization (Interaction P=0.20;
Table 4).
Table 4.
Clinical Outcomes in ITDM and NITDM Patients
| |
No. patients (%) with event
(cumulative 5-year incidence) |
Absolute
difference
(%; 95% CI) |
HR (95% CI) |
Interaction P |
| ITDM |
NITDM |
Crude |
P-value |
Adjusted |
P-value |
| HF hospitalization |
| Entire cohort |
176
(14.6) |
449
(10.0) |
4.63
(2.37~6.88) |
1.42
(1.19~1.69) |
0.0001 |
1.17
(0.96~1.43) |
0.12 |
– |
| PCI |
133
(14.9) |
362
(9.6) |
5.26
(2.66~7.87) |
1.55
(1.27~1.88) |
<0.0001 |
1.26
(1.00~1.58) |
0.049 |
0.20 |
| CABG |
43
(13.7) |
87
(11.9) |
1.79
(−2.82~6.40) |
1.03
(0.71~1.47) |
0.89 |
0.99
(0.65~1.50) |
0.96 |
| All-cause mortality |
| Entire cohort |
345
(24.4) |
904
(18.2) |
6.19
(3.55~8.83) |
1.37
(1.21~1.55) |
<0.0001 |
1.10
(0.95~1.28) |
0.18 |
– |
| Cardiac death |
| Entire cohort |
176
(13.5) |
444
(9.2) |
4.30
(2.17~6.42) |
1.41
(1.18~1.67) |
0.0002 |
1.17
(0.95~1.44) |
0.15 |
– |
| Myocardial infarction |
| Entire cohort |
104
(8.0) |
364
(8.0) |
−0.02
(−1.74~1.71) |
0.99
(0.80~1.24) |
0.98 |
0.89
(0.69~1.14) |
0.36 |
– |
| Stroke |
| Entire cohort |
126
(9.7) |
346
(7.7) |
1.94
(0.03~3.86) |
1.31
(1.06~1.60) |
0.01 |
1.22
(0.96~1.54) |
0.10 |
– |
The number of events includes all events that occurred until the end of the follow-up for the entire follow-up period. Abbreviations as in Tables 1–3.
The cumulative 5-year incidence of all-cause death, cardiac death, and stroke was significantly higher in the ITDM than NITDM group (Table 4;
Supplementary Figure 2). However, after adjusting for confounders, the excess risks of the ITDM group relative to the NITDM group for all-cause death, cardiac death, and stroke were no longer significant (Table 4).
Discussion
The main findings of the present study were that the adjusted long-term risk for HF hospitalization after coronary revascularization was significantly higher in DM than non-DM patients, regardless of revascularization strategy, but did not differ between ITDM and NITDM patients.
Diabetic patients are well known to be at high risk for CAD and other atherosclerotic disease, resulting in worse cardiovascular outcomes compared with non-diabetic patients.1–4,11–14
In past clinical trials and large-scale registries, no clear benefits were demonstrated for intensive glycemic control in reducing cardiovascular events, although very long-term follow-up of the UK Prospective Diabetes Study (UKPDS) finally showed mortality benefit of intensive glycemic control after 20 years follow-up.15
Recently, however, clinical trials evaluating the effects of new SGLT2 inhibitors on cardiovascular outcome in DM patients have consistently shown a clear benefit of SGLT2 inhibitor use in reducing cardiovascular events than control after 3–5 years follow-up. In particular, these trials demonstrated a significant reduction in the incidence of HF in the SGLT-2 inhibitor group compared with control.5–7,16,17
The detailed mechanism by which SGLT2 inhibitors improve cardiovascular mortality in DM patients remains unclear, but 1 potential mechanism is that the decrease in HF risk by SGLT2 inhibitors could lead to improved cardiovascular mortality in DM patients. Therefore, prevention and management of HF in DM patients is a hotly debated issue. However, the degree to which the risk for HF development differs between DM and non-DM patients with CAD has not been adequately evaluated as yet.
Accroding to the findings of the present study, which evaluated CAD patients who underwent coronary revascularization, DM patients had a significantly higher risk for HF hospitalization than non-DM patients. These results are consistent with previous reports. For example, van Melle et al reported that DM was an independent predictor of HF among patients with stable CAD and an approximate 3-fold risk of HF,18
and another study reported that diabetes predicts HF among patients with acute coronary syndrome.19
Therefore, DM patients with CAD who require coronary revasculazition may be good candidates for SGLT2 inhibitors, although this should be addressed in future clinical trials.
Conversely, the risk of HF hospitalization and all-cause death was neutral between ITDM and NITDM patients in the present study. Although a few previous studies have evaluated the different risks for HF between ITDM and NITDM patients, those studies reported that ITDM patients had a higher risk for all-cause mortality than NITDMpatients.20–22
The reason for the apparent discrepancies between the present study and those previous studies is unclear. One possible explanation is the different duration of clinical follow-up among studies. The j-Cypher Registry assessed clinical outcomes for 3 years after the procedure, whereas the present study followed clinical outcomes from 5 to 7 years after the procedure. Another explanation may be differences in the patient populations among studies. For example, approximately 30% of patients in the present study were diagnosed with ST-segment elevation MI at the time of enrollment, compared with 6.8% of patients in the j-Cypher registry, and the present study only included patients undergoing their first procedure for CAD, whereas other studies did not excluded those with a history of coroanry revascularization. Dangas et al. also demonstrated that ITDM patients had a higher risk of all-cause death compared with NITDM patients at 5 years, but the incidence of all-cause death in that study was quite different to that in the present study, particularly in the CABG group.22
Moreover, the patients in the present study were older and had cormobidities such as liver cirrhosis, severe renal disease, and anemia, which were generally associated with higher risk for all-cause mortality regardless of insulin status.
In addition, the present examined the effect of insulin use on HF hospitalization. Insulin use was not independently associated with a higher risk for HF hospitalization. Therefore, DM patients undergoing coronary revascularization should be regarded as high risk for HF hospitalization regardless of insulin use. However, the detailed mechanism underlying the higher risk of DM relative to non-DM patients for HF development could not be explained in the present study, and it cannot be explained only by the presence or severeity of CAD. Although several previous studies proposed multifactorial mechanisms of DM-induced cardiac dysfunction, such as impaired reserve of metobolism, myocardial perfusion, and oxidative delivering,23–31
the lack of data on the detailed etiology of HF in this study makes it impossible to discuss the mechanism underlying the higher risk for HF development in DM regardless of revascularization strategy and insulin use. Further studies evaluating the mechanisms of DM-related cardiac dysfunction and appropriate management in this high-risk group of patients would be warrented.
Study Limitations
This study has some limitations. First, we did not have information on the etiology of HF, such as ischemia, arrhytmia, and infection. Therefore, we could not evalutate the mechanism or reason for the higher risk of HF development in DM regardless of revascularization strategy and insulin use. Second, we did not have data on the proportion of patients with type 1 and type 2 DM. Third, patients with DM were stratified according to insulin use at baseline, and any modifications to their medications during follow-up were not recorded. Fourth, newer antidiabetic agents, such as dipeptidyl peptidase-4 inhibitors, glucagon-like peptide-1 receptor agonists, and SGLT-2 inhibitors, were not available during the study period. Therefore, the medications used for the treatment of DM differ from those used in current clinical practice. Finally, there may have been an effect unmeasured confounding factors, even after extensive statistical adjustment.
Conclusions
The adjusted long-term risk for HF hospitalization after coronary revascularization was significantly higher in DM than non-DM pateints, regardless of revascularization strategy, but did not differ between ITDM and NITDM patients.
Source of Funding
The CREDO-Kyoto PCI/CABG Registry Cohort-2 was supported by the Pharmaceuticals and Medical Devices Agency in Tokyo, Japan.
Conflict of Interest
None of the authors has any conflict of interest to disclose.
Supplementary Files
Please find supplementary file(s);
http://dx.doi.org/10.1253/circj.CJ-19-0980
References
- 1.
Burke JP, Williams K, Gaskill SP, Hazuda HP, Haffner SM, Stern MP. Rapid rise in the incidence of type 2 diabetes from 1987 to 1996: Results from the San Antonio Heart Study. Arch Intern Med 1999; 159: 1450–1460.
- 2.
Fox CS, Coady S, Sorlie PD, D’Agostino RB Sr, Pencina MJ, Vasan RS, et al. Increasing cardiovascular disease burden due to diabetes mellitus: The Framingham Heart Study. Circulation 2007; 115: 1544–1550.
- 3.
Patel A, MacMahon S, Chalmers J, Neal B, Billot L, Woodward M, et al. Intensive blood glucose control and vascular outcomes in patients with type 2 diabetes. N Engl J Med 2008; 358: 2560–2572.
- 4.
Gregg EW, Li Y, Wang J, Burrows NR, Ali MK, Rolka D, et al. Changes in diabetes-related complications in the United States, 1990–2010. N Engl J Med 2014; 370: 1514–1523.
- 5.
Zinman B, Wanner C, Lachin JM, Fitchett D, Bluhmki E, Hantel S, et al. Empagliflozin, cardiovascular outcomes, and mortality in type 2 diabetes. N Engl J Med 2015; 373: 2117–2128.
- 6.
Neal B, Perkovic V, Mahaffey KW, de Zeeuw D, Fulcher G, Erondu N, et al. Canagliflozin and cardiovascular and renal events in type 2 diabetes. N Engl J Med 2017; 377: 644–657.
- 7.
Wiviott SD, Raz I, Bonaca MP, Mosenzon O, Kato ET, Cahn A, et al. Dapagliflozin and cardiovascular outcomes in type 2 diabetes. N Engl J Med 2019; 380: 347–357.
- 8.
Kimura T, Morimoto T, Furukawa Y, Nakagawa Y, Kadota K, Iwabuchi M, et al. Long-term safety and efficacy of sirolimus-eluting stents versus bare-metal stents in real world clinical practice in Japan. Cardiovasc Interv Ther 2011; 26: 234–245.
- 9.
Shiomi H, Morimoto T, Hayano M, Furukawa Y, Nakagawa Y, Tazaki J, et al. Comparison of long-term outcome after percutaneous coronary intervention versus coronary artery bypass grafting in patients with unprotected left main coronary artery disease (from the CREDO-Kyoto PCI/CABG Registry Cohort-2). Am J Cardiol 2012; 110: 924–932.
- 10.
Serruys PW, Unger F, Sousa JE, Jatene A, Bonnier HJ, Schonberger JP, et al. Comparison of coronary-artery bypass surgery and stenting for the treatment of multivessel disease. N Engl J Med 2001; 344: 1117–1124.
- 11.
Garcia MJ, McNamara PM, Gordon T, Kannel WB. Morbidity and mortality in diabetics in the Framingham population: Sixteen year follow-up study. Diabetes 1974; 23: 105–111.
- 12.
Panzram G. Mortality and survival in type 2 (non-insulin-dependent) diabetes mellitus. Diabetologia 1987; 30: 123–131.
- 13.
Stamler J, Vaccaro O, Neaton JD, Wentworth D. Diabetes, other risk factors, and 12-yr cardiovascular mortality for men screened in the Multiple Risk Factor Intervention Trial. Diabetes Care 1993; 16: 434–444.
- 14.
UK Prospective Diabetes Study 16. Overview of 6 years’ therapy of type II diabetes: A progressive disease. UK Prospective Diabetes Study Group. Diabetes 1995; 44: 1249–1258.
- 15.
Holman RR, Paul SK, Bethel MA, Matthews DR, Neil HA. 10-year follow-up of intensive glucose control in type 2 diabetes. N Engl J Med 2008; 359: 1577–1589.
- 16.
Fitchett D, Zinman B, Wanner C, Lachin JM, Hantel S, Salsali A, et al. Heart failure outcomes with empagliflozin in patients with type 2 diabetes at high cardiovascular risk: Results of the EMPA-REG OUTCOME(R) trial. Eur Heart J 2016; 37: 1526–1534.
- 17.
Radholm K, Figtree G, Perkovic V, Solomon SD, Mahaffey KW, de Zeeuw D, et al. Canagliflozin and heart failure in type 2 diabetes mellitus. Circulation 2018; 138: 458–468.
- 18.
van Melle JP, Bot M, de Jonge P, de Boer RA, van Veldhuisen DJ, Whooley MA. Diabetes, glycemic control, and new-onset heart failure in patients with stable coronary artery disease: Data from the heart and soul study. Diabetes Care 2010; 33: 2084–2089.
- 19.
Stone PH, Muller JE, Hartwell T, York BJ, Rutherford JD, Parker CB, et al. The effect of diabetes mellitus on prognosis and serial left ventricular function after acute myocardial infarction: Contribution of both coronary disease and diastolic left ventricular dysfunction to the adverse prognosis. The MILIS Study Group. J Am Coll Cardiol 1989; 14: 49–57.
- 20.
Tada T, Kimura T, Morimoto T, Ono K, Furukawa Y, Nakagawa Y, et al. Comparison of three-year clinical outcomes after sirolimus-eluting stent implantation among insulin-treated diabetic, non-insulin-treated diabetic, and non-diabetic patients from j-Cypher registry. Am J Cardiol 2011; 107: 1155–1162.
- 21.
Bundhun PK, Li N, Chen MH. Adverse cardiovascular outcomes between insulin-treated and non-insulin treated diabetic patients after percutaneous coronary intervention: A systematic review and meta-analysis. Cardiovasc Diabetol 2015; 14: 135.
- 22.
Dangas GD, Farkouh ME, Sleeper LA, Yang M, Schoos MM, Macaya C, et al. Long-term outcome of PCI versus CABG in insulin and non-insulin-treated diabetic patients: Results from the FREEDOM trial. J Am Coll Cardiol 2014; 64: 1189–1197.
- 23.
Lehrke M, Marx N. Diabetes mellitus and heart failure. Am J Cardiol 2017; 120(1S): S37–S47.
- 24.
Levelt E, Pavlides M, Banerjee R, Mahmod M, Kelly C, Sellwood J, et al. Ectopic and visceral fat deposition in lean and obese patients with type 2 diabetes. J Am Coll Cardiol 2016; 68: 53–63.
- 25.
Levelt E, Rodgers CT, Clarke WT, Mahmod M, Ariga R, Francis JM, et al. Cardiac energetics, oxygenation, and perfusion during increased workload in patients with type 2 diabetes mellitus. Eur Heart J 2016; 37: 3461–3469.
- 26.
Falcao-Pires I, Hamdani N, Borbely A, Gavina C, Schalkwijk CG, van der Velden J, et al. Diabetes mellitus worsens diastolic left ventricular dysfunction in aortic stenosis through altered myocardial structure and cardiomyocyte stiffness. Circulation 2011; 124: 1151–1159.
- 27.
Wong TC, Piehler KM, Kang IA, Kadakkal A, Kellman P, Schwartzman DS, et al. Myocardial extracellular volume fraction quantified by cardiovascular magnetic resonance is increased in diabetes and associated with mortality and incident heart failure admission. Eur Heart J 2014; 35: 657–664.
- 28.
Kannel WB, Hjortland M, Castelli WP. Role of diabetes in congestive heart failure: The Framingham study. Am J Cardiol 1974; 34: 29–34.
- 29.
Intensive blood-glucose control with sulphonylureas or insulin compared with conventional treatment and risk of complications in patients with type 2 diabetes (UKPDS 33). UK Prospective Diabetes Study (UKPDS) Group. Lancet 1998; 352: 837–853.
- 30.
Zhao W, Katzmarzyk PT, Horswell R, Wang Y, Johnson J, Hu G. HbA1c and heart failure risk among diabetic patients. J Clin Endocrinol Metab 2014; 99: E263–E267.
- 31.
Rawshani A, Rawshani A, Franzen S, Sattar N, Eliasson B, Svensson AM, et al. Risk factors, mortality, and cardiovascular outcomes in patients with type 2 diabetes. N Engl J Med 2018; 379: 633–644.