Abstract
The aim of this study was to evaluate pharmaceuticals using a near-infrared chemical imaging (NIR-CI) technique for visualizing the distribution of ingredients in solid dosage forms of commercially available clarithromycin tablets. The cross section of a tablet was measured using the NIR-CI system for evaluating the distribution of ingredients in the tablet. The chemical images were generated by performing multivariate analysis methods: principal component analysis (PCA) and partial least squares (PLS) with normalized near-infrared (NIR) spectral data. We gained spectral and distributional information related to clarithromycin, cornstarch, and magnesium stearate by using PCA analysis. On the basis of this information, the distribution images of these ingredients were generated using PLS analysis. The results of PCA analysis enabled us to analyze individual components by using PLS even if sufficient information on the products was not available. However, some ingredients such as binder could not be detected using NIR-CI, because their particle sizes were smaller than the pixel size (approximately 25×25×50 µm) and they were present in low concentrations. The combined analysis using both PCA and PLS with NIR-CI was useful to analyze the distribution of ingredients in a commercially available pharmaceutical even when sufficient information on the product is not available.
Recently, some issues were raised related to the quality of pharmaceuticals available in the market, such as uneasiness about the quality of generic products1,2) and the sale of counterfeit and substandard drugs.3,4) Therefore, it is important to develop tools for rapidly and easily testing commercial pharmaceuticals. The near-infrared chemical imaging (NIR-CI) technique can be used to obtain information on the distribution of ingredients in heterogeneous solid dosage forms by combining chemical information with spatial information at a micron scale.5,6) This technique has helped identify the causes of pharmaceutical design problems and manufacturing process troubles.7–9) NIR-CI has also been used to evaluate the quality of pharmaceutical products purchased on the Internet to screen for substandard and counterfeit drugs.10–12) Therefore, NIR-CI is one of the best methods for testing commercial pharmaceuticals.
Chemometrics using multivariate analysis has often been used for NIR-CI as an analytical technique.13) Two types of multivariate analysis methods have been used to extract chemical information from NIR spectra. One type comprises unsupervised methods such as principal component analysis (PCA) and the other type comprises supervised methods such as partial least squares (PLS). The supervised methods require reference spectra. It is not feasible to analyze marketed medicine using the NIR-CI technique with PLS because it requires the reference spectra of the raw materials used for manufacturing. For formulating the design and understanding the manufacturing process in an industry, a significant amount of information is available for applying NIR-CI, for example, the physical properties of raw materials, drug formulation, and manufacturing method of products, as this information would have been acquired before the analysis. In contrast, such information and raw materials are often unavailable when marketed medicine is surveyed. Therefore, in most cases, commercially available reagents are unavoidably used instead of raw materials to acquire reference spectra. Occasionally, the NIR spectra of commercially available reagents are different from those of the raw materials used for manufacturing products because physical properties such as particle size are different between reagents and raw materials, which hampers the correct application of PLS analysis. Unlike PLS, unsupervised methods such as PCA can be applied even if reference spectra are not available. However, PCA does not always provide one-to-one correspondence between the principal components and ingredients, making it difficult to obtain detailed information on the contents indicated by individual principal components.
To resolve the aforementioned issues, different types of methods for generating images have been used in combination14) for pharmaceutical products available in the market. In this study, we purchased the widely used clarithromycin tablet from the market and generated chemical images of the tablet using NIR-CI with PCA and PLS type 2 (PLS2), which are widely used methods for generating chemical images.13) The analytical performance of these methods for pharmaceutical products available in the market were discussed.
Experimental
MaterialsKlaricid® 200 mg (Abbott Japan), which is an original medicine, was used for this study. Clarithromycin were purchased from Wako Pure Chemical Industries, Ltd. (Osaka, Japan) and LKT Laboratories, Inc. (St. Paul, MN, U.S.A.). Magnesium stearate was purchased from Wako Pure Chemical Industries, Ltd. and Sigma-Aldrich Co., LLC. (Tokyo, Japan). Cornstarch, sodium carboxymethyl cellose (CMC-Na), and silicon dioxide were purchased from Wako Pure Chemical Industries, Ltd. Hydroxypropyl cellulose (HPC) was purchased from Shin-Etsu Chemical Co., Ltd. (Tokyo, Japan). Povidone was purchased from Sigma-Aldrich Co., LLC.
Sample PreparationFlat surface are preferable for NIR-CI measurement. Clarithromycin tablet have a film coating and a convex sharp. Therefore clarithromycin tablet was trimmed by EM Trim (Leica Microsystems, Wetzlar, Germany) and sectioned to observe the interior by NIR-CI.
The reference components were compressed by hand into tablets using 250 mg of components and 10 MPa pressure, and these used as the pure reference wafers.
NIR Chemical ImagingSpotlight400 (PerkinElmer, Inc., Japan, Yokohama, Japan), a line-scan chemical imaging system, was used to obtain the NIR spectra of the samples. Each spectrum was acquired from a square pixel of size 25×25 µm. The background scan was recorded using a gold mirror as the reflectance standard, and the sample scan was recorded at 16 cm−1 spectral resolution with 4 scans across the wavelength range 7600–3800 cm−1.
An area of approximately 4 mm×4 mm (about 25000 pixels) on the section of the tablet was measured using the NIR-CI system. Pure reference wafers of the components were scanned in the same manner as the sample to create a reflectance spectral library of the components.
The NIR data were analyzed using Isys chemical imaging software (version 5.0; Malvern Instruments, Ltd., Worcestershire, U.K.). The reflectance spectra were converted to absorbance spectra by taking the inverse common logarithm to convert R to log(1/R), and the obtained spectra were normalized by the standard normal variate (SNV) method15) to remove any offsets due to physical variations such as path length. The normalized spectral data were used to generate chemical images using the PCA or PLS2 multivariate analysis method based on the spectral library of the pure reference components.
The images were made by the score of PCA, PLS or average of absorbance between the measurement range. The images represented the hue-saturation-value between red and blue. The red areas represented a higher value, while the blue areas represented a lower value.
Results and Discussion
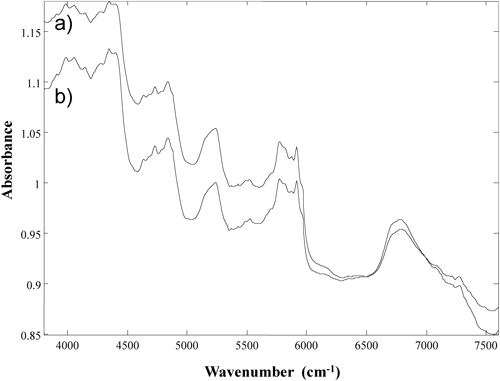
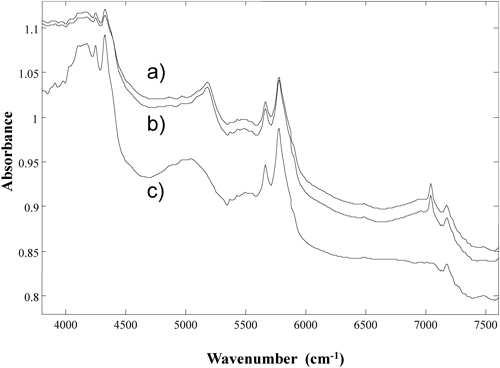
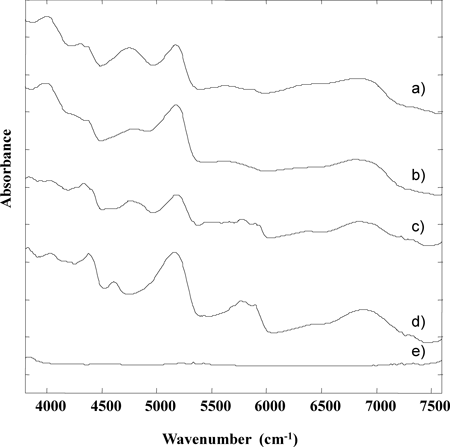
Reference NIR Spectra for the Compounds in Clarithromycin TabletThe NIR spectra of clarithromycin purchased from different vendors are shown in Fig. 1. Two kinds of clarithromycin reagents could be obtained. The absorption peaks appeared at the same points, but their intensities were slightly different between two spectra. According to the certificates of analysis, there was no significant difference in quality such as impurities between two reagents. However the thickness of the reference wafers was different between Wako (1.72 mm) and LKT (1.69 mm). It was suggested that the difference of intensities was caused by density. Figure 2 shows the NIR spectra for magnesium stearate. Three kinds of magnesium stearate reagents could be obtained. The spectrum acquired with the first-grade reagent from Wako was largely different from the spectra produced with the other two reagents: a manufacturing-grade reagent from Wako and a tech-grade reagent from Sigma-Aldrich. Water content (loss on dry) of the first-grade reagent from Wako (7.3%) was different from the manufacturing-grade reagent from Wako (3.8%) and the tech-grade reagent from Sigma-Aldrich (3.8%). Several hydration states of magnesium stearate have been reported,16,17) which explains the difference in spectrum between the reagents from different vendors. These findings suggest that, in some cases, the market survey of medicines using NIR-CI with a supervised method may not be accurate if the correct reference standard spectrum is not acquired. The NIR spectra for other additive agents used in the clarithromycin tablet are shown in Fig. 3. Many of these compounds have broad and similar absorptions. However, silicon dioxide had no absorption in the NIR spectrum.
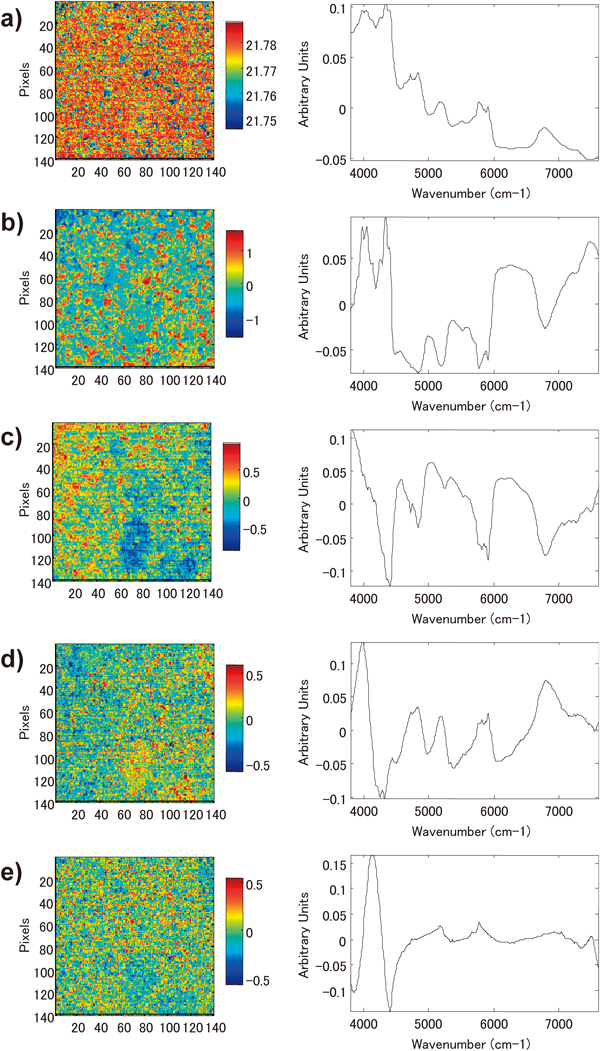
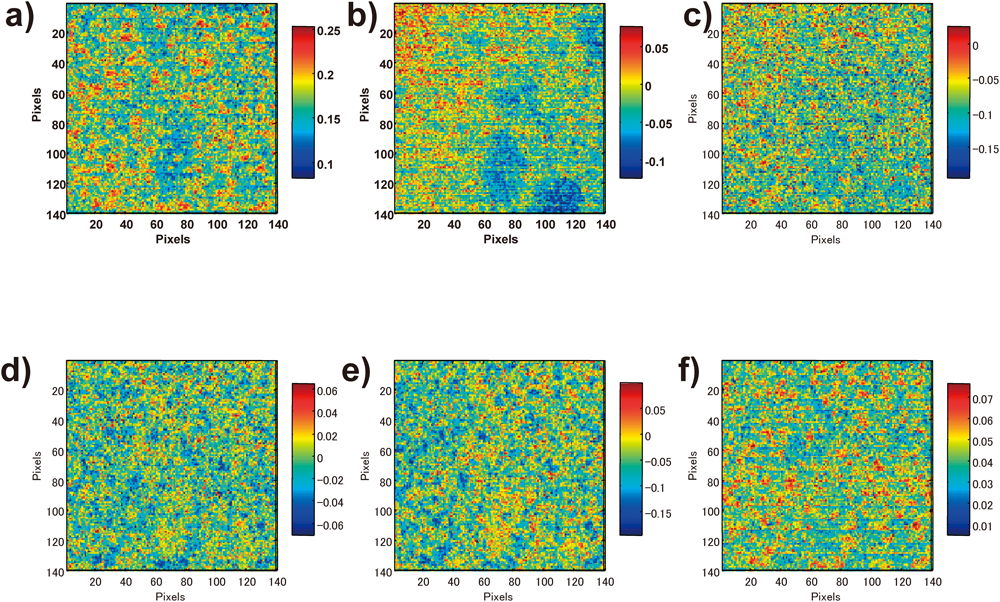
Imaging Analysis of Tablet Using PCAFigure 4 shows the chemical images of the cross section of the tablet obtained using PCA, in addition to the loading plot, which indicates the contribution ratio of each wave number to principal components. The first principal component (PC1) showed the highest score in the image, and its loading plot was similar to the spectrum for clarithromycin. Therefore, it was predicted that PC1 indicated distribution information primarily on clarithromycin. The loading plot of the second principal component (PC2) did not yield any discriminative information. On comparing the average spectra of the image area between the high-score value and low-score value to obtain detailed information from PC2, we found a large difference in the absorption intensity between them, although the spectral forms were similar to each other (Fig. 5). From these results, we speculate that the information for PC2 did not indicate chemical information but was associated with physical information. In the multivariate analysis process, the spectra were pre-processed using the SNV method to eliminate physical information and emphasize chemical information. However, the physical information was not entirely eliminated, and it remained slightly after pre-processing. The third and fourth principal components (PC3 and PC4) showed images in contrast with each other. The loading plot of PC4 had peaks around 4800, 5200, 5800–5900, and 6800 cm−1, which are similar to the ones seen in the spectrum for clarithromycin. This suggests that PC4 shows information on clarithromycin and PC3 shows information on other additives. The loading plot of the fifth principal component (PC5) had peaks at 5176 and 5776 cm−1, which are similar to the ones seen in the spectra for the manufacturing-grade magnesium stearate purchased from Wako and the tech-grade magnesium stearate purchased from Sigma-Aldrich; however, these peaks were different from the ones seen in the spectrum for the first-grade magnesium stearate purchased from Wako. This suggests that the magnesium stearate contained in the tablet was similar to the manufacturing-grade and tech-grade reagents. The sixth and subsequent principal components had low PCA scores and showed no significant features on the images.
Imaging Analysis of Tablet Using PLS2Figure 6 shows cross-section images of the clarithromycin tablet analyzed using PLS2. The spectra for seven kinds of compounds (Figs. 1–3) were used as reference for the PLS2 analysis. The distribution of clarithromycin was analyzed using the spectra for two types of clarithromycin purchased from Wako and LKT as the reference spectra. The spectrum for manufacturing-grade magnesium stearate from Wako was used as the reference spectrum for PLS2 analysis because the result of PCA showed that the manufacturing-grade magnesium stearate closely resembled the raw material used in the tablets, as described above. The images obtained using PLS2 depended on the clarithromycin reference spectra used (Wako or LKT). When the LKT product was used as reference, the higher score values in the image were around 1.0, which implies that the spectrum at the point of the higher score values in the tablet were almost coincident with the reference spectrum for clarithromycin. When the Wako product was used as a reference, the higher score values in the image were approximately 0.9. In addition, the image obtained using the Wako product spectrum as reference was similar to that of PC2 in PCA, which may be because the spectrum of Wako product showed slightly different absorption strength from that of the raw material manufactured for the tablet. Because the LKT product more closely resembled the raw material for clarithromycin than the Wako product did, the LKT product was suitable as the reference standard. The result demonstrated that PC4 in PCA, the image of which resembled the PLS image of clarithromycin, provided the distribution of clarithromycin, and PC3 showed the distribution of other additives. Figure 7 shows the images of the distribution of other additives obtained from the PLS2 analysis. The score values in the images of magnesium stearate and cornstarch were high at the points of low score for clarithromycin, and the images resembled the image of PC3. This finding also supports the result that PC4 showed the distribution of clarithromycin and PC3 showed the distribution of other additives.
Detection of Components Using NIR-CIIn this study, PCA and PLS methods provided the distribution images of clarithromycin, magnesium stearate, and cornstarch in the tablet. However, no significant features were observed for the other components, because PCA did not provide any principal components featuring the other components and PLS gave very low scores for the other components in the tablet. Theoretically, when the particle size of the raw material is larger than a pixel, the spectrum specific to the compound can be observed. In contrast, when the particle size is smaller than a pixel, the compound is mixed with other compounds in a pixel, and a mixed spectrum is observed. When the particle size is smaller, the percentage of the compound in a pixel is lower, making it difficult to detect the compound. The specific spectrum of clarithromycin was observed regardless of the particle size because its content was high at 80%. Specific spectra of cornstarch and magnesium stearate were unclear in the images obtained using PCA, and their information was extracted in PC3 and PC5. This is caused by the fact that their particle sizes, generally about 5–20 µm, is slightly smaller than the size of a single pixel and also by the fact that their content rates were low. Information on CMC-Na, HPC, and povidone were not extracted by PCA because the amounts of added CMC-Na, HPC, and povidone were very small. In particular, the binder, HPC, and povidone were dissolved in water in the manufacturing process and dispersed uniformly; therefore, both HPC and povidone have particle sizes far smaller than the area of a pixel.
Information on PC1 Obtained Using PCAThe penetration of NIR radiation into the sample depends on the wave number, and its DP50 (50% penetration depth) value has been reported to be approximately 50 µm.18) Hence, under the measuring conditions of this study, the information in one pixel is extracted from an approximate volume of 25×25×50 µm. The raw materials in the tablet used in this study were assumed to have smaller particle sizes than a pixel. If the components in the tablet are well-mixed without being aggregated, many pixels on the image show a mixed spectrum resulting from a large amount of clarithromycin and small amount of additives. Therefore, PC1 of PCA indicates a spectrum similar to clarithromycin, but it contains little information about the other additives. From loading plot, the PC4 also provided some information related to clarithromycin. Some peaks specific to clarithromycin were particularly emphasized on the loading plot of PC4. Therefore, the information in PC 4 was more closely related to clarithromycin than that in PC1.
Conclusion
We analyzed the distribution of components in a commercially available clarithromycin tablet using NIR-CI with PCA and PLS. PCA has a disadvantage that the principal components do not always correspond to individual components. Therefore, it was difficult to acquire the distribution images for individual components. However, PCA provided some useful information on the distribution of the ingredients in the tablet. The results of PCA enabled us to analyze individual components by using PLS even if sufficient information on the products is not available. Accordingly, the combined analysis involving NIR-CI with PCA and PLS is useful to analyze the distribution properties of components in medicine available in the market. Many kinds of generic product of clarithromycin that contains different additives are used in the world. The combined method is probably useful to analyze the distribution properties of components in generic products available in the market as well as the original medicine analysis.
Conflict of Interest
The authors declare no conflict of interest.
References
- 1) Nakajima Y., Kaneko T., Kintsu M., Watanabe T., Kosuge K., Matsuyama T., Murakoshi K., Kagawa Y., Yamada H., Jpn. J. Clin. Pharmacol. Ther., 40, 295–302 (2009).
- 2) Miura S., Ishida T., Nakagami M., Yamaoka K., J. Jpn. Soc. Hosp. Pharm., 44, 719–722 (2008).
- 3) Toda K., Pharm. Tech. Jpn., 26, 347–352 (2010).
- 4) Kimura K., Pharm. Tech. Jpn., 26, 353–357 (2010).
- 5) Gowen A. A., O’Donnell C. P., Cullen P. J., Bell S. E. J., Eur. J. Pharm. Biopharm., 69, 10–22 (2008).
- 6) Gendrin C., Roggo Y., Collet C., J. Pharm. Biomed. Anal., 48, 533–553 (2008).
- 7) Hammond S. V., Clarke F. C., “Handbook of Vibrational Spectroscopy,” Vol. 2, John Wiley and Sons Ltd., West Sussex, U.K., 2002, pp. 1405–1418.
- 8) Koide T., Nagato T., Kanou Y., Matsui K., Natsuyama S., Kawanishi T., Hiyama Y., Int. J. Pharm., 441, 135–145 (2013).
- 9) Hilden L. R., Pommier C. J., Badawy S. I. F., Friedman E. M., Int. J. Pharm., 353, 283–290 (2008).
- 10) Veronin M. A., Youan B. B., Science, 305, 481 (2004).
- 11) Westenberger B. J., Ellison C. D., Fussner A. S., Jenney S., Kolinski T. G., Lipe T. G., Lyon R. C., Moore T. W., Revelle L. K., Smith A. P., Spencer J. A., Story K. D., Toler D. Y., Wokovich A. M., Buhse L. F., Int. J. Pharm., 306, 56–70 (2005).
- 12) Dubois J., Wolff J. C., Warrack J. K., Schoppelrei J. W., Lewis E. N., Spectroscopy, 22, 40–50 (2007).
- 13) Clarke F. C., Vib. Spectrosc., 34, 25–35 (2004).
- 14) Cairós C., Amigo J. M., Watt R., Coello J., Maspoch S., Talanta, 79, 657–664 (2009).
- 15) Barnes R. J., Dhanoa M. S., Lister S. J., Appl. Spectrosc., 43, 772–777 (1989).
- 16) Mroso P. V., Li Wan Po A., Irwin W. J., J. Pharm. Sci., 71, 1096–1101 (1982).
- 17) Yonemochi E., Pharm. Tech. Jpn., 29, 37–48 (2013).
- 18) Clarke F. C., Hammond S. V., Jee R. D., Moffat A. C., Appl. Spectrosc., 56, 1475–1483 (2002).