Results and Discussion
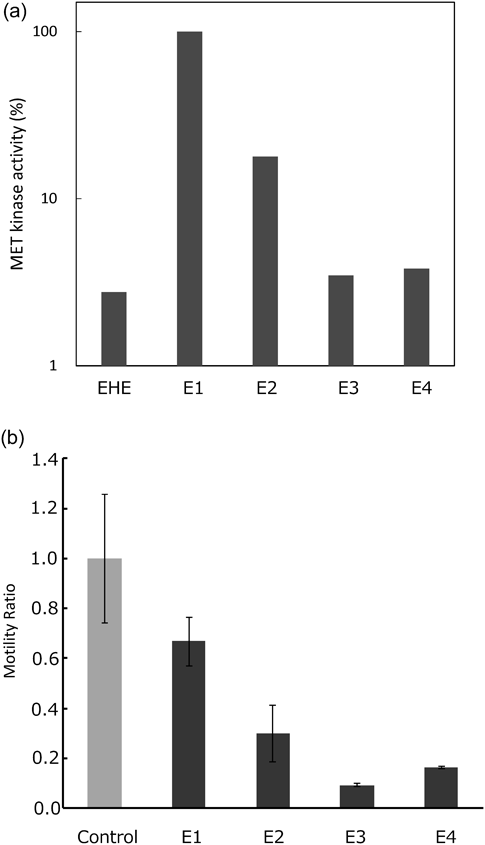
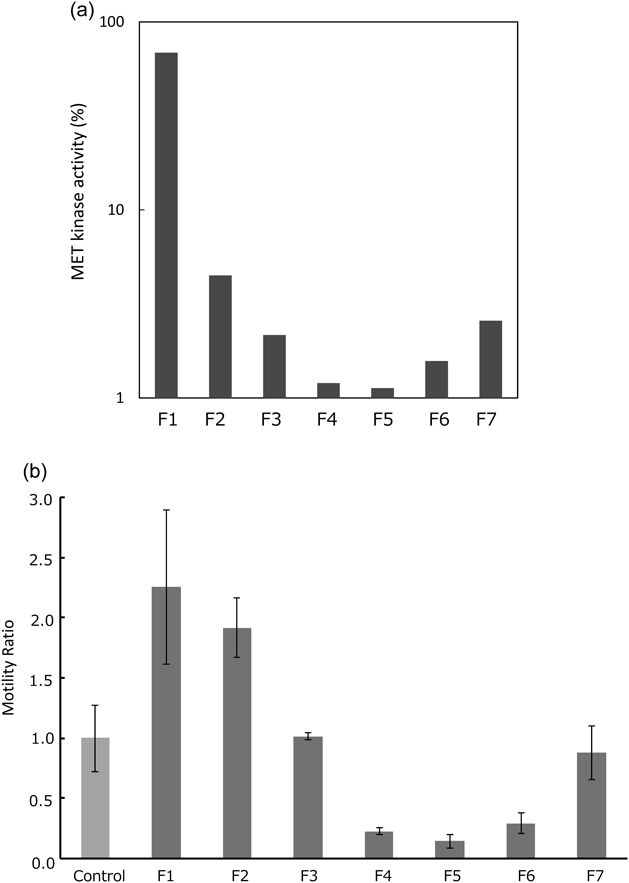
Identification of Active Fractions from EHE with Inhibitory Effects on the c-Met Tyrosine Kinase Activity and HGF-Induced Cancer Cell MotilityEHE was dissolved in water (H2O) and defatted by extraction with n-hexane. The residue was partitioned with ethyl acetate (EtOAc) and n-butanol (BuOH) to produce the respective n-hexane, EtOAc, n-BuOH, and H2O extracts. Both n-BuOH and H2O extracts had the inhibitory effects of c-Met tyrosine kinase activity and cancer cell motility (Fig. 1). Previously, we isolated herbacetin-glycosides from n-BuOH extract.10) To further examine the active fractions, the H2O extract was separated using column chromatography on Diaion HP-20 with aqueous methanol (MeOH) solvent in stepwise gradient mode to produce seven fractions (F1–7). Each fraction was further evaluated for the inhibitory activities. The 30, 40, and 50% MeOH fractions (F4–6) had inhibitory effects on the c-Met tyrosine kinase activity and cancer cell motility (Fig. 2).
Identification of Fraction from EFE with Analgesic Action and Inhibitory Activity of Influenza Virus InfectionEFE was dissolved in H2O and partitioned with EtOAc and n-BuOH to produce the respective EtOAc, n-BuOH, and H2O extracts. Recently, we found that EFE relieves inflammatory pain.13,14) Therefore, we examined the analgesic effects of each fraction isolated from EFE using the formalin test in vivo. The formalin test is widely used to evaluate analgesic effects. Formalin induces biphasic behavioral-related pain: immediate pain (first phase) and late-onset pain (second phase).17,18) Pain in the first phase is thought to be induced by direct stimulation of nociceptors, and pain in the second phase is the result of tonic afferent input from peripheral nerves involved in inflammatory mechanisms. The doses of these fractions were calculated from the yield of fractionation. EFE and H2O extract (Ec) significantly reduced the inflammatory pain (Fig. 3). To further examine the active fractions, the H2O extract (Ec) with the highest yield was separated using column chromatography on Diaion HP-20 with aqueous MeOH solvent in stepwise gradient mode to produce four fractions. The 20% (Fb), 40% MeOH (Fc), and MeOH (Fd) eluates suppressed inflammatory pain as the same levels as EFE, and H2O eluate (Fa) had no effect (Fig. 3).
Furthermore, we recently found that EFE had an inhibitory activity on influenza virus infection.13) Hence, we examined the effect of EFE and the 20, 40% MeOH, and MeOH eluates on survival rate of Madin-Darby canine kidney (MDCK) cells infected with influenza virus A/WSN/33 (H1N1). Oseltamivir, an anti-influenza drug, was used as the positive control (IC50 = 9.98 µM). Neither EFE nor the fractions affected MDCK cell viability, whereas EFE and its fractions prevented cell death caused by influenza virus infection in a concentration-dependent manner (Fig. S1). The IC50 values of EFE and fractions are shown in Table 1. These results indicate that the anti-influenza activity of EFE was mainly obtained in the 40% MeOH eluate.
Table 1. Effects of EFE and the Fractions on Influenza Virus Infection in MDCK Cells
| Specimen | IC50 (µg/mL) | CC50 (µg/mL) |
|---|
| EFE | 3.5 | 47.5 |
| 20% MeOH eluate | 2.4 | 23.6 |
| 40% MeOH eluate | 2.1 | 12.4 |
| MeOH eluate | 4.2 | 20.9 |
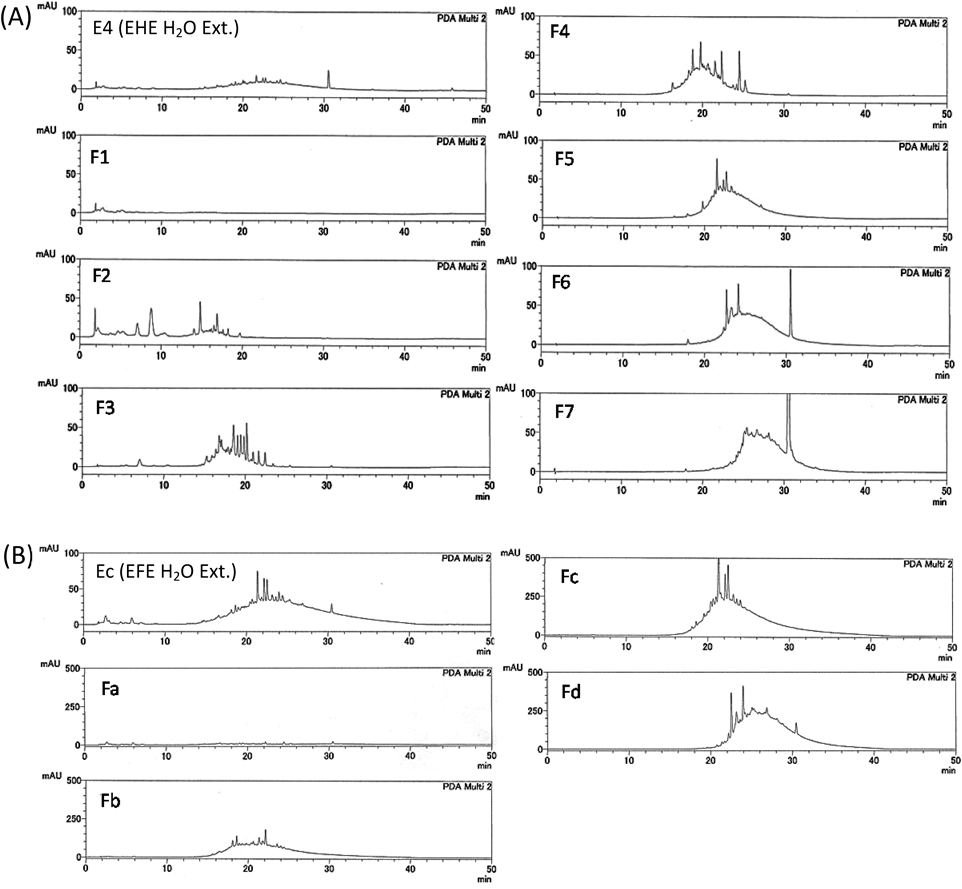
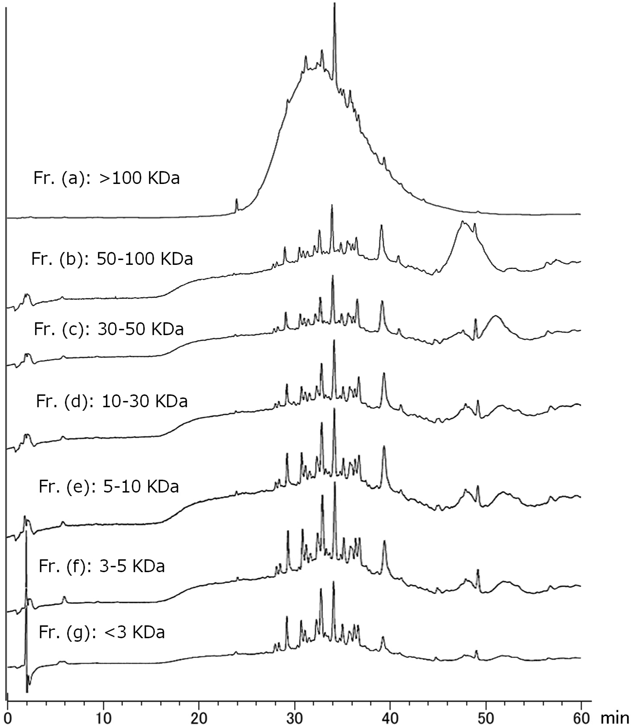
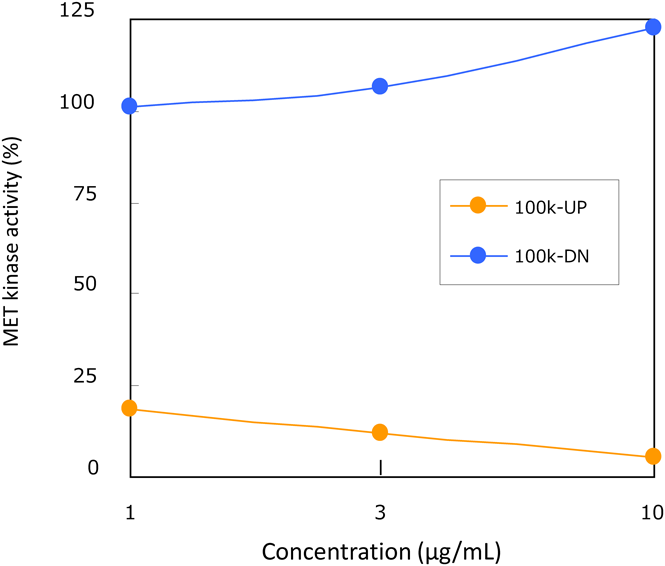
Reversed-phase (RP)-HPLC analysis of each fraction from EHE and EFE was performed, and a characteristic broad peak of condensed tannin was commonly observed in the active fractions (F4–6, Fb–Fd) (Fig. 4). The 13C-NMR spectra of each fraction were measured, and characteristic signals in the condensed tannin indicative of procyanidin A- and B-types19) were observed in F4–6 and Fb–Fd (Fig. 5). To confirm that the product was a condensed tannin, the fraction from the 40% MeOH fraction (F5) from EHE, which had significant activity, was fractionated by ultrafiltration using Vivaspin (<3, 5, 10, 30, 50, and 100 kDa), and then divided into seven fractions [Fr. (a)–(g)] according to molecular weight. Most of the polymer is contained in [Fr. (a): >100 kDa] because the fraction weighs approximately 70%. The RP-HPLC chromatogram of Fr. (a) showed a broad peak, indicating condensed tannins. It was suggested that the fraction contained high-molecular weight polymers (Fig. 6). Evaluation of the c-Met inhibitory activity revealed activity only in the high-molecular weight polymer fraction [Fr. (a)] (Fig. 7). 13C-NMR spectra were measured for the Fr. (a) that showed significant c-Met inhibitory activity. The resulting signals were similar to those of condensed tannins in Fig. 5 (Fig. S2). Therefore, the active fractions were condensed to contain high-molecular mass condensed tannin.
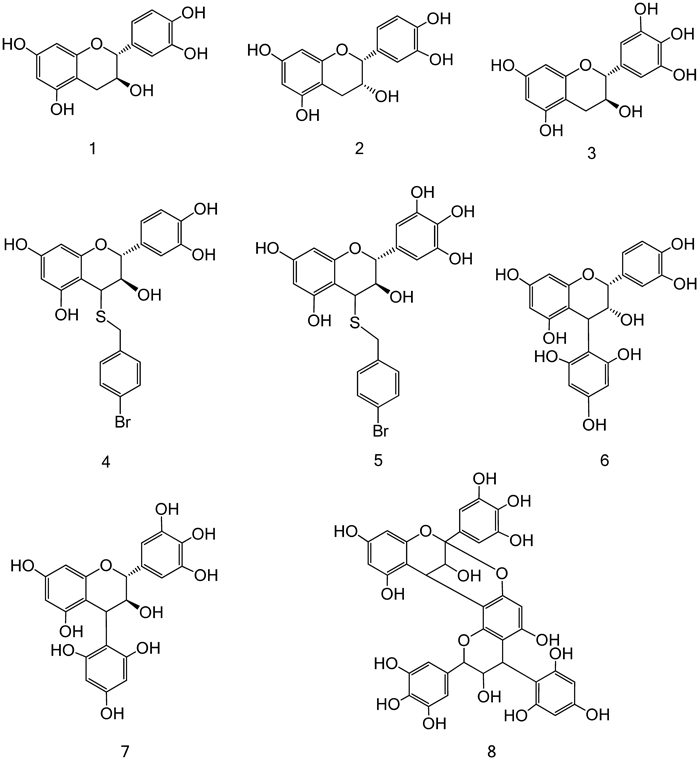
As the obtained active fraction was high-molecular mass condensed tannin, it was subjected to structural elucidation using F5. Thiol degradation using p-bromobenzylmercaptan as a mercaptan was performed according to a previously reported method with a few modifications to analyze the partial structure.20) Five compounds [catechin (1), epicatechin (2), gallocatechin (3), 4-(p-bromobenzylmercaptyl)-catechin (4), and 4-(p-bromobenzylmercaptyl)-gallocatechin (5)] were detected in the fraction (Figs. 8, 9). Additionally, phloroglucinol decomposition was carried out to analyze the partial structure according to a previously reported.21) Five compounds [catechin (1),22) epicatechin (2),19) epicatechin-(4→2)-phloroglucinol (6),23) gallocatechin-(4→2)-phloroglucinol (7),24) and prodelphinidin A-type-(4′→2)-phloroglucinol (8)25)] were detected (Fig. 9). Therefore, the structural characteristic of this fraction including the 13C-NMR spectral data suggested that the flavan 3-ols including pyrogallol- and catechol-type as extension and terminal units mainly bound with procyanidin B-type including the partial procyanidin A-type. The approximate ratio of pyrogallol- and catechol-types in flavan 3-ols was estimated using HPLC analysis in decomposed thiol, and was found to be approximately 5 : 1 (Fig. 8). Similar results were obtained for other fractions with activity (Fb [9 : 2], Fc [4 : 1] and Fd [9 : 2]).
We attempted to calculate the average molecular weight of the high-molecular mass condensed tannin, which were fractions with biological activities (F4–6, Fb–d) using GPC. Standard polystyrene was used for the calibration curve for GPC, data were analyzed using chromato-pro-GPC, and weight-average molecular weight was calculated because the polydispersity index (ratio of [weight-average molecular weight]/[number-average molecular weight]) were large values, which indicate that the fraction include large variety of polymerization. The results showed that weight-average molecular weights of the active fractions were >45000 (F4: 60280, F5: 52053, F6: 63671, Fb: 113279, Fc: 59042, and Fd: 45004) (Fig. S3).
The results suggest that the chemical properties of the active fractions were indicative of high-molecular mass condensed tannins and were mainly procyanidin B-type; a portion contained A-type, including flavan 3-ol of pyrogallol- or catechol-type as extension and terminal units. The ratio of pyrogallol- and catechol-type was approximately 9 : 2, and weight average molecular based on the polystyrene standard was suggested to be >45000. Its presence in the procyanidin oligomer of the aqueous acetone extract of dried aerial parts of Ephedra sinica has been reported.25) To the best of our knowledge, this is the first study to identify condensed tannin as biologically active fractions in EHE and EFE, including their characterized unit ratio and weight-average molecular weights.
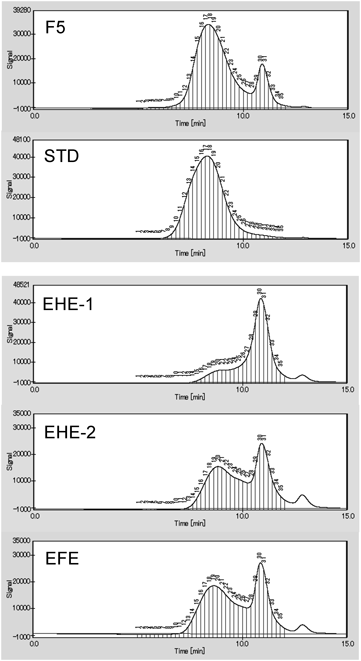
GPC-Based Evaluation for Fractions with Biological Activities in EHE and EFEThe analysis of high-molecular mass condensed tannins is difficult because their structures are not constant unspecified, and their size are large. Although a color reaction is observed in the vanillin-hydrochloric acid method as a confirmatory test for tannin,26) it is difficult to distinguish the type of condensed tannin between plants. If one of the pharmacologically active components of EHE and EFE is high-molecular mass condensed tannin, it would be desirable to propose an analytical method to evaluate and standardize their biological activity. In this study, we examined the results of GPC analysis of high-molecular mass condensed tannins from the prepared EHE, and proposed a verification test based on GPC. To isolate the peak of the polymer region obtained in the GPC analysis of F5 with biological activities, separation and purification were performed by Sephadex LH-20 column chromatography. The result showed that the fraction with a weight-average molecular weight of 85642 was obtained (Fig. 10, STD). The obtained fraction was used a preliminary standard product and EHE and EFE were analyzed using GPC.
Approximately 100 mg of the standard product was precisely weighed, and 10 mL of a 50% dimethylformamide solution was added to dissolve the product; the resulting solution (10.0 mg/mL) was used as the high-molecular mass condensed tannin standard solution. The standard solution was analyzed using GPC, which confirmed that the peak was absent in the low-molecular region. In addition, each EHE was dissolved in 50% dimethylformamide solution (10.0 mg/mL) and subsequently analyzed using GPC. The standard solution showed a peak at a retention time of 5–10 min, aligning with an average molecular weight of approximately >10000 (Fig. 10, STD). Therefore, the total value of the peak area at the retention time (5–10 min) was used for quantitative analysis of the high-molecular mass condensed tannin in EHE and EFE. Three samples of the prepared EHE and EFE were each analyzed three times using GPC, average value of the peak area was calculated, and the peak areas, At (test solution), and As (standard solution) were determined (Table S1). The content (mg) of the high-molecular mass condensed tannin in the sample solution (1 mL) was calculated using the following equation: At/As × 10.00. Peak area of the condensed tannin observed in the high-molecular region and expression in the high-molecular mass condensed tannin content in 1 mL of the sample were determined. As a result, the quantitative value of 1.67–4.0 mg/mL could be calculated. Therefore, quantitative analysis can be performed based on the peak observed using GPC as a standard peak.
The purpose of this study was to determine the active ingredients, besides ephedrine, as the main components of EHE and EFE. The results suggest that the fractions including the high-molecular mass condensed tannin contribute to c-Met kinase inhibitory effect, and the analgesic and anti-influenza activities of EHE and EFE. To add, a GPC method was proposed for the quantitative analysis of high-molecular mass condensed tannin in EHE. Based on the our results, it may be possible to determine the relationship between activity, content, and molecular weight of high-molecular mass condensed tannin, which has not been explored previously. Differences in the constituents that contribute to several activities of EH may be identified by the elucidation of the detail characteristics of high-molecular mass condensed tannins. Further detailed characterization of high-molecular mass condensed tannin may clarify the different activities of EH.
Experimental
GeneralThe NMR spectra were recorded using a Brucker AVANCE500 instrument (Bruker BioSpin, MA, U.S.A., 126 MHz for 13C). Chemical shifts are presented in ppm values relative to those of the solvents [acetone-d6 (δC 29.8) or MeOH-d4 (δC 49.0)] on a tetramethylsilane scale. Column chromatography was conducted using Diaion HP-20 (Mitsubishi Chemical Co., Tokyo, Japan) and Sephadex LH-20 (GE Healthcare, Little Chalfont, U.K.). The RP-HPLC conditions were: Condition 1: column, L-column ODS (5 µm, 150 × 2.1 mm i.d., Chemicals Evaluation and Research Institute, Tokyo, Japan); mobile phase, solvent A was distilled H2O in 0.1% formic acid and solvent B was acetonitrile in 0.1% formic acid (0–30 min, 0–50% B in A; 30–35 min, 50–85% B in A; 35–40 min, 85–85% B in A); injection volume, 2 µL; column temperature, 40°C; flow-rate, 0.3 mL/min; and detection wavelength, 280 nm. Condition 2: column, YMC-pack ODS AQ12S05-1502WT (5 µm, 150 × 2.0 mm i.d., YMC Co., LTD. Kyoto, Japan); mobile phase, solvent A was 10 mM phosphoric acid-10 mM potassium dihydrogen phosphate (1 : 1) and solvent B was MeOH (0–30 min, 0–50% B in A; 30–50 min, 50–60% B in A); injection volume, 3 µL; column temperature, 40°C; flow-rate, 0.25 mL/min; detection wavelength, 280 nm. Condition 3: column, YMC-pack ODS AQ12S05-1502WT (5 µm, 150 × 2.0 mm i.d.); mobile phase, solvent A was 10 mM phosphoric acid–10 mM potassium dihydrogen phosphate (1 : 1) and solvent B was MeOH (0–20 min, 0–10% B in A; 20–80 min, 10–30% B in A); injection volume, 3 µL; column temperature, 40°C; flow-rate, 0.25 mL/min; detection wavelength, 280 nm. Ultrafiltration was performed using the Vivaspin 500 (3, 5, 10, 30, 50, and 100 kDa, GE Healthcare; 11400 × g, 10 min). GPC was conducted using a TSK-gel Super AW4000 (150 × 6.0 mm i.d., Tosoh, Tokyo, Japan) developed using N,N-dimethylformamide in 0.5% 3 mol/L ammonium formate. Standards used for GPC were Shodex Standard SM-105, SL-105 (polystyrene standards, Showa Denko K.K., Tokyo, Japan). The GPC data were analyzed using the Chromato-PRO-GPC (RunTime Corporation, Tokyo, Japan). All reagents were of analytical grade.
Sample FractionationEHE was used the previously reported product obtained from Tsumura & Co. (Tokyo, Japan).14) EHE (300 g) was dissolved in H2O (5 L) and successively extracted with n-hexane (4 L), EtOAc (12 L), and n-BuOH (12 L) to obtain n-hexane (92 mg), EtOAc (13.2 g), n-BuOH (65.7 g), and H2O (161.1 g) extracts. The H2O extract (90 g) was further separated using column chromatography on Diaion HP-20 with MeOH–H2O (0 : 100→10 : 90→20 : 80→30 : 70→40 : 60→50 : 50→100 : 0, each 2 L) in stepwise gradient mode to yield the H2O fraction (47.9 g), 10% MeOH eluate fraction (2.53 g), 20% MeOH eluate fraction (2.61 g), 30% MeOH eluate fraction (6.96 g), 40% MeOH eluate fraction (11.5 g), 50% MeOH eluate fraction (5.10 g), and MeOH fraction (2.61 g) (F1–7). Furthermore, the 40% MeOH eluate fraction in H2O was separated by Vivaspin 500 (3, 5, 10, 30, 50, and 100 kDa; <3 kDa [approx. 10%], 3–5 kDa [approx. 4%], 5–10 kDa [approx. 5%], 10–30 kDa [approx. 6%], 30–50 kDa [approx. 2%], 50–100 kDa [approx. 3%], >100 kDa [approx. 70%]) [Fr. (a)–(g)]. The 40%MeOH eluate fraction (1.2 g) was separated using column chromatography on Sephadex LH-20 with MeOH–H2O (50 : 50→80 : 20) and 70% acetone in stepwise gradient mode to obtain the 50% MeOH eluate (472.6 mg), 80% MeOH eluate (163.5 mg), and 70% acetone eluate (473.0 mg) fractions. The 70% acetone eluate fraction obtained was treated as a preliminary standard product for the quantitative analysis of condensed tannin polymer in EH. The other EHE was prepared from Tokiwa Phytochemical Co., Ltd. The procedure used the previously reported product was used for EFE.14) EFE (400 g) was dissolved in H2O (5 L) and extracted with EtOAc (10 L) and n-BuOH (10 L) to successively obtain EtOAc (7.3 g), n-BuOH (85.0 g), and H2O (311.0 g) extracts. The H2O extract (290 g) was further separated using column chromatography over Diaion HP-20 with MeOH–H2O (0 : 100→20 : 80→40 : 60→100 : 0, each 2 L) in stepwise grade mode to yield the H2O fraction (190.6 g), 20% MeOH eluate fraction (35.9 g), 40% MeOH eluate fraction (41.7 g), and MeOH fraction (13.9 g) (Fa–Fd).
Measurement of c-Met Tyrosine-Kinase Activityc-Met tyrosine kinase activity was measured using the ADP-Glo kinase assay kit (Promega, Madison, WI, U.S.A.) according to the manufacturer’s instructions. Briefly, 10 µL of a reaction mixture containing 2 µg/mL recombinant Met kinase domain, 0.2 µg/mL poly(E4Y1), and 10 µM ATP was incubated with 5 µg/mL extracts or fractions at room temperature for 60 min. The kinase reactions were terminated by the addition of 10 µL ADP-Glo reagent, and the resulting mixture was incubated for 40 min at room temperature. After the addition of 20 µL kinase detection reagent, the mixture was incubated for 30 min at room temperature. Luminescence was measured using an EnSpire multi-plate reader (PerkinElmer, Inc., Foster City, CA, U.S.A.). The relative values were calculated and normalized to the control.
Cell Line and CultureHuman breast cancer MDA-MB-231 cell line was obtained from the American Type Culture Collection (ATC C, Manassas, VA, U.S.A.). Cells were cultured in Dulbecco’s modified Eagle’s medium (DMEM) with 10% fetal calf serum (FCS, lnvitrogen Corp., Carlsbad, CA, U.S.A.) at 37°C in a humidified atmosphere of 95% air and 5% CO2.
Transwell Migration AssayMDA-MB-231 cells were suspended at a density of 5 × 10⁴ cells in 100 µL 2.5% EtOH–DMEM, 25 µg/mL extracts (Fig. 1), or 10 µg/mL fractions (Fig. 2), and placed in the upper well of the Transwell permeable support system (Corning Inc., Acton, MA, U.S.A.). Subsequently, 600 µL DMEM containing 50 ng/mL HGF (R&D Systems, Minneapolis, MN, U.S.A.) was added to the lower well. The Transwell was then incubated for 24 h at 37°C, and the number of cells that migrated to the lower well was counted.
Formalin TestA formalin-induced paw licking test was performed as previously reported.14) Specific pathogen-free ddY male mice (5 weeks old) were purchased from Japan SLC, Inc. (Hamamatsu, Japan). Twenty minutes before the experiments, mice were individually placed in transparent acrylic cylinder cages (height of 200 mm; diameter of 100 mm) for assessment. Mice were orally administered vehicle [10% dimethyl sulfoxide (DMSO) in water], 700 mg/kg EFE, or fractions. Six h after extract/vehicle administration, paw licking was induced by left hind plantar surfaces injection of 10 µL of saline solution containing 2.5% formalin. Licking behavior was recorded with a digital video camera for a period of 45 min in two phases, the first phase (0–5 min) and the second phase (10–45 min). The protocol for animal experiments was approved by the Institutional Animal Care and Use Committee of Kitasato University. Experiments were performed in accordance with the Kitasato University guidelines for animal care, handling, and termination, which align with international and Japanese guidelines for animal care and welfare.
Evaluation of Anti-influenza ActivityMDCK cells (3 × 10⁴ cells/100 µL) were incubated in 100 µL of 10% FCS-minimal essential medium (MEM) in a 96-well plate for 24 h and washed with MEM. Cells were incubated for 72 h at 37°C in 100 µL of MEM or MEM containing a twofold serial dilution of 10 µM oseltamivir, 100 µg/mL EFE, or 25 µg/mL fractions (20% MeOH, 40% MeOH, and MeOH eluates) with or without 100 median tissue culture infectious dose (TCID50) of influenza virus A/WSN/33(H1N1). Living cells were then stained with crystal violet. The absorbance (560 nm) of each cell sample was quantified using a microplate reader. These experiments were performed externally by AVSS Corporation. Each IC50 was calculated using a four-parameter logistic model (Prism 5.0, GraphPad Software).
Thiolysis and PhloroglucinolysisThe fraction (100 mg) from F5 was suspended in 2.5% p-bromobenzylmercaptan, 3.3% HCl in MeOH (5 mL), and reacted overnight at 37°C. After the addition of 5 mL H2O and removal of MeOH in vacuo, the reactant was separated using MCI-gel CHP20P column chromatography and eluted with H2O and aqueous MeOH and then further purified using preparative TLC [n-hexane/EtOAc/HCOOH (2 : 3 : 0.5)] to yield 4-(p-bromobenzylmercaptyl)-gallocatechin (5) (1.3 mg) and 4-(p-bromobenzylmercaptyl)-catechin (4) (0.4 mg). The presence of catechin (1) (6.77 min), epicatechin (2) (10.53 min) and gallocatechin (3) (3.81 min) in the reactant was confirmed by direct HPLC comparison (Condition 3) with authentic samples. Using the same HPLC condition, the peak areas of 4-(p-bromobenzylmercaptyl)-catechin (4) and 4-(p-bromobenzylmercaptyl)-gallocatechin (5) were detected to be 979059 and 4178443, respectively. Moreover, the peak areas of 4 and 5 in the thiolysate of Fb, Fc, and Fd were detected to be 2874251 and 13210220, 2109478 and 8645986, and 1193438 and 5307476, respectively.
The 40% MeOH eluate fraction (500 mg) by derived from Diaion HP-20 column chromatography of the H2O extract of EHE and phloroglucinol (500 mg) in 1% HCl–ethanol (EtOH) (25 mL) were left overnight at room temperature. The reaction mixture was evaporated and then subjected to column chromatography on YMC-gel ODS AQ with aqueous MeOH to yield catechin (1) (3.6 mg), epicatechin (2) (3.0 mg), epicatechin-(4→2)-phloroglucinol (6) (16.8 mg), gallocatechin-(4→2)-phloroglucinol (7) (1.7 mg), and prodelphinidin A-type-(4′→2)-phloroglucinol (8) (10.6 mg).
Catechin (1) 1H-NMR (MeOH-d4) δ: 6.83 (1H, d, J = 2 Hz, H-2′), 6.75 (1H, d, J = 8 Hz, H-5′), 6.70 (1H, dd, J = 2, 8 Hz, H-6′), 5.91 (1H, d, J = 2.5 Hz, H-8), 5.84 (1H, d, J = 2.5 Hz, H-6), 4.55 (1H, d, J = 7.5 Hz H-2), 3.97 (1H, m, H-3), 2.84 (1H, dd, J = 5.5, 16 Hz, H-4), 2.50 (1H, dd, J = 8, 16 Hz, H-4). HR-ESI-MS: m/z 280.0722 (M–H)− (Calcd for C15H14O6–H, 289.0718).
Epicatechin (2) 1H-NMR (MeOH-d4) δ: 6.96 (1H, d, J = 1.5 Hz, H-2′), 6.79 (1H, dd, J = 1.5, 8 Hz, H-6′), 6.75 (1H, d, J = 8 Hz, H-5′), 5.93 (1H, d, J = 2.5 Hz, H-8), 5.90 (1H, d, J = 2.5 Hz, H-6), 4.54 (1H, s, H-2), 4.17 (1H, m, H-3), 2.85 (1H, dd, J = 4.5, 16.5 Hz, H-4), 2.72 (1H, dd, J = 2.5, 16.5 Hz, H-4). HR-ESI-MS: m/z 280.0739 (M−H)− (Calcd for C15H14O6–H, 289.0718).
4-(p-Bromobenzylmercaptyl)-gallocatechin (4) 1H-NMR (MeOH-d4) δ: 7.45 (2H, d, J = 8.5 Hz, H-3″,5″), 7.34 (2H, d, J = 8.5 Hz, H-2″,6″), 6.48 (2H, s, H-2′, 6′), 5.93 (1H, d, J = 2.5 Hz, H-6), 5.87 (1H, d, J = 2.5 Hz, H-8), 5.15 (1H, br s, H-2), 3.98 (1H, d, J = 2.0 Hz, H-4), 3.92 (2H, s, H-7″), 3.86 (1H, dd, J = 1.0, 2.0 Hz, H-3). HR-ESI-MS: m/z 504.9974 and 506.9957 (M−H)− (Calcd for C22H19O7SBr–H, 504.9962 and 506.9942).
4-(p-Bromobenzylmercaptyl)-catechin (5) 1H-NMR (MeOH-d4) δ: 7.45 (2H, d, J = 8.5 Hz, H-3″,5″), 7.35 (2H, d, J = 8.5 Hz, H-2″,6″), 6.94 (1H, d, J = 2.0 Hz, H-2′), 6.76 (1H, d, J = 8.0 Hz, H-5′), 6.66 (1H, dd, J = 2.0, 8.0 Hz, H-6′), 5.93 (1H, d, J = 2.5 Hz, H-6), 5.87 (1H, d, J = 2.5 Hz, H-8), 5.21 (1H, br s, H-2), 4.00 (1H, d, J = 2.0 Hz, H-4), 3.91 (2H, s, H-7″), 3.84 (1H, m, H-3). HR-ESI-MS: m/z 489.0014 and 490.9995 (M−H)− (Calcd for C22H19O6SBr–H, 489.0013 and 490.9993).
Epicatechin (4→2)-phloroglucinol (6) 1H-NMR (MeOH-d4) δ: 6.88 (1H, d, J = 1.5 Hz, H-2′), 6.72 (1H, d, J = 8 Hz, H-5′), 6.68 (1H, d, J = 1.5, 8 Hz, H-5′), 5.99 (1H, d, J = 2.5 Hz, H-8), 5.93 (1H, d, J = 2.5 Hz, H-6), 5.83 (2H, brs, H-3″,5″), 5.03 (1H, br s, H-2), 4.50 (1H, d, J = 1.0 Hz, H-10), 3.94 (1H, br s, H-3). HR-ESI-MS: m/z 413.0894 (M−H)− (Calcd for C21H18O9–H, 413.0878).
Gallocatechin (4→2)-phloroglucinol (7) 1H-NMR (MeOH-d4) δ: 6.56 (2H, s, H-2′, 6′), 5.98, 5.97, 5.80, 5.79 (each 1H, d, J = 2 Hz, H-6, 8, 3″,5″), 4.90-4.10 (3H, m, H-2-4). HR-ESI-MS: m/z 429.0810 (M–H)− (Calcd for C21H18O10–H, 429.0827).
Prodelphinidin A-type-(4′→2)-phloroglucinol (8) 1H-NMR (MeOH-d4) δ: 6.70, 6.64 (each 2H, s, H-2′, 6′, 2‴, 6‴), 6.04, 6.88 (each 1H, d, J = 2 Hz, H-2, 6), 5.96 (1H, s, H-6″), 5.90, 5.81 (each 1H, s, H-3″″,5″″), 4.10, 4.19 (each 1H, d, J = 3.5 Hz, H-3, 4), 4.53, 4.44 (each 1H, d, J = 2.5 Hz, H-3″,4″), 4.46 (1H, brs, H-2″). HR-ESI-MS: m/z 731.1249 (M−H)− (Calcd for C36H28O17–H, 731.1254).
Quantitative Analysis of Condensed Tannin Polymer by GPCEHE, EFE, and the standard product (100 mg each) were separately dissolved in 50% dimethylformamide solution (10 mL, 10 mg/mL test and standard solutions, respectively). Aliquots (1 µL) of the test and standard solutions were analyzed using GPC according to previously-mentioned conditions. Peak areas, At and As were determined. The content (mg) of condensed tannin polymer in the sample solution (1 mL) was calculated using the formula: At/As × 10.00.