Abstract
Combination tablets containing multiple active pharmaceutical ingredients (APIs) are expected to improve patient convenience by decreasing the number of tablets to be taken; thus, numerous formulations containing multiple APIs have recently been developed. To allow for dose adjustments based on patient conditions, many tablets have a bisection line to allow equal division of tablets. However, there have been no investigations regarding content uniformity among divided combination tablets. Therefore, in this study, the content uniformity of combination tablets after division was investigated using near IR and low-frequency (LF) Raman spectroscopy imaging as well as the Japanese Pharmacopoeia (JP) content uniformity tests. As model drugs, five tablets of three combination drugs containing 3-(3,4-dihydroxyphenyl)-L-alanine (L-DOPA) and benserazide hydrochloride (BNS) as APIs for treating Parkinson’s disease were bisected; the resultant 10 samples were subjected to the JP content uniformity tests. We found that acceptance values of L-DOPA and BNS were 11.0–21.9% and 13.3–17.5%, respectively, with some non-conformity to the maximum allowed acceptance value (15.0%) as per the current JP. Image analyses by near IR showed that L-DOPA, BNS, lactose, and corn starch were uniformly distributed in each tablet; moreover, LF Raman spectroscopy imaging also supported the result that L-DOPA, BNS, and lactose were evenly distributed. Therefore, drug content in the tablets was uniform; thus, careful manipulation was recommended in the tablet bisection. However, the results of bisection line specifications and hardness tests revealed that the ease of division differed depending on the tablets, which warrants attention.
Introduction
Although research on single agents has been the mainstream for many years for developing ethical drugs, research on combination drugs containing multiple active pharmaceutical ingredients (APIs) advanced in the latter half of the 1990 s. The use of combination drugs can reduce the number of tablets to be consumed, thereby improving adherence to medication regimens.1) In addition, the prices of combination tablets are lower than the total price of all single-agent tablets; so the frequency of using combination tablets has increased. Based on this background, combination tablets are being launched not only for lifestyle-related diseases, such as hypertension, diabetes mellitus, and dyslipidemia, but also for central nervous system disorders, such as Parkinson’s disease.
Dose adjustments are essential for pediatric and elderly patients because individual differences in organ or metabolic function are greater in such individuals than in adults. Drug dosage is often adjusted by dispensing drugs in divided doses (an administration method wherein tablets can be divided). Thus, many tablets have a bisection line to enable equal splitting of the tablet. However, as tablets are manually divided primarily by pharmacists, depending on the drug, there is a need to consider content uniformity following tablet division.2) For single-component tablets, formulation characteristics, such as the presence or absence of a bisection line, the type of API, and tablet hardness, have been reported to have an effect on content uniformity or dissolution behavior after splitting.3,4) However, to the best of our knowledge, no studies have investigated content uniformity in divided combination tablets containing multiple APIs.
Recently, near IR and Raman spectroscopy imaging, which do not require sample pretreatment and can provide measurements without sample destruction or contact, have attracted attention as methods to visualize APIs, their polymorphisms, and other excipients in drug products.5,6) In near IR spectroscopy, light in the near-IR region (wavelength: 800–2500 nm; frequency: 12500–4000 cm−1) irradiates the target object to measure absorption based on molecular vibration. The obtained absorption spectra are simultaneously measured both qualitatively and quantitatively for all ingredients of the sample using statistical methods; thus, there is a breadth of experience in its use as a quality control method for drug products, particularly the quantitation of APIs and excipients.7–9) Previously, we reported on the evaluation of various drug products including semi-solid dosage forms using near IR spectroscopy.10–12) Moreover, the use of near IR spectroscopy for assessing clarithromycin and excipients in single-agent tablets has been reported.6)
Raman spectroscopy involves the analysis of the reflected wave (Raman scattering) scattered at a wavelength different from that of the irradiated light. Similar to that in near IR spectroscopy, energy changes are observed in Raman spectroscopy, such as molecular vibrations following light irradiation. Compared with near IR spectroscopy, Raman spectroscopy is less susceptible to water absorption13) and allows for localized measurements.14) Recently, the development of a notch filter capable of efficiently eliminating the Rayleigh scattered light has enabled easy measurement of the low-frequency (LF) Raman spectrum (<200 cm−1).15) In contrast to the Raman spectrum in the normal region, which primarily provides data on functional groups, the LF Raman spectrum provides information regarding crystal structure, such as lattice vibrations and intramolecular interactions.16) In addition to the evaluation of polymorphisms17,18) and co-crystals19–21) using LF Raman spectra, we previously succeeded in visualizing the distribution of constituents, including co-crystals, in tablets.22)
Chemical imaging techniques used in any spectroscopic method measure the spectra of each minute segment (pixel) of the plane of the sample to be measured and analyze a large amount of the obtained spectrum data. These techniques provide information about the distribution and mixing uniformity of APIs and excipients in tablets; therefore, such imaging techniques are used to evaluate formulations and perform quality control in drug product design and manufacturing.23) Thus, in this study, equally bisected combination tablets were evaluated using the Japanese Pharmacopoeia (JP) content uniformity test, which is a general test method published in pharmacopoeias, and determined the usefulness of analysis using near IR imaging and LF Raman spectroscopy imaging which enables to assess crystal forms of APIs.
Results and Discussion
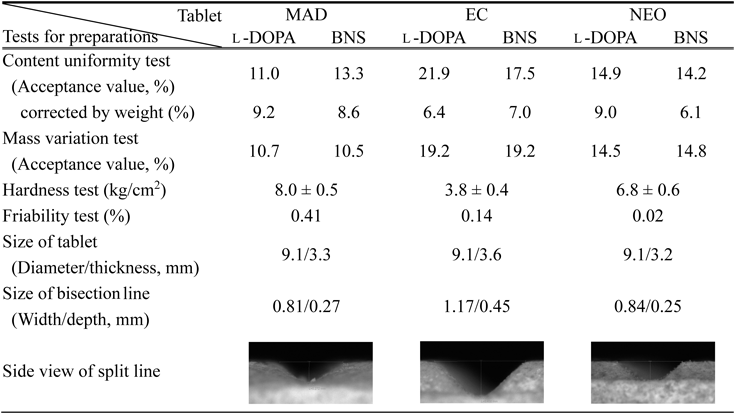
Formulation Testing of Combination TabletsFive tablets for each of the three combination drugs were bisected, and all 10 obtained samples were subjected to the JP 17th edition (JP17) content uniformity test. Using HPLC, the content of the two active ingredients [3-(3,4-dihydroxyphenyl)-L-alanine (L-DOPA) and benserazide hydrochloride (BNS)] was determined and the acceptance values of each were calculated. The acceptance values of L-DOPA and BNS were 11.0–21.9% and 13.3–17.5%, respectively, which were higher than maximum allowed acceptance value in JP17 (15.0%) for EC (EC-DOPARL® tablet), thereby resulting in noncompliance (Table 1). Consequently, when the content of the bisected tablets was corrected by the mass of each sample, the acceptance values of L-DOPA and BNS improved to 6.4–9.2% and 6.1–8.6%, respectively, and were consistent with those listed in JP17. Therefore, the drug content in the tablets and bisected tablets was uniform, suggesting there were issues with bisecting the tablets. In fact, as the acceptance values were similar to those obtained using the mass variation test, a tendency similar to the content uniformity test was shown.
Table 1. Tests Conducted on Combination Tablets in This Study
The results of the friability test conducted on each batch of 20 tablets of MAD (MADOPAR® tablet), EC, and NEO (NEODOPASOL® tablet) were 0.41, 0.14, and 0.02, respectively. Regarding tablet friability, according to JP17, the mass reduction rate should be ≤1%, which was sufficiently met by the results of this study. The hardness of each tablet was evaluated by the mean hardness of 10 tablets for each formulation (Table 1). A hardness of approximately 39.2 N or higher is required for tablets when considering fracture resistance upon impact during transport and packaging.24,25) When the unit for the present results was converted to N, the hardness of MAD, EC, and NEO was 73.5–83.3, 33.3–41.4, and 56.8–68.6 N, respectively. Note that although all formulations demonstrated fracture resistance, EC demonstrated a lower value than MAD and NEO.
It has been identified that tablets with a bisection line have low pressure resistance; thus, subjecting high tableting pressure during the manufacturing process may be difficult.26) In addition, hardness decreases with a deeper bisection line.27) As shown in the side view of the bisection line in Table 1, the depth of the bisection line in EC was 0.45 mm, which was clearly deeper than the MAD or NEO, and this was considered to contribute to its decreased hardness. Thus, it was indicated that mass variation should be considered for tablets after division; however, imaging analyses were performed to confirm that APIs in the assessed formulations were uniformly distributed.
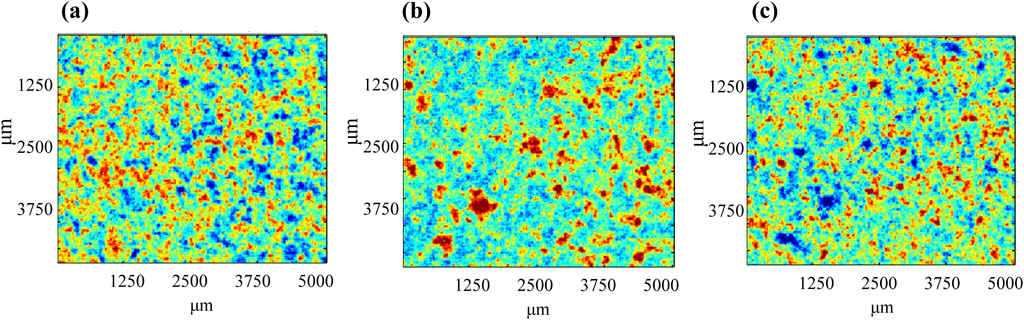
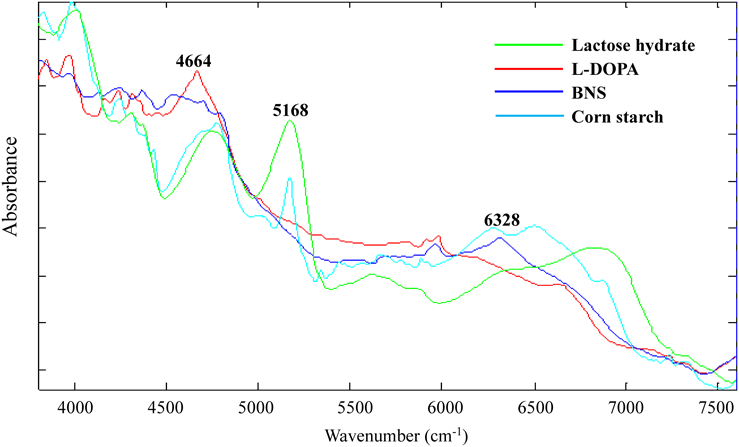
Analysis Using Near IR ImagingNear IR imaging was performed to investigate the distribution of constituents on the tablet surface. Three kinds of flat tablets used in this study have stamps and bisection line; thus, the images were acquired from the regions shown in Fig. 1. Owing to the difficulty in obtaining raw materials for analyzing tablets, the near IR spectra were first obtained from random parts in the EC-DOPARL tablet. In the results, there were large variability at 4664, 5168, and 6328 cm−1. The images at the three wavenumbers are shown in Fig. 2. From the near IR spectra of the main components in the reagents (Fig. 3), the peaks at 4664, 6328, and 5168 cm−1 were confirmed to be for L-DOPA, BNS and lactose, and cornstarch and lactose, respectively. Red, blue, and green (RBG) images created using the peaks that were specific to each of these components are shown in Fig. 4. In the RBG image, red represents L-DOPA with a peak at 4664 cm−1, blue represents BNS with a peak at 6328 cm−1, and green represents cornstarch with a peak at 5168 cm−1. As lactose showed absorbance near 5168 and 6328 cm−1, it was indicated in light blue (representing blue and green overlapping in the RBG image). Using this method, it was possible to visualize the distribution of the primary component and it was inferred that the individual components were uniformly dispersed in each tablet.
LF Raman Spectroscopy ImagingRecently, LF Raman spectroscopy has attracted attention for evaluating crystalline drugs. In this technique, peaks derived from the crystal lattice structure of the sample are observed in the LF region; therefore, peaks corresponding to polymer excipients with low crystallinity, such as starches, are not observed.28) In addition, the intensity of Raman scattered light is strong; thus, it comes with the advantage of being relatively unaffected by fluorescence.29) Consequently, in this study, evaluation using LF Raman spectroscopy imaging was used to assess distribution of tablet ingredients using NEO as the model formulation.
The Raman spectra of active ingredients, i.e., L-DOPA and BNS, and excipients, i.e., lactose hydrate and corn starch, in ordinary and LF regions are shown in Fig. S1 and Fig. 5, respectively. Although the characteristic scattered peaks were observed for all components in both the regions, the intensity of the signal was strong in the LF region; moreover, the difference between the individual components was clear. In addition, Raman scattering was hardly observed for corn starch, which had low crystallinity.
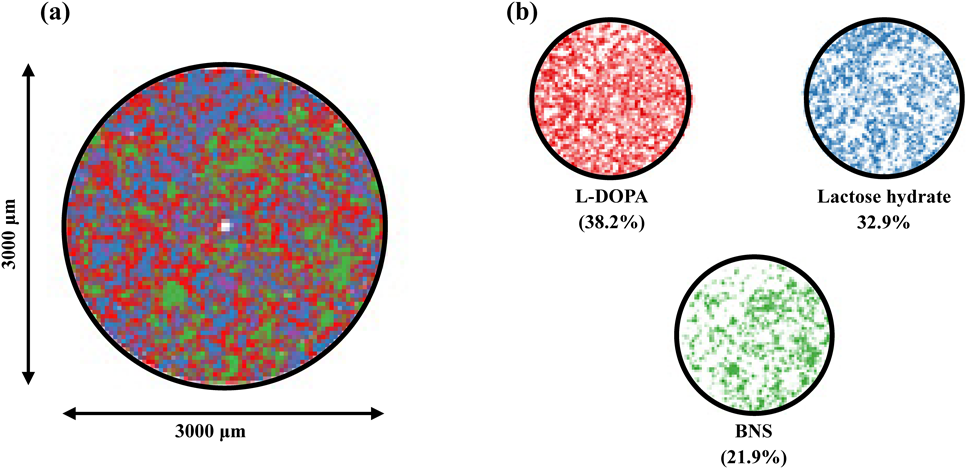
The distribution of each component obtained from principal component analysis (PCA) of 25100 spectra obtained by mapping and measuring NEO surface is shown in Fig. 6. The images of each component superimposed upon each other are shown in Fig. 6a, and images of the distribution of components are shown in Fig. 6b. The intensity of Raman scattering differs depending on the components; thus, deviations were noted in the actual blended quantity and number of pixels in the image. However, each component was found to be uniformly dispersed.
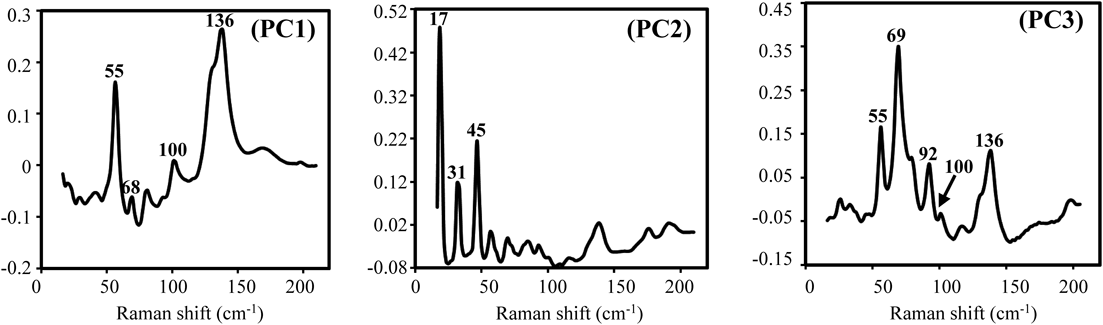
The loading plot of each component is shown in Fig. 7. In PCA, the spectrum for the first principal component (PC1) showed intense peaks at 55 and 136 cm−1; PC2 showed sharp peaks at 17, 31, and 45 cm−1; and PC3 showed strong peaks at 69 cm−1, which were similar to those observed in the LF spectra of L-DOPA, lactose hydrate, and BNS, respectively (Fig. 5). From the aforementioned results, LF Raman spectra appeared to be useful in suppressing the effect of multiple excipients and in evaluating the state of distribution of APIs in the tablets.
Conclusion
In this study, tests for preparations in JP17 were performed on three combination tablets with identical specifications. Based on the results of the content uniformity tests of bisected tablets, the ease of dividing tablets differed depending on the tablets, thereby warranting consideration. However, the results of content correction by the weight of the divided tablets suggested that the two APIs in the combination tablets were uniformly dispersed. Therefore, we performed near IR imaging for each combination tablet and found that the APIs were uniformly distributed. In addition, as a new method, we used LF Raman spectroscopy imaging and succeeded in obtaining images that showed uniform distribution of multiple APIs, supportive for near IR imaging. Although numerous results have been reported using near IR imaging, LF Raman spectroscopy imaging has not been commonly used for such content uniformity assessments. As previously mentioned, LF Raman spectroscopy is an excellent method for assessing the crystal structure of samples and is characterized as being less affected by high molecular-weight additives with low crystallinity in drug products. In addition, further application of LF Raman would be expected in drug development, for example to evaluate the physical stability of amorphous APIs.
Experimental
MaterialsWe assessed L-DOPA and BNS, which are used for treating Parkinson’s disease, in three combination tablets: MAD (Lot. 11H020Z, Chugai Pharmaceutical Co., Ltd., Tokyo, Japan), containing 100 mg of L-DOPA and 28.5 mg of BNS (25 mg as free form of BNS) in a single tablet; EC (Lot. 489AAG, Kyowa Kirin Co., Ltd., Tokyo, Japan); and NEO (Lot. DGB0131, Daiichi Sankyo Company, Limited, Tokyo, Japan). These combination tablets have similar formulations, all have a bisection line, and were supplied by different pharmaceutical companies in their own formulations. The excipients in each formulation are shown in Table 2. L-DOPA and BNS (FUJIFILM Wako Pure Chemical Corporation, Osaka, Japan) were used as references for HPLC assessments. Note that all other reagents used the study were reagent grade products obtained from FUJIFILM Wako Pure Chemical Corporation.
Table 2. Excipients Used in Each Combination Tablet
| Excipient | MAD | EC | NEO |
|---|
| Corn starch | + | | + |
| Potato starch | | + | |
| Carmellose calcium | + | + | + |
| Magnesium stearate | + | + | + |
| Talc | + | + | + |
| Lactose hydrate | + | + | + |
| Food yellow No.4 | + | | |
| Food red No. 3 | + | | |
| Food red No. 102 | | | + |
| Ferric oxide red | | + | |
The content uniformity test was performed to determine the content of APIs in each sample obtained by bisecting five tablets each of the three combination tablets according to the JP17 content uniformity test. In addition, a mass variation test was conducted to evaluate the change in mass of the bisected tablets.
For the hardness test, hardness was measured for 10 samples each of the three combination tablets using the Monsanto tablet hardness meter (Oiwa Yakuhin Kikai, Co., Ltd., Tokyo, Japan). The tablets were wedged in a standing position into the hardness meter, and the mean hardness (kg/cm2) was measured.
The friability test was performed according to JP17 general information under the following conditions. The mass of 20 tablets was accurately weighed in a batch and placed in the drums of the tablet friability tester (Hayashi Rikagaku Co., Ltd., Tokyo, Japan) and rotated 100 times at 25 rpm. After rotation, the powder adhering to the surface of the tablet was wiped off, and the mass of the entire sample was accurately weighed. The reduced mass was calculated from the difference between the initial and post-test masses, and the percent reduction in the mass of the tablet (i.e., the friability) was calculated.
Quantitation Methods for L-DOPA and BNSThe APIs of the combination tablets (L-DOPA and BNS) were assessed using HPLC under the following conditions. Tablets (unsplit tablet) and bisected tablets obtained after dividing along the bisection line using the curvature of a spatula were weighed. The bisected tablets were disintegrated in 30 mL of purified water, to which 5 mL of formic acid was added for dissolution; the total volume was then adjusted to 50 mL using the mobile phase. These solutions were filtered through a membrane filter (Acrodisc®, Pall Life Sciences, pore size: 0.8 µm), and then diluted with the mobile phase such that the concentration of each active ingredient was 0.5 mg/mL; these were used as sample solutions. Thus, measurements were performed using 20-fold diluted L-DOPA (L-DOPA: 0.5 mg/mL, BNS: 0.125 mg/mL) and five-fold diluted BNS (L-DOPA: 2 mg/mL, BNS: 0.5 mg/mL) sample solutions. Moreover, approximately 100 mg of L-DOPA and 100 mg of BNS were weighed and added to 30 mL of purified water; 5 mL of formic acid was added only to L-DOPA for dissolution; the solutions were adjusted to a total volume of 50 mL using the mobile phase. Then, 0.5 mL of L-DOPA and 50 mL of BNS solutions were combined, adjusted to a total volume of 20 mL (concentrations of 0.5 mg/mL) in the mobile phase, and used as standard solutions.
The configuration of the HPLC device was as follows. A JASCO 880-PU pump and JASCO 875-UV (JASCO Corporation, Tokyo, Japan) detector, AS-8010 (Tosoh Corporation, Tokyo, Japan) autosampler, and Inerstil® ODS-3 (4.6 × 150 mm, GL Sciences Inc., Tokyo Japan) column were utilized. HPLC measurements were performed under the following conditions: wavelength, 220 nm; flow rate, 1.0 mL/min; column temperature constant at approximately room temperature; mobile phase, 10 mmol/L sodium dodecyl sulfate aqueous solution/acetonitrile = 66 : 34; and pH = 3.0.
Near IR Chemical ImagingNear IR chemical images were created using a Spotlight 400 (PerkinElmer, Inc., Waltham, U.S.A.) equipped with a liquid nitrogen-cooled mercury–cadmium–telluride 2 × 8-element linear array detector. Sample scan was conducted at a resolution of 16 cm−1 with four scans across wavenumber of 7800–3600 cm−1. An area of 4 × 5 mm was measured with a lateral resolution of 25 × 25 µm per pixel for each spot resulting in a matrix of 40 × 40 pixels (1600 spectra). The background spectrum was acquired using a gold-coated slide with 90 scans. Near IR data were analyzed using the ISys chemical imaging software (version 5.0; Malvern Instruments, Ltd., Worcestershire, U.K.). The reflectance spectra were converted to absorbance spectra using the inverse common logarithm to convert R to log (1/R), and the obtained spectra were normalized using the standard normal variate method30) to remove any effects due to physical variations such as path length. The normalized spectral data were used to generate chemical images using PCA31,32) or the intensity of specific peaks for the components of the spectrum. Images represented the hue-saturation value between red and blue. Red areas represented a higher value, while blue areas represented a lower value.
LF Raman Spectroscopy ImagingLF Raman spectra of reference materials and chemical mapping were archived using the TR-WPS (Ondax Inc., Monrovia, CA, U.S.A.), which has capabilities with patented low-frequency/THz-Raman® technology to automatically capture the entire Raman spectrum from −800 to 2800 cm−1 at 500 ms of exposure time for each step. A 785-nm laser excitation source and thermoelectrically cooled charge-coupled device camera were mounted in the system. A 20× objective with a beam size of approximately 20 µm was used for LF Raman mapping. Preprocessing and PCA analysis of the data were conducted in the Spectra Analyzer and Mapper (Ondax Inc.).
Acknowledgments
This work was supported in part by JSPS KAKENHI, a Grant-in-Aid for the Scientific Research (C), Grant Number 17K08253 (to T.F.). We thank Ms. Yoko Sasajima and Ms. Yuumi Murai for their assistance in conducting the experiments.
Conflict of Interest
The authors declare no conflict of interest.
Supplementary Materials
The online version of this article contains supplementary materials.
References
- 1) Doi O., Pharm. Med. Dev. Regul. Sci., 44, 164–165 (2013).
- 2) Elliott I., Mayxay M., Yeuichaixong S., Lee S. J., Newton P. N., Trop. Med. Int. Health, 19, 754–760 (2014).
- 3) Zaid A. N., Al-Ramahi R. J., Ghoush A. A., Qaddumi A., Zaaror Y. A., Saudi Pharm. J., 21, 71–75 (2013).
- 4) Ishitsuka K., Onuki Y., Takayama K., Yakugaku Zasshi, 132, 225–230 (2012).
- 5) Brown S. C., Claybourn M., Sievwright D., Fearnside V., Ashman C., Appl. Spectrosc., 64, 442–447 (2010).
- 6) Koide T., Yamamoto Y., Fukami T., Katori N., Okuda H., Hiyama Y., Chem. Pharm. Bull., 63, 663–668 (2015).
- 7) Xie Y., Song Y., Zhang Y., Zhao B., Acta Part. Mol. Biomol. Spectrosc., 75, 1535–1539 (2010).
- 8) Moncada G. W., González M. M., Escuredo O., Fischer S., Míguez M., Talanta, 116, 65–70 (2013).
- 9) Vo A. Q., He H., Zhang J., Martin S., Chen R., Repka M. A., AAPS PharmSciTech, 19, 3425–3429 (2018).
- 10) Yamamoto Y., Hanai A., Onuki Y., Fujii M., Onishi Y., Fukami T., Metori K., Suzuki N., Suzuki T., Koide T., Eur. J. Pharm. Sci., 124, 199–207 (2018).
- 11) Yamamoto Y., Fukami T., Onuki Y., Metori K., Suzuki T., Koide T., Vib. Spectrosc., 93, 17–22 (2017).
- 12) Yamamoto Y., Kumetani M., Onuki Y., Koide T., Suzuki T., Fukami T., Chem. Pharm. Bull., 64, 1047–1055 (2016).
- 13) Tres F., Treacher K., Booth J., Hughes P. L., Wren A. C. S., Aylott W. J., Burley C. J., J. Control. Release, 188, 53–60 (2014).
- 14) Heinz A., Strachan C. J., Gordon K. C., Rades T., J. Pharm. Pharmacol., 61, 971–988 (2009).
- 15) Carriere J., Heyler R., Smith B., Spectroscopy, 28, 44–50 (2013).
- 16) Larkin P. J., Wasylyk J., Raglione M., Appl. Spectrosc., 69, 1217–1228 (2015).
- 17) Iwata K., Karashima M., Ikeda Y., Inoue M., Fukami T., CrystEngComm, 20, 1928–1934 (2018).
- 18) Koide T., Fukami T., Hisada H., Inoue M., Carriere J., Heyler R., Katori N., Okuda H., Goda Y., Org. Process Res. Dev., 20, 1906–1910 (2016).
- 19) Suzuki Y., Muangnoi C., Thaweesest W., Teerawonganan P., Na Bhuket R. P., Titapiwatanakun V., Yoshimura-Fujii M., Sritularak B., Likhitwitayawuid K., Rojsitthisak P., Fukami T., Biol. Pharm. Bull., 42, 1004–1012 (2019).
- 20) Tanabe Y., Maeno Y., Ohashi K., Hisada H., Roy A., Carriere J., Heyler R., Fukami T., Eur. J. Pharm. Biopharm., 136, 131–137 (2019).
- 21) Otaki T., Tanabe Y., Kojima T., Miura M., Ikeda Y., Koide T., Fukami T., Int. J. Pharm., 542, 56–65 (2018).
- 22) Hisada H., Inoue M., Koide T., Carriere J., Heyler R., Fukami T., Org. Process Res. Dev., 19, 1796–1798 (2015).
- 23) Pindelska E., Sokal A., Kolodziejski W., Adv. Drug Deliv. Rev., 117, 111–146 (2017).
- 24) Okada N., Hayashi Y., Onuki Y., Miura T., Obata Y., Takayama K., Chem. Pharm. Bull., 64, 1142–1148 (2016).
- 25) Larkin P. J., Dabros M., Sarsfield B., Chan E., Carriere J. T., Smith B. C., Appl. Spectrosc., 68, 758–776 (2014).
- 26) Willett R. D., Yilmaz H., Wokovich M. A., Rodriguez D. J., Am. Pharm. Rev., 22, 48–51 (2019).
- 27) Barnes R. J., Dhanoa M. S., Lister S. J., Appl. Spectrosc., 43, 772–777 (1989).
- 28) Clarke F. C., Vib. Spectrosc., 34, 25–35 (2004).
- 29) Bunaciu A. A., Aboul-enein H. Y., Hoang V. D., Trends Analyt. Chem., 69, 14–22 (2015).
- 30) Martin E. W., “Remington’s Pharmaceutical Sciences,” 16th ed., Mack Publishing Co., Pennsylvania, 1980.
- 31) Hasegawa M., Otsuka A., Nobuta M., J. Pharm. Sci. Technol. Jpn., 41, 146–154 (1981).
- 32) Hara I., Higuchi Y., Yabuki A., Japan Patent 2008024532 (2008).