Regular Articles
Adsorption of Phosphate Ions on Novel Mg/Fe/Al Hydroxides (MFA) Prepared at Different Mg2+/Fe3+/Al3+ Ratios
2020 Volume 68 Issue 4 Pages 339-344
Details
2020 Volume 68 Issue 4 Pages 339-344
In this study, we prepared novel Mg/Fe/Al hydroxides (MFA series: denoted by MFA1, MFA2, MF, and MA) and investigated their properties using scanning electron microscopy, X-ray diffraction, the specific surface area, and amount of hydroxyl groups. Additionally, the phosphate adsorption capabilities of the MFA series or Fe–Mg type hydrotalcites (FHT3.0 and FHT5.0) were evaluated by examining the effects of the solution pH and contact time, and analyzing the adsorption isotherm and desorption characteristics. In MFA1, a strong correlation exists between the amount of adsorbed phosphate ions and surface hydroxyl groups, with a correlation coefficient of 0.95. The adsorption kinetics data fitted using the pseudo-second-order model performs better than the pseudo-first-order model. The adsorption isotherm data were also fitted using both the Freundlich and Langmuir models. Finally, the phosphate ions adsorbed on the MFA1 surfaces were desorbed using sodium hydroxide solution. These results indicate that MFA1 offers great potential for phosphate ion adsorption from aqueous solutions and functions as a renewable adsorbent.
Phosphorus has been recognized as an essential macronutrient in aquatic environments.1,2) However, excess phosphorus concentrations can cause eutrophication in the lakes and rivers.3,4) Thus, discharge limits have been set to ensure effluent phosphate concentrations in wastewater to prevent eutrophication. Various methods are currently used to remove phosphate ions from wastewater such as active sludge, ion exchange, or precipitation using chemical methods, which incur high costs. Thus, the adsorption method was used in this study to remove the phosphate ions from wastewater, with the simple operation/process requiring low costs. Various previous studies have investigated the adsorption method using HUD/Al-HUD zeolite,5) Fe-Bentnite,6) Zn–Al layered double hydroxide,7) Al hydroxide gel,8) Mg/Fe double hydroxide,9) Fe-doped activated carbon,10) Calcined Ni hydroxide,11) and Co hydroxide.12) These studies have reported that a change in the combination of metals changes the characteristics of the composite adsorbents. In this study, we attempted to optimize the combination of metals in hydrotalcite-like compounds for the removal of phosphate ions.
Additionally, there are very few reports on three-metal composite adsorbents like Mg–Fe–Al hydroxides because their synthesis becomes difficult with increase in the number and type of metals. We thus investigated a simpler technique to synthesize these novel adsorbents.
In this study, we prepared novel Mg/Fe/Al hydroxides (MFA) at various ratios and investigated their phosphate adsorption behavior. The properties of the adsorbents, adsorption isotherms and kinetics, effect of the pH and temperature, and desorption ability were examined/evaluated. In conclusion, we found simple way of synthesize Mg/Fe/Al hydroxides, and the adsorbent have high capacity of phosphate ion adsorption, and can be repeatedly used. The results indicate that the novel adsorbents synthesized using simple processes are very useful for the removal of phosphate ions from wastewater.
MgCl2·6H2O, FeCl3·6H2O, AlCl3·6H2O, Na2CO3, and potassium dihydrogenphosphate were purchased from FUJIFILM Wako Pure Chemical Corporation (Japan). The Fe–Mg type hydrotalcite (FHT) was obtained from Tomita Pharmaceutical Corporation, Ltd. (Japan), with FHT3.0 : Mg2+/ Fe3+ = 3.0, and FHT5.0 : Mg2+/ Fe3+ = 5.0.
Adsorbent characteristics were evaluated using the following methods. Scanning electron microscopy (SEM) was performed with a JSM-5500LV instrument (JEOL, Japan). X-ray diffraction (XRD) analysis was performed using a Mini Flex II (Rigaku, Japan). The specific surface area of the adsorbent was measured using a NOVA4200e specific surface analyzer (Yuasa Ionic, Japan), while the amount of hydroxyl groups was measured using the fluoride ion adsorption method.13) The phosphorus distribution on the MFA1 was measured using an electron micro-analyzer (EPMA, JXA-8530F, JEOL, Japan) at a beam diameter and accelerating voltage of 5 µm and 15.0 kV, respectively. Electron spectroscopy for chemical analysis was carried out using an X-ray photoelectron spectroscopy system (AXIS-NOVA, Shimadzu Corp., Ltd., Japan).
MFA PreparationMg/Fe/Al hydroxides at different metal ratios were synthesized based on the methods used for the synthesis of the Mg–Fe–Al hydrotalcite-like compounds in the study by Wimonsong et al.,14) with a few modifications. MgCl2·6H2O, FeCl3·6H2O, and AlCl3·6H2O were used to prepare the Mg/Fe/Al hydroxides using four Mg : Fe : Al molar ratios of 2.5 : 0.5 : 1 (MFA1), 2.5 : 1 : 0.5 (MFA2), 2.5 : 1.5 : 0 (MF), and 2.5 : 0 : 1.5 (MA). MgCl2·6H2O, FeCl3·6H2O, or AlCl3·6H2O were dissolved in water in a second flask, and the pH of the solution was adjusted to 9.0. FeCl3 was then added and mixed with the MgCl2 solution. Subsequently, AlCl3 solution and 4.0 g of Na2CO3 were added to the Fe–Mg mixture and mixed vigorously. The precipitate was aged under reflux for 18 h at 90°C, and then filtered, washed thoroughly with deionized water, and dried overnight at 50°C.
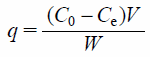
Amount of Phosphate Ions AdsorbedThe adsorbent was added to the phosphate ion solution. The suspension was shaken at 100 rpm for 24 h at 25°C. The sample was then filtered through a 0.45 µm membrane filter, and the filtrate concentration was measured using the iCAP-7600 analyzer (ICP-OES, Thermo Fisher Scientific Inc., Japan). The amount of adsorbed phosphate ions was calculated using Eq. (1) as shown below:
 | (1) |
Where, q is the amount of adsorbed phosphate (mg/g), C0 and Ce are the initial and equilibrium concentrations (mg/L), V is the solvent volume (L), and W is the weight of the adsorbent sample (g). The date were expressed as the mean ± standard error; n = 2 or 3.
Effect of the Solution pH on the Phosphate Ion AdsorptionThe adsorbent (0.05 g) was added to the phosphate ion solution (10 mmol/L, 50 mL) at different pH values (pH 2–13). The pH of the solution was adjusted by adding 0.1 and 1.0 mol/L hydrochloric acid or sodium hydroxide. The suspension was shaken at 100 rpm for 24 h at 25°C. The amount of adsorbed phosphate ions was calculated using Eq. (1).
Effect of the Temperature on the Phosphate Ion AdsorptionThe adsorbent (0.05 g) was added to the phosphate ion solution (0.1, 0.3, 0.5, 0.7, 1, 2, 3, 4, or 5 mmol/L, 50 mL). The sample solution was shaken at 100 rpm at 5, 25, and 45°C for 24 h at 100 rpm. The amount of phosphate adsorbed was calculated using Eq. (1).
Effect of the Contact Time on the AdsorptionThe adsorbent (0.05 g) was added to the phosphate ion solution (10 mmol/L, 50 mL). The sample solution was shaken at 100 rpm for 0.5, 0.75, 1, 3, 6, 10, 12, 15, and 20 h at at 25°C. The amount of phosphate adsorbed was calculated using Eq. (1).
Phosphate Adsorption and Desorption CapabilityThe adsorbent (0.25 g) was added to the phosphate ion solution (100 mmol/L, 250 mL). The sample solution was shaken at 100 rpm for 24 h at 25°C. The sample was then filtered, and the filtrate concentration was measured using the iCAP-7600 analyzer (ICP-OES, Thermo Fisher Scientific Inc., Japan). The amount of adsorbed phosphate was calculated using Eq. (1). Following adsorption, the adsorbent was collected, dried, and used for the desorption experiment. The collected adsorbent was added to a 250 mL solution of 10, 100, or 1000 mmol/L sodium hydroxide. The suspensions were shaken at 100 rpm for 24 h at 25°C and filtered through a 0.45 µm membrane filter. The amount of desorbed phosphate was calculated using Eq. (2) as shown below.
 | (2) |
Where, d is the amount of phosphate desorbed (mg/g), Ce is the concentration after desorption (mg/L), V is the solvent volume (L), and W is the weight of the adsorbent sample (g).
The adsorption/desorption cycle of MFA1 using 10 mmol/L sodium hydroxide was repeated three times. The adsorbent (0.25 g) was added to the phosphate ion solution (10 mmol/L, 250 mL). The amount of phosphate adsorbed was calculated using Eq. (2).
SEM images of the adsorbents are shown in Fig. 1. We did not observe any difference in the MFA series, whereas the FHT3.0 and FHT5.0 exhibited a round morphology lacking a perfect crystal boundary, which has previously been reported in the literature.15) The XRD patterns of the adsorbents are shown in Fig. 2. The patterns of the MFA series were completely different from those of the FHT series, which consisted of hydrotalcite-like layered double hydroxides. The basal reflections could be attributed to the (003) or (006) peaks, corresponding to the stacked brucite-like sheets.17) However, while none of those peaks could be attributed to the MFA series, the intensity of the distinctive (A) peak was considered to be proportional to the molar ratio of aluminum in MFA: it was from the aluminum compound. Additionally, the surface pH, specific surface area, and amount of hydroxyl groups of the adsorbents are shown in Table 1. The MFA1, MFA3, or MF had an acidic surface pH, while a neutral pH was seen otherwise. The specific surface area and amount of hydroxyl groups of MFA1, MFA2, MF, MA, FHT3.0, and FHT5.0 were 0.2, 35.4, 87.9, 11.5, 7.5, and 6.8 m2/g, and 2.4, 1.0, 0.3, 1.2, 1.6, and 1.7 mmol/g, respectively. The MFA1 had a greater amount of hydroxyl groups as compared to the other adsorbents.


| Samples | Surface pH | Specific suface area (m2/g) | Amount of hydroxyl groups (mmol/g) |
|---|---|---|---|
| MFA1 | 4.4 | 0.2 | 2.4 |
| MFA2 | 2.2 | 35.4 | 1 |
| MF | 2.5 | 87.9 | 0.3 |
| MA | 6.5 | 11.5 | 1.2 |
| FHT3.0 | 6.5 | 7.5 | 1.6 |
| FHT5.0 | 6.8 | 6.8 | 1.7 |
Figure 3 shows the amount of phosphate ions adsorbed on the MFA series and FHT, and the results of the pH dependent adsorption experiments in solutions with an initial pH value in the 2–13 range. The amount of phosphate ions that were adsorbed in the pH range 2.0–6.0 was greater than that at any other pH, which indicated that the adsorption was pH dependent. Furthermore, the amount of phosphate ions adsorbed onto the MFA1 at a pH of 4.0 was greater than the adsorption on other adsorbents, which indicates that the MFA1 is conducive for the adsorption of phosphate ions from aqueous solutions. Phosphate exists as H2PO4−, HPO42−, and PO43− depending on the pH of the solution, with pKa1 = 2.15, pKa2 = 7.2, and pKa3 = 12.33, respectively. Considering the pH range 2–6, HPO42− is the dominant phosphate ion near a pH 4.0 as the dominant phosphate species are H2PO4− and HPO42−. Thus, ion exchange occurs between HPO42− and the surface hydroxyl groups on the adsorbent (Fig. 4). Similarly, the adsorption behavior of the phosphate ions with respect to the other adsorbents has been reported in the literature.12) Increasing the pH (> pH 8.0) causes lesser ion exchange between HPO42− and the surface hydroxyl groups in aqueous solution, as the ratio of HPO42− decreases with an increase in the solution pH. Furthermore, we investigated the relationship between the phosphate adsorption on the MFA series and amount of hydroxyl groups (Fig. 5). The correlation coefficient between the amount of adsorbed phosphate ions and hydroxyl groups is 0.98, while the correlation between the amount of adsorbed phosphate ions and specific surface area is –0.95 (data not shown). The amount of phosphate ions adsorbed increased with an increase in the amount of hydroxyl groups and decrease in the specific surface area. The above results indicate that the phosphate ion adsorption with respect to the MFA series is related to the amount of adsorbent hydroxyl groups. The specific surface area has little contribution in the phosphate adsorption on the MFA, whereas the specific surface area and amount of adsorption are positively correlated in many adsorbents.11,12) Thus, the mechanism of phosphate ion adsorption on the MFA series differs from that seen in existing adsorbents, demonstrating that we were successful in developing a novel adsorbent for the phosphate ions from aqueous solutions.


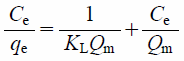
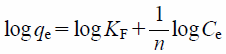
To investigate the phosphate ion adsorption capacity of MFA, quantitative analysis and isotherms of the phosphate ion adsorption onto the MFA1 surface are presented in Figs. 6 and 7, respectively. The phosphate ions adsorbed onto MFA1 increased with increasing temperatures. The adsorption data were fitted using the Langmuir (Eq. (3)) and Freundlich (Eq. (4)) models as shown below.
 | (3) |
 | (4) |
Where, Ce (mg/L) and qe (mg/g) are the equilibrium concentration of the adsorbate in the aqueous phase and equilibrium adsorption capacity, respectively, Qm (mg/g) is the maximum adsorption capacity, KL (mg/g) is the Langmuir adsorption equilibrium constant, n is the constant representing the Freundlich isotherm curvature, and KF is the Freundlich constant.18)


(Color figure can be accessed in the online version.)
The Freundlich and Langmuir constants for the adsorption of phosphate ions are listed in Table 2. The adsorption isotherm data at 25 and 45°C are in agreement with both the Langmuir (R2: 0.90–0.94) and Freundlich (R2: 0.85–0.94) isotherms. log KF (Freundlich constant) decreased with an increase in the temperature. The adsorbate is easily adsorbed when 1/n is in the range of 0.1–0.5, while adsorption becomes difficult when 1/n > 2.19) Our results (1/n: 1.55–1.61) indicate that the phosphate ion was adsorbed onto MFA1. Additionally, the Qm (7.96–9.19 mg/g) values tend to decrease with an increase in the temperature, which is in agreement with the adsorption isotherm data.
| Sample | Freundlich model | Langmuir model | |||||
|---|---|---|---|---|---|---|---|
| 1/n | log KF | R2 | KL (L/mg) | Qm (mg/g) | R2 | ||
| MFA1 | 5°C | 0.40 | 0.61 | 0.71 | 2.72 | 6.64 | 0.01 |
| 25°C | 1.55 | 0.31 | 0.94 | 0.07 | 9.19 | 0.94 | |
| 45°C | 1.61 | 0.21 | 0.90 | 0.16 | 7.96 | 0.85 | |
The amount of phosphorus on the surface of MFA1 (Fig. 7, the cold and warm colors represent low and high concentrations, respectively) increased following phosphate ion adsorption. This result indicates that the adsorption of the phosphate ion onto MFA1 depends on the properties of the adsorbent surface, where ion exchange between HPO42− and the surface hydroxyl groups occurs. Thus, we evaluated the binding energy before and after phosphorus adsorption (Fig. 8). The phosphorus peak (approximately 130 eV) was detected after the adsorption of the phosphate ions. These results demonstrate that phosphorus could be adsorbed onto MFA1 from an aqueous solution.

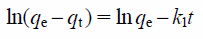
Kinetics of the adsorption of phosphate ions is shown in Fig. 9. Equilibrium adsorption was attained within 3 to 6 h for MFA1. The equilibrium adsorption capacity of the Zn–Al layered double hydroxides can be attained within 72 h, which has been reported previously.6) Thus, MFA1 is useful for the rapid removal of the phosphate ions in aqueous solution. The pseudo-first-order and pseudo-second-order kinetics models20) expressed in Eqs. (5) and (6), respectively were used to fit the experimental adsorption data.
 | (5) |
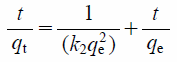 | (6) |
Where, k1 and k2 are the first-order and second-order apparent adsorption rate constants (1/h and g/mg/h), respectively, qt and qe are the amount of adsorbed phosphate ions (mg/g) at time t and equilibrium, respectively.21)

Kinetics parameters of the pseudo-first-order and pseudo-second-order models are listed in Table 3. It was found that the phosphate ion adsorption can be better described using the pseudo-second-order kinetics model (0.86), as its correlation coefficient was higher than that of the pseudo-first-order kinetics model (0.47). Additionally, the value of qe,exp was nearer to the qe,cal of the pseudo-second-order kinetics model than that of the pseudo-first-order kinetics model. These results are consistent with the chemical behavior of phosphate ion adsorption exhibited by other hydrotalcite-like adsorbents.22)
| Sample | qe,exp (mg/g) | Pseudo-first-order model | Pseudo-second-order model | ||||
|---|---|---|---|---|---|---|---|
| qe,cal (mg/g) | k1 (1/h) | R2 | qe,cal (mg/g) | k2 (g/mg/h) | R2 | ||
| MFA1 | 57.9 | 31.9 | 0.02 | 0.47 | 44.4 | 2.15 × 10⁻⁵ | 0.86 |
Recovery of the phosphate ions using sodium hydroxide at different concentrations is shown in Fig. 10. The desorption percentages for the phosphate ions at 10, 100, and 1000 mmol/L are 16.4, 20.7, and 12.4%, respectively. In this study, the amount of desorbed phosphate ions did not change much with the concentration of sodium hydroxide. Thus, we believe that a 10 mmol/L sodium hydroxide concentration is sufficient to achieve phosphate desorption from MFA1. The repeated adsorption and desorption of the phosphate ions using a 10 mmol/L sodium hydroxide concentration is shown in Fig. 11. The experiment demonstrates that MFA1 can be recovered using sodium hydroxide solution, and the recovered MFA1 can be recycled. The total amounts of adsorbed and desorbed phosphate were 5.7 and 4.3 mmol/g, respectively, with a recovery percentage of 75% using 10 mmol/L sodium hydroxide. In general, the adsorption capacity decreased in the adsorption/desorption cycles. However, in the case of MFA1 in our study, the amount of phosphate ions adsorbed on MFA1 did not decrease much, which indicates that MFA1 can be used repeatedly. Additionally, the amount of phosphate ion desorption increased with an increase in the number of cycles. These results indicate that MFA1 can be reused and recovered for phosphate ion adsorption using sodium hydroxide solution as an eluent, demonstrating its application/utility as a renewable adsorbent.

■: adsorption, □: desorption.

■: adsorption, □: desorption.
Comparisons between the phosphate ion adsorption capacities of the various adsorbents are listed in Table 4.5–11) The phosphate ion adsorption capacity of MFA1 is higher than that of the reported adsorbents, indicating that MFA1 can be repeatedly used for the adsorption of phosphate ions.
| Adsorbents | Adsorption capacity (mg/g) | Temperature (°C) | Initial concentration (mg/L) | Contact time (h) | Adsorbent (g/L) | Reference |
|---|---|---|---|---|---|---|
| HUD zeolite | 48.5 | Room temperature | 100 | 168 | 1 | 5) |
| Fe–Bentnite | 4.84 | Room temperature | 20 | 6 | 4 | 6) |
| Zn–Al double hydroxide | 25.0 | Room temperature | 16 | 24 | 0.4 | 7) |
| Al hydroxide gel | 29.3 | Room temperature | 127 | 15 | 2 | 8) |
| Mg/Fe double hydroxide | 15.5 | Room temperature | 100 | 24 | 5 | 9) |
| Fe-Doped activated carbon | 14.1 | Room temperature | 20 | 24 | 2 | 10) |
| Calcined Ni hydroxide | 17.4 | Room temperature | 100 | 24 | 2 | 11) |
| Fe–Mg hydrotalcite (FHT3.0) | 43.6 | Room temperature | 300 | 24 | 1 | This study |
| Fe–Mg hydrotalcite (FHT5.0) | 27.7 | Room temperature | 300 | 24 | 1 | This study |
| MFA1 | 53.6 | Room temperature | 300 | 24 | 1 | This study |
In summary, we prepared novel Mg/Fe/Al hydroxides (MFA) at various ratios and evaluated the adsorption of phosphate ions from aqueous solutions. The degree of crystallinity in the MFA series was completely different from that of the FHT3.0 and FHT5.0. The amount of phosphate ions that were adsorbed onto the MFA series and FHT was pH dependent, with the amount of adsorption on MFA1 at a pH of 4.0 being greater than that seen in the other adsorbents (1.6 mmol/g or 53.6 mg/g). Additionally, the amount of surface hydroxyl groups of MFA1 was greater than that in the other adsorbents (2.4 mmol/g). The strong correlation (coefficient of 0.98) between the amount of adsorbed phosphate ions and surface hydroxyl groups indicates the occurrence of ion exchange on the MFA1 between HPO42− and the surface hydroxyl groups. The adsorption isotherm data were fitted using both the Freundlich and Langmuir models, with the adsorption kinetics following the pseudo-second-order model. Additionally, the adsorbed phosphate ions on MFA1 were desorbed using sodium hydroxyl solution with a total recovery percentage of 75%. We also observed that the phosphate ion adsorption capacity of MFA1 was higher than that reported for the other adsorbents. In conclusion, the results from this study demonstrate that the novel MFA adsorbent offers great potential for phosphate ion adsorption from aqueous solutions.
The Research Foundation for Pharmaceutical Sciences.
The authors declare no conflict of interest.