Abstract
The time-domain NMR technique was utilized to monitor precisely the physicochemical stability of indomethacin (IMC) nanosuspensions using T2 relaxation time (T2). We investigated whether T2 values can distinguish between agglomeration and sedimentation. Nanosuspensions of IMC were prepared using aqueous wet bead milling with polyvinylpyrrolidone as a stabilizer. Prepared nanosuspensions were divided into two fractions: one was stored in the NMR equipment for continuous T2 measurements and the other was stored in the dispersion analyzer. Measurements of both nanosuspensions were carried out, without dilution, over a period of 24 h at 10-min intervals. Transmission profiles based on multilight scattering technology showed that agglomeration predominantly occurred at 25 and 35 °C immediately after wet bead milling up to 4 h, followed by sedimentation from 4 to 24 h. Upon measuring the T2 relaxation, T2 values at both 25 and 35 °C showed a two-step change—there was a significant prolongation in T2 values immediately after preparation of nanosuspensions up to approx. 4 h and a gradual prolongation in T2 values from approx. 4 to 24 h. Considering the results of transmission profiles, these two-step T2 changes correspond to agglomeration and sedimentation. In other words, this study established that monitoring the T2 values of nanosuspensions could be used to evaluate the agglomeration and sedimentation of contained drug particles. This technique does not directly observe the nanoparticles themselves, but the water molecules. Thus, measurement of T2 relaxation is considered to be a general-purpose technique, independent of the type of drug or polymer.
Introduction
A low-field NMR instrument is usually specialized in terms of measuring 1H-NMR relaxation. The technique of relaxation measurement using low-field NMR is often referred to as time-domain NMR (TD-NMR).1–3) In the field of surface chemistry, the characterization of inorganic suspensions has been conducted using the TD-NMR technique. For example, it has been used to investigate not only surface area measurements of silica and carbon nanoparticles in liquid form4,5) but also in the crystalline form,6) the functional group,7) and the pore distribution8) of inorganic nanoparticles in liquid. When using TD-NMR for nanosuspensions, it does not usually record the NMR signal of the drug itself in the solid state but rather it records the NMR signal of the medium (water or solvent molecules). In a pioneering work in pharmaceutical science, the aggregation of proteins was evaluated by measuring the NMR relaxation of water.9–11)
The focus of the present study was to monitor the physicochemical stability of drug particles in nanosuspension by considering T2 relaxation time (T2) values, using the TD-NMR technique. In particular, we focused on whether T2 can distinguish between agglomeration and sedimentation. First, T2 relaxation was measured at 10-min intervals, while the nanosuspensions were stored at 15, 25, and 35 °C, to investigate the physicochemical stability. Temperature is one of the crucial factors affecting a suspension’s physicochemical stability. Next, to clarify the cause of the change in T2 values, the same nanosuspensions used for the T2 measurements were evaluated for transmittance using a dispersion analyzer.
Experimental
MaterialsIndomethacin (IMC) was purchased from Tokyo Chemical Industry (Tokyo, Japan). Polyvinylpyrrolidone (PVP, Kollidon 30) was kindly gifted by BASF (Ludwigshafen, Germany).
Preparation of NanosuspensionsNanosuspensions of IMC (1% (w/w)) were prepared by aqueous wet bead milling. PVP dissolved in purified water (1% (w/v)) was used as a stabilizer. Amorphous IMC was prepared using the melt-quenching method. Crystalline IMC was placed on a heated Al plate at approx. 160 °C for a few minutes. The melts were exposed to quench cooling by immersion in liquid nitrogen. The resulting samples were ground in an agate mortar. The amorphous IMC powder was added to the stabilizer solution and milled for 12 h with a commonly used vortex mixer. Zirconium beads (0.5 ± 0.1 mm) were used as the grinding agent: ratio beads/solution 3 : 1 (w/v). After preparation, a sample of the nanosuspension was withdrawn with a pipette, and used for T2 relaxation and dispersion analyzer measurements, without further dilution.
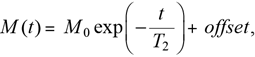
Time-Domain NMRThe 1H T2 relaxation curves of the samples were measured, without dilution, using a Bruker Minispec mq20 instrument (Bruker BioSpin, Billerica, MA, U.S.A.) at a 1H frequency of 20 MHz at 25 °C. One-shot T2 data were acquired using a standard Carr–Purcell–Meiboom–Gill (CPMG) sequence, developed in the 1950s. The acquisition parameters were as follows: number of scans = 8, time between each pulse (τ spacing) = 3.5 ms, total echoes = 3000, recycle delay = 11 s, and dummy shot = 1. A one-shot CPMG sequence was repeated every 10 min. The 1H T2 relaxation time (T2) was calculated from the T2 relaxation curve using TD-NMR Analyze software (Bruker BioSpin). The T2 relaxation data were calculated according to a single-exponential curve fitting (Eq. 1):
 | (1) |
where M(t) and M0 are the transverse magnetizations at times t and 0 with a single-exponential decay, respectively, and T2 is the T2 relaxation time.
Transmission Profiles Determined Using a Dispersion AnalyzerThe test suspensions were set in a dispersion analyzer (ST-1; Eko Instruments, Tokyo, Japan), based on multilight scattering technology, with a laser at a wavelength of 870 nm. Measurements of the transmission profiles of the samples were performed at 15, 25, and 35 °C under shading. For each measurement, the sample vial was scanned in a vertical direction by moving the measuring probe from the bottom to the top. The measurement was repeated at specified intervals, and then continuous monitoring of the suspension was performed.
Results
Monitoring of T2 Relaxation Time during Storage PeriodsNanosuspensions with the same physical properties were successfully prepared and then used in experiments for each storage temperature (Supplementary Table S1). The T2 relaxation was measured while the prepared nanosuspensions were stored at 15, 25, and 35 °C. Figure 1 shows representative T2 relaxation curves for the initial, 4 and 24 h at 25 °C storage. The T2 relaxation of a nanosuspension decayed more quickly than the T2 relaxation of water. After storage at 25 °C for 4 and 24 h, the T2 relaxation curves appeared to be almost the same as the initial. To monitor the T2 relaxation over the storage period in more detail, the T2 value (the time constant of T2 relaxation) was calculated by fitting the T2 relaxation curve to Eq. (1). The fitting was good for all nanosuspensions (Supplementary Fig. S1).
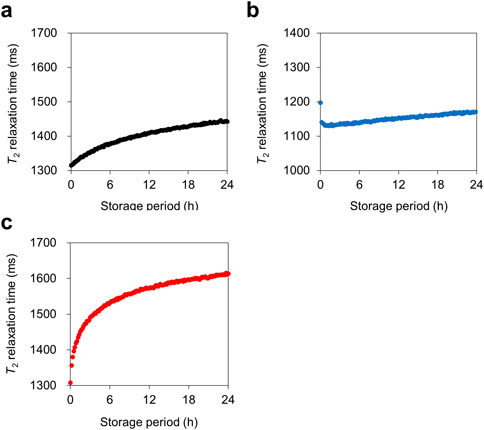
Figure 2 shows the change in T2 values over time when the nanosuspensions were stored at 15, 25, and 35 °C. When stored at 25 and 35 °C, the change in T2 values was a two-step change over time; the T2 values increased rapidly from initial until approx. 4 h, then slowly increased from 4 to 24 h (Figs. 2a, c). The plots of the T2 values were differentiated with time to determine the storage period at which the rate of T2 change became slower. At 25 °C storage, the rate of change in the T2 values became slower at approx. 4–6 h (Supplementary Fig. S2). In contrast to storage at 25 and 35 °C, upon storage at 15 °C the change in T2 values was monotonically prolonged (Fig. 2b). Regarding initial storage, i.e., at 0 h, the T2 values for the nanosuspensions of 15, 25, and 35 °C storage were 1197, 1316, and 1308 ms, respectively. The T2 values for the nanosuspension stored at 15 °C were lower than the others, probably due to the lower temperature of the nanosuspension. In other words, it might be because it took longer to run the pulse sequence after the nanosuspension was inserted into the NMR instrument.
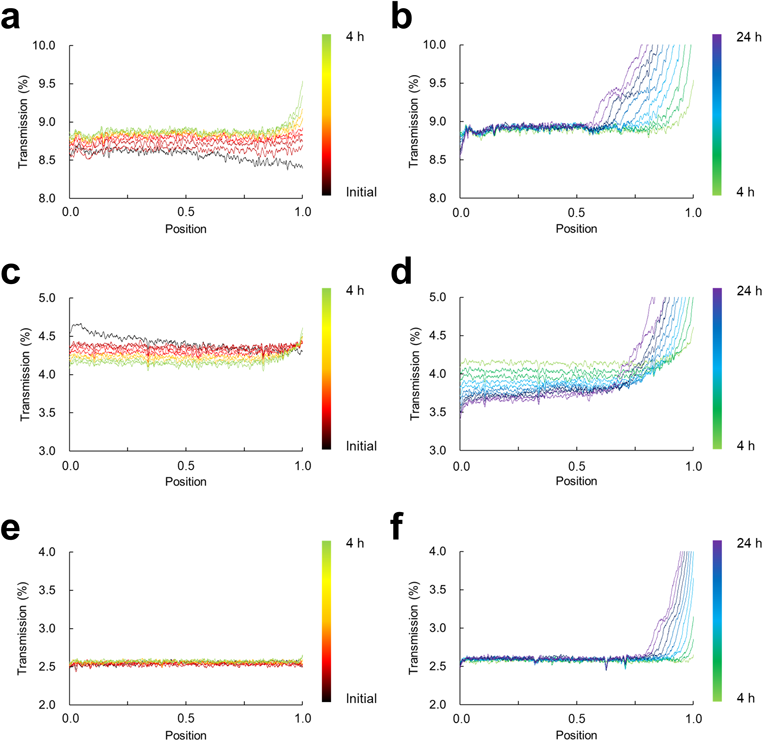
Measurement of Transmission Profiles of Nanosuspensions during the Storage Period Using a Dispersion AnalyzerThe transmission profiles of the same nanosuspensions used for the T2 relaxation measurements were measured using a dispersion analyzer, without dilution. For storage at 25 °C, there was a slight and uniform increase at every sample position in the transmission signals from initial to 4 h (Fig. 3a). This transmission profile of a slight and uniform increase was consistent with the findings of our previous study and corresponded to agglomeration.12) Thereafter, from 4 to 24 h the transmission signals increased at the top of the sample (Fig. 3b).
From initial to 24 h, the transmission profile for 35 °C storage was almost the same as for 25 °C storage (Figs. 3c, d). However, the change direction was opposite to the case of the 25 °C storage. In contrast, for 15 °C storage no changes corresponding to agglomeration such as those seen for storage at 25 and 35 °C were observed, and the transmission profile for 15 °C storage showed a change from initial to 24 h that corresponds to particle sedimentation; i.e., the transmission signals increased at the top of the sample (Figs. 3e, f).
Discussion
The changes in T2 values at 25 and 35 °C are now discussed. The T2 values at both temperatures showed two-step T2 changes; that is, there was a relatively significant prolongation in T2 values immediately after preparation to approx. 4 h and a gradual prolongation in T2 values after approx. 4 h (Figs. 2a, b). Transmission profiles were obtained to confirm the type of destabilization during storage. The characteristic transmission profiles from initial to 4 h would indicate the formation of agglomerates13,14) (Fig. 3a). For storage at 35 °C, a slight and uniform decrease was also observed from initial to 4 h, and the change direction was opposite to the direction during storage at 25 °C (Fig. 3c). To investigate the cause of these results, the size of the primary particles of the nanosuspension before and after storage, diluted 10-fold with water, was measured using dynamic light scattering (DLS). As a result, no change in particle size and size distribution was observed (Supplementary Fig. S3). Therefore, the change from initial to 4 h is presumed due to soft agglomerates, not Ostwald ripening with a change in primary particle size. In addition, although this study could not clarify the cause of this opposite direction change, the reports showed the opposite direction change of transmission profiles.13,15)
Regarding the T2 values for storage at 25 and 35 °C (Figs. 2a, c), the increase in T2 values from initial to approx. 4 h would be mainly driven by a decrease in the specific surface area of all particles in the system; in other words, the formation of agglomerates, as described in our previous study.12) It is known that the T2 relaxation measured using the CPMG sequence investigates the molecular mobility of water in a nanosuspension. In a water suspension system, protons within water molecules bound to a particle surface have smaller T2 values, because the motion of bound water becomes anisotropic and more restricted.16) When the specific surface area decreases, the probability of bound water on the particle surface decreases, and the molecular mobility of whole water in the system increases17)—consequently, the T2 value becomes greater. Thus, it is rational that the T2 value of a nanosuspension was prolonged at both 25 and 35 °C, up to approx. 4 h.
Next, we discuss the T2 changes of nanosuspensions from approx. 4 to 24 h. In all cases, the T2 values showed a gradual prolongation, and the transmission profiles from 4 to 24 h would indicate particle sedimentation.18) The reason for the prolonged T2 values for the sedimentation probably derives from the inhomogeneity of the magnetic field of the NMR instrument. In this study, the nanosuspension was placed as follows: the bottom of the sample was positioned at an approximate lower limit of the detection region of the NMR signal. Upon particle sedimentation, the proportion of free water molecules would increase at the center of the detection region, where the magnetic field is stronger. In other words, the prolonged T2 values may be observed as the ratio of detectable free water molecules is increased. Taraban and Yu also evaluated the sedimentation of vaccine adjuvants by observing the T2 relaxation of water.19) They found an increase in T2 values during the storage period. Hence, the increase in T2 values detected in this study is considered to be rational. In addition, to investigate whether the degree of agglomeration and sedimentation varied with temperature: the nanosuspensions prepared separately from Figs. 1–3 were stored for 24 h at each temperature, then adjusted to 25 °C, and T2 relaxation was measured. The T2 values were 1333, 1425, and 1540 ms for 24 h storage at 15, 25, and 35 °C, respectively. Because the relaxation time was prolonged at higher storage temperatures, the degree of agglomeration and sedimentation might be more significant at higher storage temperatures.
We also checked the hypothesis, other than the agglomeration and sedimentation, regarding whether the crystallinity or particle morphology was considered a major reason for the change of T2 values shown in Fig. 2. Lyophilized powder was prepared from the nanosuspensions that had been stored at 15, 25, and 35 °C for 24 h. The crystallinity of the lyophilized powder was evaluated using powder X-ray diffraction (Supplementary Fig. S4). Before storage, the lyophilized powder showed a halo pattern with unresolved peaks at 8.3° and 11.6°, which were consistent with a part of the α pattern of IMC. In contrast, after storage at 15, 25, and 35 °C for 24 h, the lyophilized powder showed similarly resolved peaks, which were also consistent with the α pattern of IMC. In other words, storage at each temperature increased the crystallinity of IMC; however, the degree of increased crystallinity was the same for 15, 25, and 35 °C storage. If the change in T2 values in Fig. 2 was due to the crystallinity of IMC, the difference between the change in T2 values for 15, 25, and 35 °C storage could not be explained. Hence, the crystallinity of IMC would not be the major reason why the T2 values shown in Fig. 2 varied differently with storage temperature. In addition, the morphology of IMC particles was evaluated using a transmission electron micrograph (TEM) image (Supplementary Fig. S5). The TEM images for initial and 15, 25, and 35 °C for 24 h storage showed needle-like particles composed of smaller rod-shaped particles in each, consistent with the particle size determined using DLS (Supplementary Fig. S3). The morphology of IMC particles was not dependent on the storage temperature. Thus, the morphology of IMC also would not be the major reason for the temperature-dependent difference in the T2 values in Fig. 2.
Conclusion
This study established that continuous monitoring of the T2 values of nanosuspensions could be utilized to evaluate not only agglomeration but also sedimentation of contained IMC particles, using the TD-NMR technique.
Acknowledgments
This work was supported by the Japan Society for the Promotion of Science (JSPS) KAKENHI [Grant Nos. 20K06986, 20K15970, and 22K15261].
Conflict of Interest
The authors declare no conflict of interest. The Laboratory of Pharmaceutical Technology, University of Toyama, is an endowed department supported by an unrestricted Grant from Nichi-Iko Pharmaceutical Co. (Toyama, Japan).
Supplementary Materials
This article contains supplementary materials.
References
- 1) Stueber D., Jehle S., J. Pharm. Sci., 106, 1828–1838 (2017).
- 2) Schumacher S. U., Rothenhausler B., Willmann A., Thun J., Moog R., Kuentz M., J. Pharm. Biomed. Anal., 137, 96–103 (2017).
- 3) Akhunzada Z., Wu Y., Haby T., Jayawickrama D., McGeorge G., La Colla M., Bernstein J., Semones M., Abraham A., J. Pharm. Sci., 110, 2765–2770 (2021).
- 4) Takai-Yamashita C., Sato E., Fuji M., KONA Powder Part. J., 37, 233–243 (2020).
- 5) Fairhurst D., Cosgrove T., Prescott S. W., Magn. Reson. Chem., 54, 521–526 (2016).
- 6) Tawfilas M., Mauri M., De Trizio L., Lorenzi R., Simonutti R., Langmuir, 34, 9460–9469 (2018).
- 7) Yuan L., Chen L., Chen X., Liu R., Ge G., Langmuir, 33, 8724–8729 (2017).
- 8) Ohkubo T., Yamazaki A., Fukatsu Y., Tachi Y., Microporous Mesoporous Mater., 313, 110841 (2021).
- 9) Feng Y., Taraban M. B., Yu Y. B., Chem. Commun., 51, 6804–6807 (2015).
- 10) Taraban M. B., DePaz R. A., Lobo B., Yu Y. B., Anal. Chem., 89, 5494–5502 (2017).
- 11) Taraban M. B., DePaz R. A., Lobo B., Yu Y. B., Anal. Chem., 91, 4107–4115 (2019).
- 12) Okada K., Hayashi Y., Kumada S., Onuki Y., Eur. J. Pharm. Sci., 164, 105908 (2021).
- 13) Sun Y., Deac A., Zhang G. G. Z., Mol. Pharm., 16, 877–885 (2019).
- 14) Daoud-Mahammed S., Couvreur P., Gref R., Int. J. Pharm., 332, 185–191 (2007).
- 15) Kim H.-S., Park W.-I., Kang M., Jin H.-J., J. Phys. Chem. Solids, 69, 1209–1212 (2008).
- 16) Cooper C. L., Cosgrove T., van Duijneveldt J. S., Murray M., Prescott S. W., Langmuir, 29, 12670–12678 (2013).
- 17) Cooper C. L., Cosgrove T., van Duijneveldt J. S., Murray M., Prescott S. W., Soft Matter, 9, 7211–7228 (2013).
- 18) Muthurania K., Ignatius A. A., Jin Z., Williams J., Ohtake S., J. Pharm. Sci., 104, 3770–3781 (2015).
- 19) Taraban M. B., Yu Y. B., Magn. Reson. Chem., 59, 147–161 (2021).