Materials and Methods
Tilapia wastes Approximately 50 kg of whole tilapia were obtained from farm of the municipality of the Rio de Janeiro, Brazil. The samples were harvested twice (25 kg each), characterizing two biological replicates for all treatments. The fishes were harvested in the same period (August) to avoid any effects of seasonal variations such as ambient temperature, humidity, and precipitation. The mean weights of the first and second harvest were 619 (± 52) and 622 (± 49) g for whole fish, respectively, and the mean weights of the first and second harvest were 173 (± 9) and 175 (± 11) g for filleted fish, respectively. The mean weights of the two harvests of samples did not significantly differ. After the filleting process, wastes were transferred to a processing plant. Heads and carcasses (fishbone after filleting, without head, guts and fins) were weighed and placed separately in a depulper to obtain pulps. These products were placed in a polyethylene bag, weighed, sealed, kept on ice (0 ± 1°C) and transported to the laboratory. The period from harvest to arrival to the laboratory did not exceed three hours.
Preparation of flours and instant soup Flour preparation was performed according Stevanato et al. (2008) and Stevanato et al. (2010) with modifications based on previous experiment (data no shown). The pulps of heads and carcasses were placed separately into proper recipient containers (layers of approximately 1 cm) and were subjected to heating in conventional oven with controlled temperature (180°C) for 100 min, and then the mass formed during this process was milled in a multiprocessor for two min. Subsequently, a second heating (200°C for 40 min) and milling procedures were repeated to obtain, separately, head (HF) and carcass (CF) flours. Next, the carcass and head flours were mixed in a 7:1 ratio, based on previous experiment (data no shown). This mix was placed again in a multiprocessor for the same time as described above to obtain the head and carcass flour (HCF). The primary product(instant soup) was obtained by addition of ingredients into the head and carcass flours (Table 1). The products were labeled HF (Head Flour), CF (Carcass Flour), HCF (Head and Carcass Flour), and IS (Instant Soup from flour made with heads and carcasses).
Processing yield The whole fish, tilapia heads, tilapia carcasses, head pulp, carcass pulp, head flour, carcass flour, head and carcass flours, and instant soup were weighed. The processing yield was calculated from weight of each waste or final products multiplied by 100 and divided by the weight of their precursor product (Rutten et al., 2004). Four analytical replicates were performed for each treatment and mean value was calculated.
Proximate composition, Aw and pH Aw was measured with a Pawkit water activity meter (Decagon Devices, Pullman, WA, USA) in accordance with the manufacturer’s instructions. Moisture, protein, lipids and ash content were performed according to the specifications of the Association of Official Analytical Chemist Techniques (AOAC, 2000). For the instant soup, analysis of total simple carbohydrate was performed according to the methodology proposed by the Adolfo Lutz Institute (Brazil, 2008), whereas for all flours, the carbohydrate level was calculated by difference following the equation % carbohydrates = 100% − (% protein + % lipid + % moisture + % ash) (Merrill and Watt, 1973). Four analytical replicates were performed for each treatment.
Table 1.
Formulation of instant soup produced from tilapia wastes (
Oreochromis mloticus).
| Ingredients |
% |
| Head flour |
3.0 |
| Carcass flour |
21.0 |
| Modified starch |
6.7 |
| Salt |
3.4 |
| Maltodextrin |
53.0 |
| Onion powder |
9.0 |
| Garlic powder |
3.9 |
The pH values were measured after homogenization of each 10 g of muscle sample in 90 mL of distilled water (Conte-Jünior et al., 2008). A digital pH meter (Digimed® DM-22) equipped with a DME-R12 electrode (Digimed®) was used. Six analytical replicates were performed for each treatment.
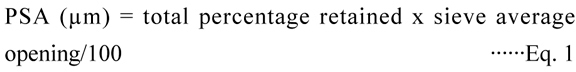
Particle size distribution, particle size average, water absorption and solubility indices For particle size distribution analysis, a test sieving procedure was performed with a Granutest (Produtest®) according to the method of Eduardo and Lannes (2007). The samples (100 g) were placed on the equipment, and the sieve opening sizes were 1000, 500, 250, 125, and 62 μm. A semi-analytical balance with 0.001 g precision was used for quantification of mass retained in the sieves. The results were obtained from the mean of four analytical replicates made for each parameter and treatment. The particle size average (PSA) was calculated using the following equation:
 | Eq. 1 |
Water absorption and water solubility indices were determined according to Sosulski (1962) and Anderson (1969), respectively. The water absorption and water solubility index values were obtained from the mean of four analytical replicates made for each sample on each parameter.
Instrumental texture analysis Compression force was measured by using a texture analyzer model TA.XT plus (Stable Micro System, Surrey, UK) and analyzed by Texture Expert for Windows (R, Stable Micro System). The samples were placed into a cylindrical acrylic cup with a maximum volume of 30 mL, and a compression disk (25 mm diam.) was used. The test was conducted under the following conditions: pre-test speed, 10 mm/s; test speed, 2 mm/s; post-test speed, 10 mm/s; time between compressions, 5 s; distance, 5 mm; and compression 50% of original sample weight. The sample was deposited into the sample container and a compression test extruded the product up and around the edge of the disk, according to Eduardo and Lannes (2007) with modifications. Ten analytical replicates were performed for each treatment and the results were averaged.
Instrumental color analysis Color parameters were measured at four random locations on the surface of each sample (eight analytical replicates for each treatment) using a Konica Minolta CR-400 colorimeter (Konica Minolta Sensing, Osaka, Japan) that was previously calibrated with illuminant D65, a 8-mm diameter aperture, and a 2° standard observer (AMSA, 2012). The results are expressed in L* (lightness; 0 = black, 100 = white), a* (+ a* = redness, − a* = greenness) and b* (+ b* = yellowness, − b* = blueness) values.
Statistical analysis Physical and chemical parameters were analyzed using one-way ANOVA at 95% of confidence level; data was further analyzed using Tukey test when means were considered different (P < 0.05; GraphPad Prism®, (GraphPad Software, San Diego, California, USA). In addition, Principal component analysis (PCA) and Pearson’s correlation were performed to correlate the results of physical and chemical analyses, except for processing yield data. Instrumental color and texture were analyzed using PCA, Pearson’s correlations and PLSR. Partial least square regression (PLSR) was used to explore the relationships between the same data. PCA, PLS and Pearson’s correlation were performed using XLSTAT version 2012.6.08 (Addinsoft, Paris, France) software.
Results and Discussion
Processing yield Table 2 shows the processing yield of different products. Rutten et al. (2004) evaluated tilapia samples with a 700 g average weight and found a fillet yield ranging between 34.5 to 37.8%. Peterman and Phelps (2012) studied tilapia where the weight of pre-processed fish ranged from 403.8 to 434.2 g and concluded that the fillet yield was between 29.6 to 33.1%. Variations between these results were observed and can be explained by differences in food intake, diet, size, age, sex, season of capture and environmental conditions (Sulieman and James, 2011).
Table 2.
Processing yield of different products manufactured from tilapia wastes (
Oreochromis mloticus).
| Products |
Weight (kg) |
Processing yield (%)* |
| Whole fishes |
25.280 |
------ |
| Fish fillets |
7.100 |
28.09 |
| Heads |
4.230 |
16.73 |
| Carcasses |
7.280 |
28.80 |
| Head pulp |
2.750 |
65.01 |
| Carcass pulp |
7.250 |
99.59 |
| Head flour |
0.572 |
20.80 |
| Carcass flour |
2.080 |
28.69 |
| Head and carcass flours |
2.376 |
89.59 |
| Instant soup |
9.898 |
416.58 |
* Processing yield was calculated from weight of each wastes or final products multiplied by 100, and divided by their precursor product (Rutten
et al., 2004).
Most authors have evaluated whole fish weight and fillet weight, with little data concerning head and carcass yields in literature (Peterman and Phelps, 2012; Rutten et al., 2004). There are no reports concerning yields of head pulp, carcass pulp, head flour, carcass flour, flour of head and carcass, and instant soup. However, our results (Table 2) suggest that the transformation of heads and carcasses into pulps and flours is a viable alternative for the food industry, after taking into account its possible use as ingredient and easy processing, handling and storage. Soup yield was 416%, probability, due to ingredients added, suggesting the potential of this product to improve profitability in the food industry.
Proximate composition Table 3 shows the protein, lipid, ash, moisture and carbohydrate content. HF had the highest lipid level, lowest protein and moisture content and intermediate values of carbohydrates compared with other products. No difference (P > 0.05) was observed in protein and moisture values among CF, HCF, and IS. Instant soup displayed lower lipid content and higher carbohydrate levels, whereas CF and HCF had intermediate values of these compounds compared with other treatments. HF and IS displayed higher ash content than CF and HCF.
Table 3.
Proximate composition of flours and instant soup produced from tilapia wastes (
Oreochromis mloticus).
| Composition (%) |
Treatments |
| HF |
CF |
HCF |
IS |
| Proteins |
38.52b |
49.22a |
48.00a |
46.44a |
| Lipids |
51.62a |
38.23b |
42.96b |
10.98c |
| Ash |
4.54a |
3.54b |
3.80b |
4.67a |
| Moisture |
3.02b |
7.84a |
7.27a |
6.37a |
| Carbohydrates |
2.34c |
1.10b |
0.85b |
21.84a |
HF (Head Flour), CF (Carcass Flour), HCF (Head and Carcass Flours) and IS (Instant Soup).
Different letters in the same line indicate significant differences (P < 0.05).
Our findings indicated that all flours and instant soup had higher nutritional value when compared with several types of flours reported previously in the literature (Kaur et al., 2013; Skendi et al., 2010), including gluten-free products (Hager et al., 2012).
Hager et al. (2012) studied the nutritional value of commercial gluten-free flours from different botanical sources (quinoa, sorghum, corn, rice, and oats) and concluded that even though most gluten-free products are based on rice or corn flour, other flours especially teff or quinoa and buckwheat present a higher nutritional value. Nevertheless, quinoa flour was higher in protein (13.5%), ash (2.43%) and fat (8.59%) and lower in carbohydrates (48.88%).
Even with the high amount of lipids, quinoa flour has been widely used. This fact enhances the viability of using the fish flours, which have high fat content, where most of the lipid fraction in tilapia wastes includes essential fatty acids, largely omega-3 fatty acids, which have been demonstrated to reduce cardiovascular disease risk, decrease cholesterol levels, and act as cancer prevention agents in humans (Stevanato et al., 2010). Moreover, studies showed that the omega-3 fatty acid content and the n-6/n-3 ratios is proved to be satisfactory and within the recommended levels, even using steam-cooked for 25 minutes and drying in oven for 4 hours at 180°C to tilapia flour preparation (Stevanato et al., 2008).
According to our findings, there were differences in proximate composition between the products. This suggests that the flours from tilapia wastes may be incorporated in ingredients generally used by the food industry, but each ingredient should be evaluated separately in several products by testing various concentrations. Moreover, instant soup exhibited low lipid levels and high protein and ash content, representing an easy-to-prepare and nutritious food for current consumers.
Aw and pH Table 4 shows the Aw and pH in flours and instant soup from tilapia wastes. No difference (P > 0.05) was observed for the water activity values among all treatments.
There is a lack of information about water activity in flours and soups from fish, but our results can also be compared with flours from vegetal matrices. The products manufactured from tilapia wastes displayed lower Aw than two types of wheat flour (Aw = 0.96) studied by Skendi et al. (2010). Levels of Aw below 0.40 may accelerate the Maillard reaction (a common feature of intermediate moisture foods), and levels above 0.70 may lead to fungal development in flours (Shankar et al., 2010). According to our results, all products from tilapia displayed Aw values outside of these values (Table 4), suggesting a lower probability of fungal contamination and the Maillard reaction than conventional flours.
Instant soup (IS) had a lower pH than HF, CF, and HCF, and no difference (P > 0.05) was observed in pH values among all flours. This parameter is relevant due its relation to water solubility indices, where authors have affirmed that a higher water solubility index (WSI) is reached in higher pH values (Sreerama et al., 2012; Tivana et al., 2013). However, these findings are inconsistent with our results, which indicated an inverse relation between pH and WSI, most likely because the solubility parameter may be influenced by other factors such as temperature and water content (Yu et al., 2012).
Table 4.
Physical and chemical analysis in flours and instant soup produced from tilapia wastes (
Oreochromis mloticus).
| Analysis |
Treatments |
| HF |
CF |
HCF |
IS |
| Water activity |
0.63a |
0.57a |
0.53a |
0.50a |
| pH |
6.12a |
6.08a |
6.07a |
5.71b |
| WAI (%) |
271.5c |
344.6b |
356.4b |
477.3a |
| WSI (%) |
6.55c |
8.85b |
9.65b |
52.20a |
| Particle distribution (%)* |
77.94a |
50.88b |
33.17c |
19.59d |
| Particle size average (μm) |
810. 7a |
740.9b |
722.4c |
416.3d |
| Compression force (g) |
994.0a |
486.0b |
246.0b |
219.0b |
| L* |
23.70C |
34.32b |
32.74b |
70.22a |
| a* |
6.24c |
11.13a |
10.50a |
8.85b |
| b* |
4.13b |
17.15a |
14.74a |
14.45a |
HF (Head Flour), CF (Carcass Flour), HCF (Head and Carcass Flours) and IS (Instant Soup).
WAI = Water absorption index; WSI = Water solubility index.
L* (Lightness), a* (redness) and b* (yellowness).
Different letters in the same line indicate significant differences (P < 0.05).
* Percentage of particle distribution was measured on the 1000 μm sieve.
Water absorption and solubility indices Instant soup (IS) displayed higher (P < 0.05) WAI and WSI than HF, CF, and HCF, whereas HF displayed the lowest (P < 0.05) WAI and WSI (Table 4), most likely due to higher lipid content (Table 3) compared with the other treatments. Nonpolar molecules such as lipids have low solubility in water due to the high number of hydrophobic groups on their structure (Pohorille and Pratt, 2012). No difference (P > 0.05) was observed in WAI and WSI between CF and HCF.
In agreement with our results, Sreerama et al. (2012) reported that water solubility increased according to the increase in the water absorption index (Table 4). Nevertheless, the tilapia products displayed higher WAI and WSI than conventional flours (Andualem and Gessesse, 2013; Gujral et al., 2013; Skendi et al., 2010; Sreerama et al., 2012). The high WAI of flours and instant soup from tilapia wastes can be attributed to the presence of higher amount of protein and lower moisture and water activity with respect to conventional flours (Hager et al., 2012; Skendi et al., 2010).
According to Singh (2001), water absorption characteristics represent the ability of a product to associate with water under conditions where water is limiting. Moreover, a high amount of protein leads to an increase water-holding capacity due to the hydrophilic characteristics of proteins (Moroishi et al., 2013). Yu et al. (2012) reported that the highest water absorption index values were associated with the highest levels of protein addition in corn flours.
In relation to the water solubility index, instant soup displayed the highest WSI compared to flours this study and those found in literature (Hong and Yoo, 2012; Sharma and Gujral, 2010; Sreerama et al., 2012). This can be attributed to the addition of ingredients into soup such as maltodextrin, starch and salt (NaCl), which can improve the water solubility index (Andualem and Gessesse, 2013; Constanza et al., 2012).
On the other hand, flours from tilapia wastes displayed WSI values that were slightly different from conventional flours (Sharma and Gujral, 2010; Sreerama et al., 2010), except for wheat flour (Hong and Yoo, 2012). This fact can be explained due to the high difference in the proximate composition between products from tilapia wastes (Table 3) and conventional flours (Hager et al., 2012; Kaur et al., 2013; Skendi et al., 2010).
In agreement with our results, Sreerama et al. (2012) observed a major difference between flours from underutilized legumes and wheat flour, which has a long tradition of human consumption (Shewry, 2009). However, even with lower WSI values in chickpea, cowpea and horse gram flours compared with wheat flour, Sreerama et al. (2012) suggested that these flours might be used for producing composite flours as partial substitutes of ingredients in traditional food products. This fact reinforces the possible utilization of the tilapia flours as powder ingredients in the food industry.
Compression force, particle size distribution and particle size average Table 4 shows the compression force in grams (g), particle size distribution (%) and PSA (μm). HF had the highest (P < 0.05) compression force among the treatments. No difference (P > 0.05) was observed in this parameter among CF, HCF and IS.
Martin et al. (2007) affirmed that the texture influences certain physical properties such as the tempering requirements, flour particle size, water absorption and milling yield. Eduardo and Lannes (2007) described a relationship between particle size and compression force, where powders with a higher percentage of small particle size have a lower compression force. This relation can be observed in our study (Table 4).
On the other hand, this tendency may be changed when powders materials are used in association with other ingredients for elaboration of final product. In general, products manufactured from flours with a small particle size display higher compression force. This phenomenon has also been reported in other products. Barak et al. (2012) attributed this to an increase in water absorption capacity of the flour with finer particle size, which resulted in a dough stiffness that resulted in harder cookies. Petitot et al. (2010) observed a heterogeneous dough in pasta produced from legume flours (split pea and faba bean flour). In accordance with these authors, Mahasukhonthachat et al. (2010) affirmed that reduction in the particle size might expose larger surface areas and, at the same time, more polar groups with water binding sites to the surrounding water.
The relationship between particle size and water absorption was also observed in our study. As the diameter of flours and instant soup decreased, the WAI of these products increased substantially from 271.5 to 477.3 (Table 4).
A significant difference (P < 0.05) was found among all treatments in PSA and particle size distribution values (Table 4). All flours (HF, CF and HCF) were composed mostly of particles in the 500 - 1000 μm range (Fig. 1), being characterized by a higher amount of larger particles. Among the flours, HCF showed lower amount of larger particles, probably, due to further milling step performed in this product. HF displayed a higher (P < 0.05) amount of larger particles (70% at 1000 μm), most likely due to the difference in the protein, lipid and moisture content with respect to CF, HCF, and IS. Because flours with small particles size may negatively influence the texture proprieties of products, researchers suggest the utilization of flours with higher amounts of larger-sized particles (Barak et al., 2012; Petitot et al., 2010). Barak et al. (2012) concluded that wheat flour with a particle size greater than 150 μm produced cookies with the best quality. When considering particle size, all flours of this study displayed a higher potential as replacements for flours widely used in sectors of the food industry.
Instant soup (IS) had mostly particles in the 250 – 500 μm range, displaying a lower amount of larger particles than HF, CF and HCF. According to Jinapong et al. (2008), agglomerated powder with particle sizes larger than 260 μm generates products with the best handling characteristics, instant preparation characteristics, and reconstitution properties.
Therefore, considering the utilization of flours without gluten described in literature and the nutritious potential of flours from tilapia wastes, this study suggests that such flours may be incorporated into several products, but the proper levels and sensorial parameters should be evaluated. In addition, instant soup is a semi-ready product with high potential for commercialization and consumption due to excellent nutritional and technological proprieties.

Instrumental color analysis Table 4 shows the instrumental color parameters. HF had lower L*, a*, and b* values than CF, HCF, and IS. CF and HCF displayed higher redness, whereas IS had higher lightness (L*) compared with the other treatments. No difference (P > 0.05) was observed in b* values among CF, HCF, and IS. Instant soup demonstrated greater light color according to an analysis of instrumental color parameters and visual appearance made by authors this study, most likely due to the addition of ingredients usually used in soups (maltodextrin and modified starch). According to Hager et al. (2013), lighter coloration may strongly influence the consumer’s choice. In this manner, this semi-ready product will display satisfactory sensory scores in terms of coloration.
There is a lack of data in relation to color parameters in fish flours. Furthermore, the purpose of this study was to examine the application of total or partial tilapia flours in products already manufactured with other flours. Therefore, our results were compared to conventional flours generally already used in the food industry (botanical flours and non-gluten flours).
Flours produced in this study displayed lower lightness values and higher redness and yellowness (higher darkness) values than flours commonly used in the food industry (Brites et al., 2010; Skendi et al., 2010), except for the b* values of soybean flour (Kaur et al., 2013). Therefore, the flours from tilapia wastes, mainly head flour, could be incorporated in pre-cooked products because the cooking process promotes increased L* and decreased a*, resulting in lighter coloration, which positively influences consumer’s acceptance (Hager et al., 2013). Another possibility would be partial replacement of the flours already used in the products with minor concentrations of tilapia flours. Aydin and Gocmen (2011) observed darkness in noodles supplemented with oat flour (10 40%), but no difference was observed in overall acceptance between noodles without oat flour and with 10% oat flour. Similar technological alternatives can be achieved by testing different concentrations of applied tilapia flours to improve nutritional value without changing the color of the final products.
Principal Component Analysis (PCA) PCA explained 94.93% of variance (Fig. 2). The first component contributed 64.62% and separated the treatments into three groups (HF, CF and HCF, and IS) based mainly on the PSA, compression force, moisture, Aw, WAI, lipids and L* values. The values of these parameters were inversely proportional in HF and IS. The second component explained 30.31% of total variance and divided the treatments into two groups (HF and IS and CF and HCF) based mainly on the WSI, pH, protein, ash, carbohydrates, a* and b* values. The combination of principal components 1 and 2 resulted in separation into three groups (HF, CF and HCF, and IS). According to PC1 and PC2, HF demonstrated higher PSA, compression force, Aw, pH, lipids, redness, and yellowness, as well as lower WAI, WSI, protein, and lightness. CF and HCF had intermediate values of ash, pH, Aw, WAI, WSI, PSA, compression force, particle size distribution, and lightness but higher protein and moisture and lower carbohydrate levels, and IS exhibited intermediate values of protein, moisture content, redness, yellowness, lower lipids, pH, Aw, PSA, particle size distribution, and compression force, as well as higher ash, carbohydrate, WAI, WSI, and lightness values.

Table 5.
Pearson’s correlation coefficients between physical and chemical parameters in flour and instant soup from tilapia wastes.
| Variables |
CF |
PSA |
WAI |
WSI |
Moisture |
pH |
Water activity |
L* |
a* |
b* |
Lipids |
Ash |
Proteins |
Carbohydrates |
| CF |
1.00 |
0.97 |
−0.82 |
−0.55 |
−0.55 |
0.58 |
0.97 |
0.66 |
−0.73 |
−0.85 |
0.69 |
0.24 |
−0.85 |
−0.44 |
| PSA |
0.97* |
1.00 |
−0.92 |
−0.73 |
−0.49 |
0.75 |
1.00 |
−0.81 |
−0.56 |
−0.75 |
0.82 |
0.01 |
−0.72 |
−0.64 |
| WAI |
−0.82* |
−0.92* |
1.00 |
0.93 |
0.53 |
−0.94 |
−0.92 |
0.97 |
0.33 |
0.62 |
−0.98 |
0.27 |
0.53 |
0.87 |
| WSI |
−0.55 |
−0.73 |
0.93* |
1.00 |
0.33 |
−1.00 |
−0.74 |
0.99 |
−0.05 |
0.30 |
−0.96 |
0.60 |
0.18 |
0.99 |
| Moisture |
−0.55 |
−0.49 |
0.53 |
0.33 |
1.00 |
−0.39 |
−0.47 |
0.47 |
0.74 |
0.86 |
−0.56 |
−0.45 |
0.79 |
0.26 |
| PH |
0.58 |
0.75 |
−0.94* |
−1.00* |
−0.39 |
1.00 |
0.75 |
−0.99 |
−0.01 |
−0.35 |
0.98 |
−0.55 |
−0.23 |
−0.99 |
| Water activity |
0.97* |
1.00* |
−0.92* |
−0.74 |
−0.47 |
0.75 |
1.00 |
−0.81 |
−0.54 |
−0.73 |
−0.82 |
−0.02 |
−0.70 |
−0.65 |
| L* |
−0.66 |
−0.81* |
0.97* |
0.99* |
0.47 |
−0.99* |
−0.81* |
1.00 |
0.13 |
0.46 |
0.99 |
0.45 |
0.35 |
0.96 |
| a* |
−0.73 |
−0.56 |
0.33 |
−0.05 |
0.74 |
−0.01 |
−0.54 |
0.13 |
1.00 |
0.94 |
−0.21 |
−0.82 |
0.98 |
−0.16 |
| b* |
−0.85* |
−0.75 |
0.62 |
0.30 |
0.86* |
−0.35 |
−0.73 |
0.46 |
0.94* |
1.00 |
−0.54 |
−0.59 |
0.99 |
0.19 |
| Lipids |
0.69 |
0.82* |
−0.98* |
−0.96* |
−0.56 |
0.98* |
0.82* |
−0.99* |
−0.21 |
−0.54 |
1.00 |
−0.37 |
−0.42 |
−0.93 |
| Ash |
0.24 |
0.01 |
0.27 |
0.60 |
−0.45 |
−0.55 |
−0.02 |
0.45 |
−0.82* |
−0.59 |
−0.37 |
1.00 |
−0.67 |
0.69 |
| Proteins |
−0.85* |
−0.72 |
0.53 |
0.18 |
0.79 |
−0.23 |
−0.70 |
0.35 |
0.98* |
0.99* |
−0.42 |
−0.67 |
1.00 |
0.06 |
| Carbohydrates |
−0.44 |
−0.64 |
0.87* |
0.99* |
0.26 |
−0.99* |
−0.65 |
0.96* |
−0.16 |
0.19 |
−0.93* |
0.69 |
0.06 |
1.00 |
CF = Compression force, PSA = Particle size average, WAI = Water absorption index, WSI = Water solubility index.
L* (Lightness), a* (redness) and b* (yellowness).
* Pearson’s correlation coefficients (r > 0.8, P < 0.05).
Table 5 summarizes Pearson’s correlation coefficients, which indicate the existence of a strong association between several attributes in relation to physical, chemical, and instrumental parameters.
HF displayed higher (P < 0.05) lipid content and amount of larger particles compared with CF, HCF, and IS. This fact may be explained by the positive correlation between PSA and lipid content. The greater water absorption and water solubility indices in the instant soup (IS) than in all the flours (HF, CF, and HCF) might be partially attributed to the positive correlation between WAI and carbohydrates and WSI and carbohydrates. However, other factors contributed to high solubility in IS such as lower lipid content and lower PSA.
The inverse association between WSI and lipid content might explain the lower (P < 0.05) WSI in HF, which displayed higher (P < 0.05) lipid content than other treatments. The pH values were inversely proportional to WAI and WSI, suggesting that Ph otherwise influenced these indices in animal-origin flours.
It is important highlight that Pearson’s correlation indicated that WAI and WSI and compression force and PSA were directly proportional. These associations strengthen the reports made by Sreerama et al. (2012) and Eduardo and Lannes (2007), respectively. However, the relationship between compression force and PSA becomes inversely proportional when other ingredients in addition to flours are added into the products. This most likely occurs due to the ability of smaller particles to absorb more water, increasing compression force as related by Barak et al. (2012), Mahasukhonthachat et al. (2010) and Petitot et al. (2010). This fact can be confirmed through the negative correlation between PSA and WAI.
Partial least square regression Fig. 3 shows the relationship between the physical, chemical and instrumental color parameters that contributed to the compression test using partial least squares regression (PLSR). The PLSR model explained 94.7% of compression force (Y-axis) and 95.4% of the physical, chemical, and instrumental color parameters (X-axis), showing an accumulated Q2 of 0.715. The physical, chemical, and instrumental color parameters were considered relevant when their respective variable important to the projection was greater than 0.7 (Wold et al., 2001).
WAI, WSI, instrumental color attributes (L*, a*, and b*), and protein parameters were detrimental to compression force, whereas PSA, pH, water activity, and lipid content positively contributed to compression force. These results suggest that the proximate composition and other physical and chemical parameters may be influenced by the texture of powder products. The compression test results were higher when flours displayed lower WAI, WSI, protein content, L*, a*, and b* values, as well as higher PSA, pH, Aw, and lipid content values.

According to Blanchard et al. (2012), the knowledge of flour functionalities can be achieved by studying the flour composition and property differences by using several types of flours. Therefore, currently, researchers have been investigating healthier alternatives to replace conventional flour sources, focusing on benefits to the health of consumers (Andualem and Gessesse, 2013; Gujral et al., 2013; Park et al., 2013). Gujral et al. (2013) concluded that part of the wheat flour should be replaced with oats to take advantage of the nutraceutical potential of oats. Andualem and Gessesse (2013) affirmed that the defatted flour could be a useful replacement in viscous food formulations such as soups and baked goods due to high values of water absorption. Park et al. (2013) concluded that the turmeric could be utilized as a source of natural antioxidants to develop cakes as functional foods.