Abstract
Tamarind seed polysaccharide (TSP) belongs to the galactoxyloglucan family and is used as a thickener or stabilizer in the food industry. To establish a quantitative method for TSP, the iodine-staining method was implemented and validated using various marketed TSP products in terms of selectivity, linearity, range, trueness, precision, and uncertainty. Good linearity was confirmed for the TSP reference standard (RS) over the concentration range of 5 – 449 µg/g. The tested method yielded good recovery from the spiked test (99 – 107%) and precision using RS and various marketed TSP products (repeatability precision (RSDr): 1.0 – 1.9%, intermediate precision (RSDi): 1.5 – 3.5%), suggesting the validity of the quantitative method. The quantitative method was applicable to currently marketed TSP products. We conclude that this method is a simple and practical method with high trueness and precision for the determination of TSP concentration to certify marketed TSP products as food additives.
Introduction
Tamarind seed polysaccharide (TSP or tamarind seed gum) consists of galactoxyloglucan, which has a main chain structure of β-1,4-glucan with side chains of α-d-xylopyranose and β-d-glactopyranosyl-1,2-α-d-xylopyranose 1,6-linked to the main chain (Glc : Xyl : Gal = 2.8 : 2.25 : 1) (Gidley et al., 1991). TSP is extracted from the seed of tamarind (Tamarindus indica L.), an evergreen tree grown in tropical and subtropical regions. TSP solutions have a similar texture to starch and exhibit Newtonian flow. In Japan, TSP is used as a thickener, stabilizer, and gelling agent in various foods, such as thick sauce, dipping sauce, mayonnaise, frozen desserts, wheat flour products, and jelly (Nishinari et al., 2009).
Xyloglucan is a hemicellulose found in the cell walls of all higher plants (Hayashi, 1989a, Schultink et al., 2014). Although additional substituents differ slightly depending on the plant family, tissue, and developmental stage (Schultink et al., 2014), the basic structure of xyloglucan is similar in all of these plants. Xyloglucans are also present in rice, vegetables, and fruit (Fry, 1992), considered to be food ingredients that are constantly ingested in our diet.
In Japan, TSP products were first marketed as food additives in 1964 and have been safely used for many years. TSP products are also referred to as existing food additives and were placed on the List of Existing Food Additives by The Ministry of Health, Labor and Welfare in Japan. TSP products are also used as food additives in China and South Korea and as food ingredients in Taiwan. In the United States, TSP products are marketed with Generally Recognized As Safe (GRAS) status, granted by the US Food and Drug Administration (FDA) in 2014. Given this background, the market for TSP products is expected to grow worldwide.
TSP products with different characteristics are currently manufactured and marketed. Hot- and cold-water-soluble products are widely used as the standard, while clarified and low-viscosity products are also used for specific purposes. To market such TSP products worldwide, it is necessary to confirm their content for quality assurance. Thus, the establishment of a simple and highly precise method for quantitative determination of TSP is required.
TSP can be quantified by various methods, including the iodine-staining method with specific color reactions (Kooiman, 1960, Nishitani and Masuda, 1981), enzyme-linked immunosorbent assay (ELISA) method using antibodies that recognize the partial structure of xyloglucans (Sone and Fujikawa, 1993), the Prosky-AOAC method using enzymes (Prosky et al., 1984), and high-performance liquid chromatography quantification of isoprimeverose yielded by Driselase digestion (Kong et al., 2015). Among these techniques, the iodine-staining method seems promising in terms of cost and ease of conduct because TSP has been shown to stain blue with a solution containing iodine and potassium iodide, both of which are relatively low-cost reagents, and the staining intensity can be measured as absorbance at visible wavelength (e.g. 640 nm) by spectrophotometry. Moreover, the reaction has proved to be specific and applicable to quantitative assays of TSP or galactoxyloglucans from other plant sources (Kooiman, 1960). Since Kooiman's findings, it has been reported that the content of xyloglucans from various plant sources, such as azuki bean epicotyl (Nishitani and Masuda, 1981), rice endosperm (Shibuya and Iwasaki, 1978), leaf vegetables (Kato and Matsukura, 1994), fruit (Kato et al., 2001), squash hypocotyl (Wakabayashi et al., 1993), cotton fiber (Tokumoto et al., 2002), and xylem tissues of hybrid aspen stem (Nishikubo et al., 2011), has been quantified by iodine staining. Although the quantitative determination of xyloglucans by iodine staining has been performed for several decades in research on plant cell wall polysaccharides, the validity of the method and reference samples used for quantification have not been reported.
In this study, we report the quantitativity and validity of the iodine-staining method for various marketed TSP products using purified TSP as the reference standard. The results of this study suggest that the proposed method can be used as an assay for marketed TSP products as a food additive.
Materials and Methods
TSP reference standard and marketed TSP products A purified tamarind seed polysaccharide (TSP) (DSP Gokyo Food & Chemical Co., Ltd., Osaka, Japan), which was obtained by purifying a marketed TSP product (hot-water-soluble product) as described previously (Yamanaka et al., 1999) was used as the TSP reference standard (RS). Cold-water-soluble product (Glyloid® 3S), hot-water-soluble product (Glyloid® 2A), cold-water-soluble and clarified product (Glyloid® 6C), and hot-water-soluble and low-viscosity product (Glyate®) were used (all marketed TSP products from DSP Gokyo Food & Chemical Co., Ltd.). In this study, these four marketed TSP products were selected as representative since they constitute most of the total market currently.
Other reagents All reagents used in this study were of special reagent grade. Ion-exchanged water was used. Sodium sulfate, iodine, potassium iodide, soluble starch, and sodium alginate were from Nacalai Tesque, Inc. (Kyoto, Japan); α-amylase from the porcine pancreas (A6255) was from Sigma-Aldrich (St. Louis, USA); dextrin with a dextrose equivalent (DE) of 18 (TK-16) was from Matsutani Chemical Industry Co., Ltd. (Itami, Japan); dextrin with a DE of 6 – 8 (SD 70) and dextrin with a DE of 10 – 13 (SD100) were from Sanwa Starch Co., Ltd. (Nara, Japan); sodium carboxymethyl cellulose (CMC, Cellogen F-SH) was from Dai-ichi Kogyo Seiyaku Co., Ltd. (Kyoto, Japan); locust bean gum (Grindsted LBG860) was from Dupont, Danisco Ingredients (Brabrand, Denmark); pullulan was from Hayashibara Co., Ltd. (Okayama, Japan); corn starch was from Aeon Co. Ltd. (Chiba, Japan); glucose was from San-ei Sucrochemical Co., Ltd. (Chita, Japan); apple pectin (Classic AB901) and citrus pectin (Classic CM201) were from Herbstreith & Fox (Neuenbürg, Germany); guar gum (Guarpak® PF-20), xanthan gum (Echo gum®), gum arabic, karaya gum, and psyllium seed gum (Healthy gum) were from DSP Gokyo Food & Chemical Co., Ltd.
Component analyses The contents of water, dietary fiber, protein, lipid, ash, and starch in RS and marketed TSP products were analyzed by the atmospheric heating-drying method, the enzymatic-gravimetric method (Prosky method), the Kjeldahl method, the Soxhlet extraction method, the direct ashing method, and the enzymatic method, respectively (Sugawara and Maekawa, 2000). Sugar analysis was performed by HPLC using the post-column labeling method. Using 10 mg RS, neutral sugars were labeled with 1% arginine in 3% boric acid, and hydrolyzed in 72% sulfuric acid for 3 h at room temperature (Mikami and Ishida, 1983). Sugars were separated on a TSK-gel Sugar AXG (4.6 mm I.D. x 150 mm; Tosoh, Tokyo, Japan). Sugar composition analysis was performed at Toray Research Center (Kamakura, Japan)
Sample preparation An RS solution (0.5 wt%) was prepared by dissolving 1.0 g RS in 170 mL water at room temperature (25 ± 3°C), and then the total weight was adjusted to 200 g with water. Solutions (0.5 wt%) of each marketed TSP product were prepared in the same way as RS except that hot-water-soluble products, and hot-water-soluble and low-viscosity products were dissolved in water at 75 ± 2°C, then diluted to make a 100 µg/g sample solution, which was subsequently subjected to iodine staining. For other sugars, 100 µg/g solutions of dextrin (TK-16, SD70, and SD100), CMC, corn starch, xanthan gum, gum arabic, pullulan, sodium alginate, and glucose were prepared using water maintained at room temperature, while locust bean gum, apple pectin, citrus pectin, karaya gum, and psyllium seed gum were dissolved in heated water (80 ± 2°C) to make 100 µg/g solutions. In some experiments, in order to examine the effect of starch and other sugars on iodine staining of TSP, solutions of RS (100 µg/g) containing each type of starch or other sugars (20 µg/g) were prepared. All solutions prepared in this study were vigorously blended just before taking an aliquot from the solution to ensure sample uniformity.
Amylase pretreatment study To examine the effect of enzymatic pretreatment of soluble starch present in TSP solutions, a TSP solution containing soluble starch was treated with α-amylase before iodine staining. One milliliter of 500 µg/g RS and/or 100 µg/g soluble starch in 10 mM Tris-hydrochloric acid (pH 7.0) containing approximately 1 unit of α-amylase from porcine pancreas were incubated at 37°C for 1 h. Mixtures of 500 µg/g RS and/or 100 µg/g soluble starch pretreated in the absence of α-amylase were used as a control. After enzymatic treatment, the reaction mixtures were heated at 99°C for 10 min. Iodine staining was performed by the method mentioned below with solutions (1 mL each) produced by diluting the heated reaction mixtures 5-fold.
Quantification of TSP by iodine staining The TSP concentration of each marketed TSP product was determined from the calibration curve for A640 value measured with iodine-stained samples by a method (Nishitani and Masuda, 1981) modified from Kooiman's iodine-staining method (Kooiman, 1960). A 1.0-mL portion of sample solution was mixed with 2.0 mL of 15 w/v% sodium sulfate solution, 0.25 mL of 0.5 w/v% iodine and 1.0 w/v% potassium iodide solution (which had been prepared and stored at 4°C in a dark place before use). The reaction mixture was kept for 1 h at 4°C in darkness, and for 30 min at room temperature in darkness. A640 value was measured using a spectrophotometer (U-2910; Hitachi High-Tech Science, Tokyo, Japan). From the A640 value and calibration curve, the TSP concentration in the sample solution was calculated. The quantified TSP concentrations were calculated based on dry matter. The water content of TSP samples was determined using a halogen moisture analyzer (HG53; Mettler Toledo, Columbus, US) for weight loss, which was measured after drying ca. 3 g of a sample at 105°C until no further weight loss of >1 mg was detected within 50 sec.
Method validation The method was validated with respect to selectivity, linearity, range, limit of detection (LOD), limit of quantification (LOQ), trueness, repeatability, intermediate precision, and uncertainty.
In order to assess the selectivity of the method, 100 µg/g solutions of various saccharides including starches and dextrins were tested by iodine staining. The interfering effects of starches and other saccharides on iodine staining of TSP were tested by the quantification method for a 100 µg/g solution of RS with 20 µg/g starch or other saccharides.
Linearity was determined at 14 different concentrations (5, 10, 15, 20, 25, 50, 75, 100, 125, 150, 200, 300, 500, and 1000 µg/g, before conversion to dry matter) of RS, with each concentration tested in triplicate. Regression analysis was performed based on the obtained curve data. For calibration, five different concentrations (50, 75, 100, 125, and 150 µg/g, before conversion to dry matter) of RS solutions were tested using six replicates. A calibration curve was obtained by the least-squares method and the linear regression coefficient was calculated. The calibration curve was not forced to pass through the origin. The linearity requirements were fulfilled when the correlation coefficient was greater than 0.999 and the back-calculated concentration of the calibration standards did not exceed ±10% of the theoretical value. LOD and LOQ were determined as 3.3 and 10 times, respectively, the ratio SD (standard deviation) /slope of the response obtained from the calibration curve (n = 6).
Trueness was evaluated by performing recovery experiments using RS alone and the cold-water-soluble product fortified with RS. TSP concentrations in the samples were measured by the iodine-staining method. For the recovery test using RS alone, RS was assessed at five different concentrations (calibration solutions) in water using six replicates with different sets of calibration curves. In this assay, the recovery rate was calculated as [(Cd/Ca) x 100], where Cd is the concentration determined and Ca is the amount added, and recovery rates (%) ranging from 90% to 110% were judged acceptable in this study. For the spiked recovery test using cold-water-soluble product fortified with RS, 87 µg/g cold-water-soluble TSP product solutions were spiked with 9 or 36 µg/g RS. The recovery rates were calculated with the mean values of data obtained by performing two parallel analyses for 5 days and a formula of [(Cf-Cu)/Cs x 100], where Cf is the concentration of the fortified test samples, Cu is the concentration of the unfortified test sample, and Cs is the spike level. The calculated recovery rates were assessed based on the recovery rates recommended by AOAC (85 – 110% and 90 – 108% for 100 µg/g and 1000 µg/g, respectively) (AOAC, 2013).
Repeatability relative standard deviation and intermediate relative standard deviation (RSDr and RSDi, respectively) were estimated based on the results of two parallel analyses performed using six replicates with RS for 3 days and two replicates with each TSP product for 5 days, respectively. One-way analysis of variance (ANOVA) was performed, and values were obtained using the following equations:
An estimate of the combined relative standard uncertainty associated with the results using RS alone was calculated by type A evaluation of uncertainty. To estimate the combined relative standard uncertainty, the relative standard uncertainties associated with the root mean square of ‘100-recovery (%)’ and reproducibility obtained using RS alone, respectively, were considered as main uncertainty sources of the method in this study, and by combining these relative standard uncertainties. An estimate of the relative expanded uncertainty corresponding to a confidence interval of approximately 95% was obtained by multiplying the combined standard uncertainty by a coverage factor of 2.
Results
TSP reference standard To assess the purity of RS, the content of dietary fiber and sugars was analyzed. The contents of polysaccharides detected as dietary fiber, protein, fat, and ash in the purified TSP were 100.3 ± 0.5%, 0.1 ± 0.0%, <0.1 ± 0.0%, and 0.1 ± 0.1% (mean ± SD, n = 3), respectively. The most abundant composition of saccharides in RS was glucose (51.4%), followed by xylose (29.7%) and galactose (17.1%) (Table 1). The ratio of galactose, xylose, and glucose was 1:1.7:3.0, which is comparable to the ratio (1:2.25:2.8) previously reported (Gidley, et al., 1991). These results indicate that RS is composed of practically pure xyloglucan. The presence of a trace amount of arabinose in the cold-water-soluble TSP product was also pointed out in a previous study (Gidley, et al., 1991). In addition, starch that could be stained with iodine was not detected in purified TSP by the starch test. Thus, the purified TSP used for quantitative determination in this study is appropriate to use as an RS to quantify TSP by the iodine-staining method.
Table 1.
Monosaccharide composition analysis of tamarind seed polysaccharide (TSP) reference standard.
| Sugar content (mol %) |
| Ara |
Rha |
Fuc |
Xyl |
Man |
Gal |
Glc |
| 1.5 |
0.1 |
nd |
29.7 |
0.2 |
17.1 |
51.4 |
Sugar analysis was performed by HPLC with the post-column labeling method. Using 10 mg TSP reference standard, neutral sugars were labeled with 1% arginine in 3% boric acid, and hydrolyzed in 72% sulfuric acid for 3 h at room temperature. Sugars were separated on a TSK-gel Sugar AXG (4.6 mm I.D. x 150 mm). nd, not detected.
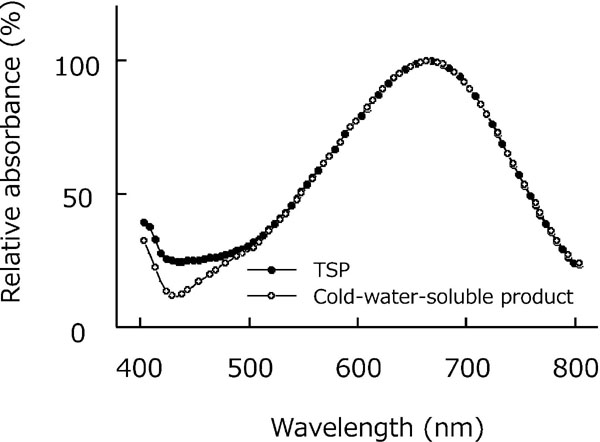
Absorption spectra of iodine-stained TSP Visible light absorption spectra revealed that the solutions of iodine-stained RS and the cold-water-soluble product exhibited maximum absorption at approximately 660 nm and relatively broad absorption over the range of 550 – 750 nm (Fig. 1), obtained with equipment used in this study. Other TSP products exhibited similar spectra to the RS and cold-water-soluble product (data not shown). At 640 nm, RS and all products exhibited approximately 97 ± 0% (mean ± SD, n = 6 for each of RS and products) of the maximum absorption. The results suggest the negligible effect of differences in measuring wavelengths between A660 and A640 on the uncertainty of the method. Although 640 nm is not the maximum absorption wavelength, it is comparable with previously reported data (Kooiman, 1960, Nishitani and Masuda, 1981). Therefore, it is considered appropriate to use 640 nm to measure the absorbance of iodine-stained TSP sample solutions.
Method validation With other representative saccharides used as food additives (CMC, pullulan, xanthan gum, guar gum, locust bean gum, apple pectin, citrus pectin, sodium alginate, karaya gum, gum arabic, and psyllium seed gum), starches, and glucose, the A640 value was measured using this quantification method, and the selectivity of iodine staining was evaluated by comparing with RS, indicating that the iodine staining of various saccharides measured at 640 nm also shows less non-specific detection (Fig. 2). Soluble starch and dextrin (with DEs of 6 to 8 and 10 to 13, respectively) were stained with iodine, while no iodine staining comparable to that of RS was observed in other polysaccharides or glucose, suggesting the selectivity of iodine staining for TSP (Fig. 2). The effects of various starches on the quantification of TSP content were also examined. There were no significant differences (P > 0.05) in A640 values between RS alone and RS with corn starch, dextrins, or other saccharides (Fig. 3). The effect of amylase pretreatment of RS solution containing soluble starch was then examined (Fig. 4). RS solution (0.05 wt%) mixed with soluble starch at 0.01 wt% showed a significant increase in iodine staining (P < 0.05), similar to soluble starch alone, indicating the effect of soluble starch on iodine staining (‘Initial’ and ‘Control’ in Fig. 4). To test amylase pretreatment for the quantification of TSP containing starch by the iodine-staining method, RS solution alone, soluble starch alone, and their mixture were pretreated with α-amylase and then stained with iodine. After pretreatment, the soluble starch-alone sample was not stained with iodine, while the RS solution-alone sample and the mixture of RS solution and soluble starch exhibited similar A640 values (P > 0.05) (‘Amylase’ in Fig. 4). In addition, the iodine staining of RS solution alone hardly changed (P > 0.05) before and after amylase pretreatment, indicating the absence of starch in RS. In the Japanese Specifications and Standards for Food Additives, TSP is defined as not containing starch, and in a previous study, no starch was detected in marketed TPS products by the designated starch test for TSP (Sadamasu et al., 1996). When quantifying TSP in products mixed with starch or foods containing starch, it may be necessary to remove the starch from samples by amylase treatment, etc. before quantification if the interference is not negligible. Thus, the iodine-staining method for quantitative determination of TSP is highly selective and can be applied to samples in the presence of starch or dextrins (DE ≤ ≈13) at a concentration of ≥15% by pretreatment with amylases, as required.


After staining RS solutions at concentrations ranging from 5 to 898 µg/g with iodine, we examined the relationship between quantitativity by iodine staining measured with A640 value and TSP concentration. These analyses were carried out in triplicate. Good linearity (r > 0.999) was confirmed over the concentration of 5 to 449 µg/g. A representative curve is shown in Fig. 5A. These results indicate that the linear curve fit reasonably well over a wide concentration range. Based on the curve in the concentration range tested, 100 µg/g (0.01 wt%) (before conversion to dry matter), which exhibited appropriate A640 values (0.6 – 0.7) in the range of linearity, was determined to be the preferred sample concentration for the iodine-staining method. The range of the calibration curve for quantification was selected considering the linearity between the concentrations and A640 values, and appropriate A640 values at 100 µg/g RS (0.6 – 0.7). Good linearity (r > 0.999) was also demonstrated for each calibration curve of the six replicates. LOD and LOQ were 1.59 – 1.71 µg/g and 4.83 – 5.19 µg/g, respectively, in the calibration range (44.5 – 133.6 µg/g). A representative calibration curve is shown in Fig. 5B.

A recovery test was conducted using RS alone and the cold-water-soluble product fortified with RS. Table 2 shows total recovery using five concentrations of RS in water. Recovery values were within the designated acceptable limits for the concentrations added, indicating the trueness of the method. In the spiked recovery test using cold-water-soluble product fortified with RS, 9 and 36 µg/g RS were added to the fortified samples. The cold-water-soluble product was chosen as the representative TSP product since it is regarded as the standard grade of TSP product on the market, and potentially contains impurities for examining the matrix effect. These spike concentrations were set as the total TSP concentrations around 100 µg/g, which is roughly near the expected concentration of marketed TSP products when their solutions are prepared according to the quantification method. Analysis of the nutritional composition of the cold-water-soluble product revealed that it contained lipid, ash, and protein as impurities, all of which accounted for approximately 1%; however, no starch was detected by the starch test as previously reported by Sadamasu et al. (1996) using various marketed TSP products. When a cold-water-soluble product with 87 µg/g TSP was quantified after adding 9 or 36 µg/g RS, the mean recovery rates in 10 measurements were 107% and 103%, respectively (Table 3), both of which were within the range of 85 to 110% (with a sample concentration of 100 µg/g) and 90 to 108% (with a sample concentration of 1000 µg/g), respectively, which are considered to be effective for single laboratory validation in reference to AOAC (AOAC, 2013). The results indicated that the impurities contained in TSP products are unlikely to influence iodine staining, thereby showing the absence of a matrix effect according to the quantification method. These results suggest that the quantification method has acceptable trueness.
Table 2.
Results of recovery test of iodine-staining method for tamarind seed polysaccharide (TSP) reference standard
| Amount of TSP added as concentration (µg/g) |
Detected value (µg/g) |
Recovery (%) |
| Mean |
SD |
Mean |
SD |
| 44.5 |
44.3 |
0.5 |
99.4 |
1.0 |
| 66.8 |
66.9 |
1.2 |
100.2 |
1.7 |
| 89.1 |
89.3 |
1.1 |
100.3 |
1.2 |
| 111.4 |
111.4 |
1.7 |
100.1 |
1.5 |
| 133.6 |
133.5 |
2.3 |
99.9 |
1.7 |
TSP reference standard was assessed by iodine staining at five different concentrations (calibration solutions) in water using different sets of calibration curves. In this assay, the recovery rate was calculated as [(Cd/Ca) × 100], where Cd is the concentration determined and Ca is the amount added, and recovery rates (%) from 90% to 110% were judged acceptable. Data are expressed as the mean and SD (n = 6 for each TSP concentration).
Table 3.
Single-laboratory analysis of spiked recovery test of tamarind seed polysaccharide (TSP) reference standard (RS) added to the cold-water-soluble product
|
|
Cold-water-soluble product (87µg/g) |
|
|
+ RS (9µg/g) |
+ RS (36µg/g) |
| TSP concentration (µg/g) |
Day 1 |
96 |
95 |
126 |
124 |
| Day 2 |
98 |
98 |
125 |
125 |
| Day 3 |
96 |
96 |
123 |
123 |
| Day 4 |
100 |
100 |
127 |
125 |
| Day 5 |
95 |
96 |
122 |
122 |
|
Mean (µg/g) |
97 |
124 |
| Recovery (%) |
107 |
|
103 |
|
| Sr (%) |
0.5 |
|
0.7 |
|
| RSDr (%) |
0.5 |
|
0.6 |
|
| Si (%) |
2.0 |
|
1.9 |
|
| RSDi (%) |
2.1 |
|
1.5 |
|
Cold-water-soluble TSP product solutions (87 µg/g, based on dry matter) were spiked with TSP reference standard (RS) (9 or 36 µg/g, based on dry matter). The recovery rates were calculated with the mean values of data obtained by performing two parallel analyses for 5 days and the formula of [(Cf-Cu)/Cs × 100], where Cf is the concentration of the fortified test samples, Cu is the concentration of the unfortified test sample, and Cs is the spike level. The calculated recovery rates were assessed based on the recovery rates recommended by AOAC (85 – 110% and 90 – 108% for 100 µg/g and 1000 µg/g, respectively) (AOAC, 2013).
One-way analysis of variance (ANOVA) was performed, and values were obtained using the following equations:
Repeatability standard deviation (Sr) = square root of within-group variance
Intermediate standard deviation (Si) = square root of {[(between-group variance) − (within-group variance)] /r + (within-group variance)}. (where r is the number of parallel analyses)
RSDr = Sr / mean of all quantitative values × 100
RSDi = Si / mean of all quantitative values × 100
Using RS and four marketed TSP products, RSDr and RSDi of this quantification method were examined. The cold-water-soluble product fortified with RS at 9 µg/g and 36 µg/g showed RSDr and RSDi values of ∼1% and ∼2.0%, respectively (Table 3). RSDr and RSDi for RS alone (Table 4) or each marketed product alone (Table 5) were 0.9 – 1.9% and 2.4 – 3.5%, respectively. These results confirmed the acceptable repeatability and reproducibility of the quantification method, and its applicability for marketed TSP products, which constitute most of the total market currently. The relative expanded uncertainty for measuring TSP by the iodine-staining method is estimated to be 4.11%. This level of low uncertainty supports that the method has high metrological quality for the determination of TSP concentration. The results suggest that the iodine-staining method validated in this study has sufficient trueness and precision regardless of product type (solubility, physical property, or viscosity).
Table 4.
Results of single-laboratory analysis of quantitative determination of tamarind seed polysaccharide (TSP) reference standard by iodine staining
|
Day 1 |
Day 2 |
Day 3 |
| TSP concentratiovn (µg/g) |
90 |
92 |
93 |
| 91 |
93 |
92 |
| 88 |
88 |
91 |
| 90 |
93 |
93 |
| 89 |
91 |
93 |
| 86 |
89 |
90 |
| Mean (µg/g) |
|
90.6 |
|
| SD (µg/g) |
|
2.1 |
|
| RSD (%) |
|
2.3 |
|
| Sr (µg/g) |
|
1.7 |
|
| RSDr (%) |
|
1.9 |
|
| Si (µg/g) |
|
2.4 |
|
| RSDi (%) |
|
2.6 |
|
Repeatability relative standard deviation and intermediate relative standard deviation (RSDr and RSDi, respectively) of iodine staining for aqueous solution of TSP reference standard were estimated based on the results of two parallel analyses performed using six replicates for 3 days. Other details are given in Table 3.
Table 5.
Results of single laboratory analysis of quantitative determination of tamarind seed polysaccharide (TSP) in various TSP products by iodine staining
|
|
Cold-water-soluble |
Hot-water-soluble |
Clarified |
Low viscosity |
| TSP concentration (µg/g) |
Day 1 |
88 |
88 |
77 |
78 |
82 |
80 |
89 |
90 |
| Day 2 |
88 |
87 |
76 |
76 |
78 |
78 |
89 |
88 |
| Day 3 |
87 |
87 |
76 |
78 |
79 |
80 |
92 |
91 |
| Day 4 |
93 |
90 |
76 |
75 |
79 |
80 |
92 |
91 |
| Day 5 |
83 |
84 |
77 |
78 |
77 |
79 |
89 |
85 |
|
Mean (µg/g) |
87 |
77 |
79 |
90 |
| Sr (µg/g) |
1.0 |
0.7 |
0.7 |
1.4 |
| RSDr (%) |
1.2 |
1.0 |
0.9 |
1.5 |
| Si (µg/g) |
3.1 |
1.9 |
1.9 |
2.2 |
| RSDi (%) |
3.5 |
2.5 |
2.4 |
2.4 |
Repeatability relative standard deviation and intermediate relative standard deviation (RSDr and RSDi, respectively) of the iodine-staining method for TSP concentration in aqueous solutions of various TSP products were estimated based on the results of two parallel analyses performed using two replicates with each TSP product for 5 days. Other details are given in Table 3.
Discussion
Our results add detailed data supporting the validity of the iodine-staining method for xyloglucan content as previously reported; therefore, this method was established for the quantitative determination of TSP. Additionally, our results indicate that the iodine-staining method is a specialized technique with selectivity for a wide variety of polysaccharides excluding starches, which can be predigested by amylases if interference is not negligible. In contrast, the Prosky method (Prosky, et al., 1984) has no selectivity for the determination of dietary fibers, although total fibers are quantified using the current protocol for food ingredients. The results also indicate that the method is applicable to the marketed TSP products, which constitute currently most of the total market. Thus, the iodine-staining method will be used to certify TSP content in a variety of marketed TSP products, and additionally to determine TSP content in foods.
As an application of the method, the following equation are proposed to measure TSP content in marketed TSP products:
Where
-
T: Content of tamarind seed polysaccharide in the sample (%)
-
D: Concentration of tamarind seed polysaccharide in the sample solution determined by the method (µg/g)
-
WT: Weight of the sample (g)
-
L: Loss on drying of the sample (water content) (%)
It is notable that the iodine staining of TSP showed quantitativity and selectivity, which is relevant to the interaction between TSP molecules and iodine. In previous analysis of the TSP-iodine complex gel structure by small-angle x-ray scattering and molecular simulation (Yuguchi et al., 2000), an inclusion space created by the side chain structure (Yuguchi et al., 2005) of TSP between TSP molecules in a parallel rod-like structure (Yamanaka, et al., 1999) was proposed to accommodate iodine in the structure. This may lead to selectivity, whereas the starch-iodine reaction is proposed to be involved in the incorporation of iodine into an amylose helical structure (Bluhm and Zugenmaier, 1981). A TSP molecule is composed of subunit structures possessing a backbone of four consecutive 1, 4-linked-β-d-glucopyranosyl residues with four different patterns of side-chain substitution for the β-glucosyl residues (York et al., 1990). Such various patterns of side chain structures might account for the quantitative inclusion space for iodine corresponding to the number and size of TSP molecules.
The iodine-staining intensity of xyloglucan showed to decrease with depolymerization by an enzyme (xyloglucan endohydrolase) of the main chain (Tabuchi et al., 2001). When the molecular mass of xyloglucan is approximately ≤10 KDa, an evident decrease is observed in the intensity of iodine staining (Hayashi, 1989b). In this study, the low-viscosity TSP product, which is thought to be depolymerized to some extent, showed similar intensity of iodine staining to that of RS (Table 5). Therefore, the iodine-staining method established in this study is considered applicable to all current TSP products. If new TSP products with a molecular mass lower than a certain size, showing a lower intensity of iodine staining than current marketed TSP products, were going to be developed, further studies would be needed to establish a quantification method.
Pertinent to the TSP structure in iodine staining, the hypothesis that the side chains of TSP create inclusion spaces for iodine (Yuguchi, et al., 2005) may suggest that removal of galactose as a side chain of TSP influences iodine staining. We have pursued this possibility and found that TSP partially degalactosylated by β-galactosidase (Shirakawa et al., 1998) showed slightly but significantly reduced iodine staining as compared with TSP without enzymatic treatment (Tabuchi A, Baba Y, Inoue Y, and Yamatoya K, DSP Gokyo Food & Chemical, Osaka, Japan). Therefore, it is necessary to make an adjustment when calculating the content of partially degalactosylated TSP using this quantification method, and further study is required to determine specific adjustment conditions. Based on the relationship between the molecular structure of TSP and iodine staining, we conclude that iodine staining of TSP can be adopted as a universal method to quantify TSP in various marketed TSP products as food additives regardless of differences in the structure or physical properties of currently marketed TSP products.
Conclusion
In conclusion, since the iodine-staining method for TSP quantification was confirmed to be quantitative, selective, and appropriate in this study, we propose that this technique is adopted as a simple and practical method with high trueness and precision for the determination of TSP concentration. The method showed that good linearity was confirmed for the concentration range of 5 – 449 µg/g (r > 0.999) of RS. The calibration curve shows a linear relationship between absorbance and selected concentrations with a correlation coefficient more than 0.999. TSP can be quantified in the calibration range (44.5 – 133.6 µg/g) with LOD of 1.59 – 1.71 µg/g and LOQ of 4.83 – 5.19 µg/g with the absence of a matrix effect. Uncertainty for the determination of TSP was calculated from the validation data. The relative expanded uncertainty by this method was estimated to be 4.11%. The method established in this study was successfully applied for TSP products constituting most of the total market currently. Thus, the iodine-staining method can be used to certify TSP content in TSP products marketed as food additives.
Acknowledgements We thank Takafumi Isogai, University of Marketing and Distribution Sciences, and Yasuki Matsumura and Kentaro Mastumiya, Kyoto University, for advice on statistical analysis.
Abbreviations
TSP
tamarind seed polysaccharide
RS
reference standard
DE
dextrose equivalent
A640
absorbance at 640 nm
SD
standard deviation
RSD
relative standard deviation
RSDr
repeatability relative standard deviation
RSDi
intermediate relative standard deviation
LOD
limit of detection
LOQ
limit of quantification
References
- AOAC. (2013). “Official methods of analysis of AOAC International. Appendix K: Guidelines for dietary supplements and botanicals.” AOAC International, Gaithersburg, MD.
- Bluhm, TL. and Zugenmaier, P. (1981). Detailed structure of the Vh-amylose-iodine complex: A linear polyiodine chain. Carbohydr. Res., 89, 1-10.
- Fry, SC. (1992). Xyloglucan: A metabolically dinamic polysaccharide. Trends Glycosci. Glycotechnol., 4, 279-289.
- Gidley, MJ., Lillford, PJ., Rowlands, DW., Lang, P., Dentini, M., Crescenzi, V., Edwards, M., Fanutti, C., and Reid, JS. (1991). Structure and solution properties of tamarind-seed polysaccharide. Carbohydr. Res., 214, 299-314.
- Hayashi, T. (1989a). Xyloglucans in the Primary Cell Wall. Annu. Rev. Plant Physiol. Plant Mol. Biol., 40, 139-168.
- Hayashi, T. (1989b). Measuring β-glucan deposition in plant cell walls, In “Modern methods of plant analysis, New series: Plant Fibers, vol. 10” ed. by HF Linskens and JF Jackson, Springer Verlag, Berlin, pp. 138-160.
- Kato, Y., Ito, S., and Watanabe, T. (2001). Polysaccharide composition of the water-insoluble dietary fibers from some fruit. Bull. Fac. Educ. Hirosaki, 86, 91-96. (in Japanese)
- Kato, Y. and Matsukura, J. (1994). Carbohydrate composition of major leaf vegetables : Carbohydrate composition of vegetable food (Part I). Bull. Fac. Educ. Hirosaki, 71, 61-71. (in Japanese)
- Kong, Y., Peña, MJ., Renna, L., Avci, U., Pattathil, S., Tuomivaara, ST., Li, X., Reiter, W-D., Brandizzi, F., Hahn, MG., Darvill, AG., York, WS., and O'Neill, MA. (2015). Galactose-depleted xyloglucan is dysfunctional and leads to dwarfism in arabidopsis. Plant Physiol., 167, 1296-1306.
- Kooiman, P. (1960). A method for the determination of amyloid in plant seeds. Recl. Trav. Chim. Pays-Bas, 79, 675-678.
- Mikami, H. and Ishida, Y. (1983). Post-column fluorometric detection of reducing sugars in high performance liquid chromatography using arginine. Bunseki kagaku, 32, E207-E210.
- Nishikubo, N., Takahashi, J., Roos, AA., Derba-Maceluch, M., Piens, K., Brumer, H., Teeri, TT., Stålbrand, H., and Mellerowicz, EJ. (2011). Xyloglucan endo-transglycosylase-mediated xyloglucan rearrangements in developing wood of hybrid aspen. Plant Physiol., 155, 399-413.
- Nishinari, K., Takemasa, M., Yamatoya, K., and Shirakawa, M. (2009). Xyloglucan, In “Handbook of hydrocolloids” ed. by GO Phillips and PA Williams, 2nd Ed, CRC press, Boca Raton, pp. 535-566.
- Nishitani, K. and Masuda, Y. (1981). Auxin-induced changes in the cell wall structure: Changes in the sugar compositions, intrinsic viscosity and molecular weight distributions of matrix polysaccharides of the epicotyl cell wall of Vigna angularis. Physiol. Plant., 52, 482-494.
- Prosky, L., Asp, NG., Furda, I., DeVries, JW., Schweizer, TF., and Harland, BF. (1984). Determination of total dietary fiber in foods and food products: collaborative study. J. Assoc. Off. Anal. Chem., 67, 1044-1052.
- Sadamasu, Y., Hirokado, M., Uematsu, Y., Hirata, K., Ito, K., Yasuda, K., and Suzuki, S. (1996). Survey on the quality of natural thickening and stabilizing agents used in food processing. Ann. Rep. Tokyo Metr. Res. Lab. P.H., 47, 182-188. (in Japanese)
- Schultink, A., Liu, L., Zhu, L., and Pauly, M. (2014). Structural diversity and function of xyloglucan sidechain substituents. Plants, 3, 526-542.
- Shibuya, N. and Iwasaki, T. (1978). Polysaccharides and glycoproteins in the rice endosperm cell wall. Agric. Biol. Chem., 42, 2259-2266.
- Shirakawa, M., Yamatoya, K., and Nishinari, K. (1998). Tailoring of xyloglucan properties using an enzyme. Food Hydrocolloids, 12, 25-28.
- Sone, Y. and Fujikawa, Y. (1993). Estimation of xyloglucan in vegetables by enzyme-linked immunosorbent assay. J. Nutr. Sci. Vitaminol., 39, 597-606.
- Sugawara, T. and Maekawa, A. (2000). “Hand book of foods analysis.” Kenpakusha, Tokyo. (in Japanese)
- Tabuchi, A., Mori, H., Kamisaka, S., and Hoson, T. (2001). A new type of endo-xyloglucan transferase devoted to xyloglucan hydrolysis in the cell wall of azuki bean epicotyls. Plant Cell Physiol., 42, 154-161.
- Tokumoto, H., Wakabayashi, K., Kamisaka, S., and Hoson, T. (2002). Changes in the sugar composition and molecular mass distribution of matrix polysaccharides during cotton fiber development. Plant Cell Physiol., 43, 411-418.
- Wakabayashi, K., Yamaura, K., Sakurai, N., and Kuraishi, S. (1993). Unchanged molecular-weight distribution of xyloglucans in outer tissue cell walls along intact growing hypocotyls of squash (Cucurbita maxima Duch.) seedlings. Plant Cell Physiol., 34, 143-149.
- Yamanaka, S., Mimura, M., Urakawa, H., Kajiwara, K., Shirakawa, M., and Yamatoya, K. (1999). Conformation of tamarind seed xyloglucan oligomers. J. Fiber Sci. Technol., 55, 590-596.
- York, WS., van Halbeek, H., Darvill, AG., and Albersheim, P. (1990). Structural analysis of xyloglucan oligosaccharides by 1H-n.m.r. spectroscopy and fast-atom-bombardment mass spectrometry. Carbohydr. Res., 200, 9-31.
- Yuguchi, Y., Fujiwara, T., Miwa, H., Shirakawa, M., and Yajima, H. (2005). Color formation and gelation of xyloglucan upon addition of iodine solutions. Macromol. Rapid Commun., 26, 1315-1319.
- Yuguchi, Y., Urakawa, H., Kajiwara, K., Shirakawa, M., and Yamatoya, K (2000). Gelation of xyloglucan polysaccharide extracted from tamarind seed. Proceeding of The Second International Workshop on Green Polymers, Bogor, pp. 253-263.


