Abstract
Studies on the effectiveness of substances such as drugs and cosmetics that act on the skin require structural evidence at the molecular level in the stratum corneum to clarify their interaction with intercellular lipid and soft keratin. For this purpose, when applying the substances to the stratum corneum X-ray diffraction experiment is one of the powerful tools. To detect minute structural changes in a stratum corneum sample, using a “solution cell”, dynamic synchrotron X-ray diffraction measurements were performed when applying aqueous solution of the substances to the stratum corneum: (1) It was found that a surfactant, sodium dodecyl sulfate, significantly disrupted the long-period lamellar structure. (2) To study the effects of water, structural modifications of the short-period lamellar structure and the soft keratin in corneocytes were measured as a function of time. At the initial water content of 15 wt%, the spacings of the short-period lamellar structure and the soft keratin increased toward those at the water content of 25 wt%, that is a key water content in the stratum corneum. (3) Nanoparticles composed of assembly of amphiphilic molecules are one of the leading pharmaceutical formulations. When the nanoparticles were applied, a new assembly of amphiphilic molecules originated from the nanoparticle appeared. This phenomenon suggests that the formation of the new assembly at the surface of skin is concerned with the release of the drug from the nanoparticles. (4) When ethanol was applied to the stratum corneum, only the liquid state in the intercellular lipid matrix was dissolved. After the removal of ethanol from this stratum corneum, the ordered hydrocarbon-chain packing structures appeared. From this fact we would propose that the liquid state region is the main pathway for hydrophobic drugs with a small molecular weight in connection with the so-called 500 Da rule. Here, not only the technique but also the background to these studies and the characteristic results obtained from these studies are explained.
1 Introduction
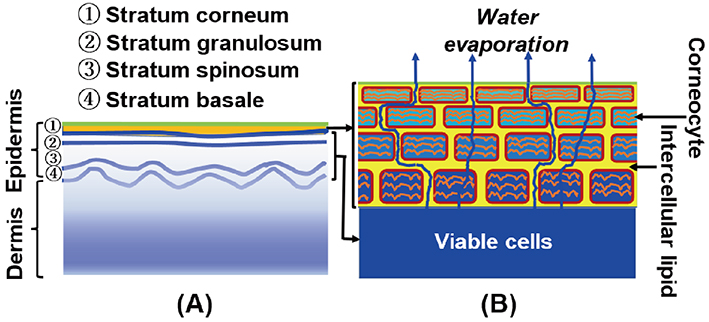
Skin is composed of a dermis and an epidermis, as schematically shown in Fig. 1 (A). The epidermis is usually formed from the surface of the skin as a stack of ① stratum corneum, ② stratum granulosum, ③ stratum spinosum, and ④ stratum basale. The dermis is thicker than the epidermis and is made up mainly of collagen and elastin fibers. In the basal layer (stratum basale) of the epidermis, new cells are formed by cell division. Upon leaving the basal layer, cells start to differentiate and migrate in the direction of the surface of the skin via stratum spinosum. At the stratum granulosum terminal differentiation occurs, during which the viable cells are transformed into corneocytes. In the stratum corneum (SC) the corneocyte is surrounded by a cornified cell envelope composed of cross-linked proteins and covalently bound lipids. The SC part is enlarged, as shown in Fig. 1 (B). The corneocytes are embedded in the intercellular lipid matrix. As discussed in the text, the water content in the SC decreases toward the surface of the skin. In Fig. 1 (B), in accordance with this phenomenon, the size of the corneocytes is drawn to decrease as they approach the surface. The SC provides a barrier that controls water loss from the underlying viable cells, while constantly evaporating water from the surface, as shown in Fig. 1 (B) ; it protects the organism from harmful environmental substances. This article focuses on how cosmetics and pharmaceuticals work by modifying the structures in the SCs.
The major lipid classes in the human SC are ceramides (CERs), cholesterol (CHOL) and free fatty acids (FFAs). The ratio of these lipid classes is approximately equimolar. In addition, low levels of other lipid classes are also present, such as cholesterol sulfate, glucosylceramides and cholesterol esters. In the human SC, more than 12 classes of CERs are present
1)
,
2)
,
3)
,
4)
,
5)
, where each one of these subclasses shows a large variation according to their carbon number. FFAs show a large variation in hydrocarbon-chain length
3)
,
5)
,
6)
,
7)
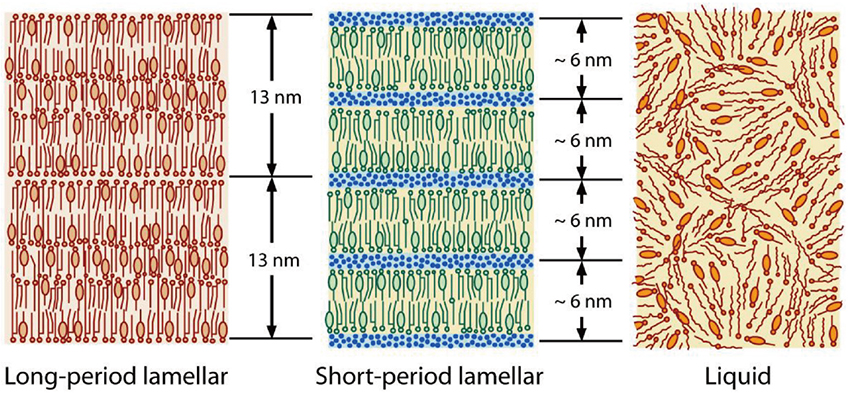
. In the human SC, the total number of intercellular lipids exceeds 350; the intercellular lipid matrix is composed of a complex mixture of these lipids. It is known that long- and short-period lamellar structures exist as well-organized ordered structures formed by the intercellular lipids, and there are well-organized hexagonal and orthorhombic hydrocarbon-chain packing structures in a plane orthogonal to the lamellar repeating direction. The molecular arrangements in the intercellular lipid matrix are schematically shown in Fig. 2 for the lamellar structures and in Fig. 3for the hydrocarbon-chain packing structures. These structures have observed not only in the human SC but also in the hairless mouse SC and other mammalian SCs. The repeated periodicity of the long-period lamellar structure (LLS) observed in the hairless mouse SC has been shown to be 13.6 nm
8)
. In the human SC the periodicity has been reported to be 13.4 nm
9)
. Even with SCs of the same species, each sample shows a clear repetitive periodicity, but the periodicity is distributed around 13 nm among samples. In the mammalian SC the periodicity lies in between 12.0 and 13.6 nm
10)
. On the other hand, the short-period lamellar structure (SLS) has periodicity of about 6 nm which depends on the water content in the SC, that is, the periodicity increases almost linearly with the water content
8)
,
11)
. In the SC, almost all water is stored in the corneocytes as shown in Fig. 1 (B), but a small amount of water is in the SLS, forming a water layer. It has been proposed that water in the SLS functions as a regulator of water content in the SC
11)
.
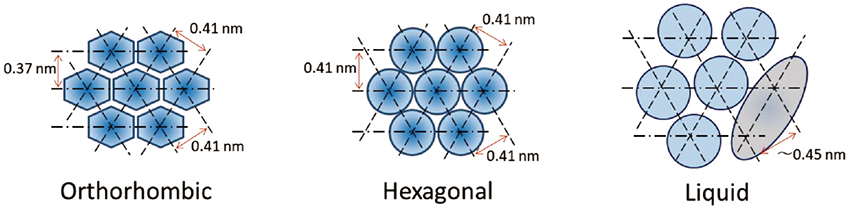
As shown in Fig. 3, in the orthorhombic hydrocarbon-chain packing structure (ORTHO), the lattice constants are 0.41 nm and 0.37 nm, and in the hexagonal hydrocarbon-chain packing structure (HEX) the lattice constant is 0.41 nm. These are the lattice constants of the major hydrocarbon-chain packing structures. The other lattice constants have been reported as minor structures
12)
,
13)
. In addition, the intercellular lipid matrix may contain large amounts of CHOL molecules, which should promote a liquid state (LIQUID) as shown in Fig. 3. Since an ordered hydrocarbon-chain packing is not formed in the LIQUID, its wide X-ray diffraction (WAXD) peak is broad and appears at about 0.45 nm. This also applies to the lamellar structures. A disordered arrangement of the intercellular lipids appears, as shown in Fig. 2.
As mentioned above, a monolayer of lipids is chemically linked to the cornified cell envelope. This lipid monolayer has a crucial role in the formation of the lamellar structures
14)
,
15)
,
16)
. Therefore, in the study of the function associated of the lamellar structure it will be essential to carry out the experiments not for the intercellular lipid model but for the SC. Furthermore, as discussed above, the lamellar structures and the hydrocarbon-chain packing structures are composed of a complex mixture of the various intercellular lipids; thus, the structures formed are probably difficult to replace with those of a model lipid system. From this viewpoint ex vivo study on the structures in the SC is extremely desirable.
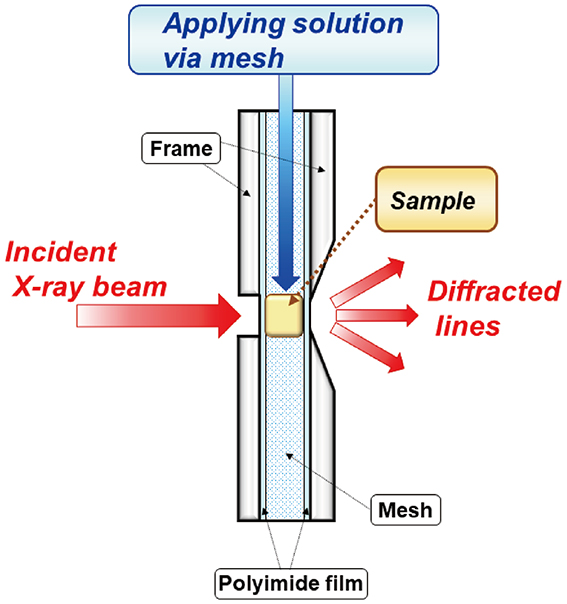
The measurements were performed using synchrotron X-ray diffraction (XRD) to investigate the intercellular lipid structure on applying a solution of various substances to the SC. Here a special sample cell, the “solution cell” developed by Hatta et al.
17)
, was used. The solution cell is schematically shown in Fig. 4. A thin SC sample was crumpled and embedded in a central hollow with cylindrical shape surrounded by a fine mesh (grade: GMF 150, Whatman plc, Little Chalfont, UK), composed of a glass microfilter. This fine mesh was used to sustain the SC sample, and allowed solution flow through the mesh without clogging. The front and rear surfaces of the cell were sealed by a pair of polymer thin films with a thickness of about 10 μm. The SC sample, placed in the middle of the sample cell, would be surrounded with full of solution, resulting in occlusive application. The solution was applied via the mesh, the initial volume was enough to immerse the SC sample. The incident X-ray beam impinged to the front surface of the seal.
The X-ray scattering vector S in the present paper is defined by
(1)
where λ is the wavelength of the X-ray and 2θ is the scattering angle. When the electron density in a substance changes periodically at the repeat spacing d, the XRD occurs according to Bragg’s law given by
(2)
where θB is half the scattering angle for the diffracted X-rays, and n is natural number. From Eq. (1) and Eq. (2), we can draw the scattering vector S
B where the diffraction occurs at
(3)
where n is called the diffraction order (n=1 is first-order, n=2 is second-order, and so on).
This method is particularly useful for detecting minute changes in structures. In general, applying solution to an SC sample causes a gradual change in the structure, and continuous observation of the XRD profile allows to detect the very small changes in only one sample. Using this solution cell, we were able to detect structural changes within seconds. As a result, this method can overcome the problem of individual differences among the SC samples. Normally, the XRD peak intensity depends on the SC sample. Due to individual differences, in some SC samples the peak intensity is large; in others, it is small. However, in each case, when the solution is applied to the SC sample, a systematic change in the intensity occurs regardless of the sample; although the magnitude of the change depends on the sample, it is possible to obtain high-precision minute changes regardless of individual differences. We then applied this method to detect the minute structural changes in the SC when solution with a cosmetic or a drug is applied to the SC sample. This article describes some typical results obtained using this method.
2 Molecular Origin of Damage Induced by Surfactant in Stratum Corneum
Detergents are important ingredients in body soaps and cleansers. However, harsh detergents can damage the skin. Many previous studies have argued that when the SC is treated with a surfactant, the water content in the SC decreases and trans epidermal water loss (TEWL) increases
18)
,
19)
,
20)
,
21)
,
22)
,
23)
. These studies indicate that surfactant reduces not only the SC lipid component, but also its amount. It has been pointed out that surfactant dissolves SC lipids and cause damage to them
20)
,
21)
,
22)
,
23)
,
24)
,
25)
,
26)
. The well-organized structures in the SC are particularly important for the barrier function, and detergents can impair this function by destroying these structures. We performed dynamic synchrotron XRD measurements to evaluate the structural modifications in the human SC resulting from treatment with a typical surfactant, sodium dodecyl sulfate (SDS), focusing on how SDS affects the lipid structures in the SC such as the lamellar structure and the hydrocarbon-chain packing structures.
The dynamic XRD experiments were carried out on the human SC in the range from S=0.07 to 3.0 nm−1, which covered the diffraction peaks from the lamellar structures, the soft keratin and the hydrocarbon-chain packing structures
27)
. Hereafter, the water content (wt%) is defined as the weight of water / (total weight of water and dry SC) ×100. The dried sample was rehydrated in an incubator until it was hydrated at the water content of 25 wt%. A solution containing 10 wt% SDS was prepared in Carmody buffer (pH 7.0). The solution cell was used to detect and quantify structural changes when applying the solution or water to the human SC at approximately 25°C. The SC samples were exposed to a synchrotron X-ray beam for 30 sec to obtain an X-ray scattering profile over the wide range. The small-angle X-ray diffraction (SAXD) profiles for the LLS and the SLS of the human SC after treating with 10 wt% SDS and without SDS are shown in Figs. 5 (A) and 5 (B), respectively
27)
. Frequently, the X-ray scattering profile jumps were observed between before and after application of the solution. This is due to the fact that the sample moved by the initial flow pressure when applying the solution to the sample; sometimes the X-ray scattering intensity was affected by the absorption of X-rays by water in the solution. The “Pre” profile is shown in Fig. 5 as a reference indicating the initial sample characteristics; some information was obtained, for instance from the peak positions of the XRD profile that were less affected by these effects.

We focused our attention to the third-order peak of the LLS in the SC, as this was almost isolated from the peaks caused by the other structures. As shown in Fig. 5(A), when applying the 10 wt% SDS solution, the third-order peak of the LLS near S=0.22 nm−1 was deformed and gradually disappeared. Without SDS, the third-order peak did not change, as shown in Fig. 5 (B). The first-order peak of the SLS near S=0.16 nm−1 did show no change by water or 10 wt% SDS treatment. The intensity and position of the peaks corresponding to the hydrocarbon-chain packing structures did not change significantly with or without SDS. Furthermore, in agreement with the previous report
28)
, the 10 wt% SDS solution itself showed a broad peak centered at S=0.275 nm−1 in the range of S=0.13 nm−1 to 0.45 nm−1. As shown in Fig. 5 (A), this broad peak did not affect the profile of the SC treated with the SDS solution. Based on the above findings, we propose that only the LLS are essentially affected by SDS; therefore, the molecular origin of damage to the SC caused by SDS lies within the LLS.
To elucidate the detailed behavior of the LLS, the third-order XRD profile was analyzed by fitting to two Gaussian functions and a straight line. As shown in Fig. 6 (B), the strong intensity indicated by black circle increases first, reaches a maximum, and eventually disappears. On the other hand, the weak intensity indicated by white circle monotonically decreases and eventually disappears. In the same order, the spacing indicated by black circle in Fig. 6 (A), initially decreases in a short time, then gradually increases, and eventually saturates. Furthermore, the spacing indicated by white circle monotonically increases and becomes almost saturated when the intensity becomes zero. Thus, the above behavior indicates that SDS affected the LLS via two routes, eventually leading to a disordered LIQUID, as seen when the intensity associated with the LLS disappeared. In the case of 1 wt% SDS treatment, the structural change exhibited a behavior similar to that of 10 wt% SDS treatment, but owing to the weak diffraction peak, the behavior corresponding to the behavior of the black circles in Fig. 6 predominantly occurred
29)
.

To further consider the above behavior of the LLS, it is important to clarify the localization of water in the LLS. In connection with this fact, (1) in the XRD experiments on the human SC
30)
, no clear water swelling was observed in the LLS, but the diffraction peak width narrowed at the water content of about 25 wt%; (2) in the XRD experiments of the hairless mouse SCs performed at the various water contents, the diffraction peak width narrowed when the water content reached about 25 wt%, but no clear swelling was observed in the LLS
8)
. The above fact indicates that the LLS is stabilized at the water content of 25 wt%. In connection with these facts, the results obtained from a neutron diffraction study on an SC model lipid mixture consisting of CERs, CHOL and FFAs
31)
is very interesting for investigating the interaction of SDS to the LLS. In this model involving CER EOS and CER NS, Mojumdar et al.
31)
observed a neutron diffraction peak at the position that was coincided with the spacing of the LLS in the ex vivo SC. The results of the neutron scattering experiments indicated that water molecules are located in two crystallographic positions in an LLS in the model. One is near the unit cell boundary of the LLS and the other is in the interior region of this unit cell. Overall, we speculate that the water molecules in the LLS in the SC are taken up in two places, stabilizing the structure without major changes in the repeat distance. Then, the split of the spacing and the decay of the LLS observed in the SC sample treated by SDS appears to be related to the localization of water to these two positions observed by the neutron scattering experiments. It is speculated that the SDS molecules penetrate the two positions, resulting in the destruction of the LLS.
This study clearly demonstrates the process of the human SC decay caused by the surfactant SDS. At the molecular level, among the various ordered structures in the intercellular lipid matrix of the SC, only the LLS was disrupted by the SDS solution. In connection with this fact, we recall the pioneering work proposed by Bouwstra et al.
32)
and Kuemple et al.
33)
, in which CER EOS plays an important role in the formation of the LLS. In these studies, the LLS displays a broad-narrow-broad pattern of lucent bands, as revealed by transmission electron microscopy. It has been proposed that, in the pattern formation, the ω-hydroxyl group of the CER EOS spread over a wide lamella and the tail of linoleic acid is inserted into a narrow lamella. Furthermore, reduction of CER EOS has also been pointed out in diseased skin such as atopic dermatitis
34)
, psoriasis
35)
, ichthyosis
36)
and winter skin
37)
. Therefore, the SDS-treated SC is useful in examining the effects of cosmetics or pharmaceuticals on the SC of diseased or damaged skin at the molecular level. In fact, it has been confirmed that the LLS can be recovered by applying a nanoparticle containing CER EOS to the SC damaged by SDS
38)
. In addition, in the molecular development of cleansers, it is necessary to consider the effect of surfactants on the LLS.
3 Water Content, 25 wt%, That Is One of the Key Water Contents in Stratum Corneum
The normal skin surface is exposed to a variety of serious environments, but its physiology and properties under strict control all the times so that it remains healthy. Occasionally, the surface may be exposed to very dry conditions. Under these conditions, a mechanism is needed to keep the water content of the skin surface unchanged. Here, we consider the behavior of water in the outermost layer of the SC at the molecular level, which controls such a mechanism.
In vivo confocal Raman microscopy (CRM) experiments are a powerful tool for detecting the distribution of the water content in the SC. Many results have been published with comparable results
39)
,
40)
,
41)
. The water content is low near the surface of the SC and increases from the surface to the viable epidermis, where it reaches approximately 70 wt%
39)
,
40)
,
41)
. When the water content is linearly extrapolated toward the surface from the deep SC, the water content at the surface is close to 25 wt%. However, the reported water content near the surface of the SC varied among different studies. In some reports, the water content deviates upward from the straight regression line near the surface of the SC
39)
; the degree of the deviation depended on the reports. This may be due to the fact that the skin is in contact with the window of the CRM device, and hydration levels near the surface of the skin are affected by occlusion during the experiment
42)
. In addition, the surface of the skin is rough, with ridges and furrows; desquamation occurring on the surface of the skin, cause irregularities near its surface. As a result, water might apparently build up near the surface of the skin. These consequences may result in the increase of the water content near the surface of skin. Consequently, we can regard that in the steady state, the water content near the surface is, in principle, around 25 wt% under the condition that water evaporates continuously from the surface through the SC.
Several results have indicated the specificity of the water content of 25 wt%. Among them, the results observed by differential scanning calorimetry (DSC) provide important evidence. The transition enthalpy at the freezing point of water has been measured as a function of the water content in the SC
43)
,
44)
. It has been shown that the transition enthalpy decreases as the water content decreases and that the transition enthalpy does not appear below the water content of 25 wt% (in their definition of the water content
44)
33 wt% [(=weight of water / weight of dry SC) ×100 wt%])
44)
. This indicates that the water in the SC exists as tightly bound water when the water content is less than 25 wt% and as free water when the water content is more than 25 wt%. Combined with the results of the CRM experiments, it is inferred that water near the surface of the skin is mainly composed of tightly bound water.
Near the surface of skin, most of the water is stored in the corneocytes as tightly bound water rather than in the intercellular lipid matrix. It has been pointed out that water retention in the SC is achieved by the presence of natural moisturizing factor (NMF) in the corneocytes
45)
,
46)
,
47)
. The 13C NMR study by Jokura et al.
48)
provides clear evidence for the behavior of NMF in the corneocytes. According to their argument, keratin filament in the corneocytes is substantially divided into two regions, a non-helical amorphous region and an α-helical central core region. The NMF in the corneocytes serves two roles. Hydrated NMF has ionic interactions with keratin fibers. This creates elasticity between keratin filaments via the non-helical region. In addition, water molecules around NMF form hydrogen bonds. These two roles may be inseparable in the corneocytes. Therefore, it is deduced that the hydrogen-bonding formation in the corneocytes is related to the formation of structure with the 1 nm spacing in the soft keratin, as discussed later.
A small portion of the water resides in the SLS in the intercellular lipid matrix. As shown schematically in Fig. 2, the SLS has water layers and with increasing the water content in the SC the layer thickness increases, i.e., swelling takes place
8)
,
11)
. In the XRD study of the SLS, in addition to swelling phenomenon the width of the diffraction peak becomes narrow at the water content of 25 wt% in the SC
8)
,
11)
. This indicates that the SLS is regular, and the structure is stabilized at the water content of 25 wt%. Therefore, in the SC, the SLS regulates the water content to be maintained at 25 wt%, while the corneocytes function as a reservoir of water.
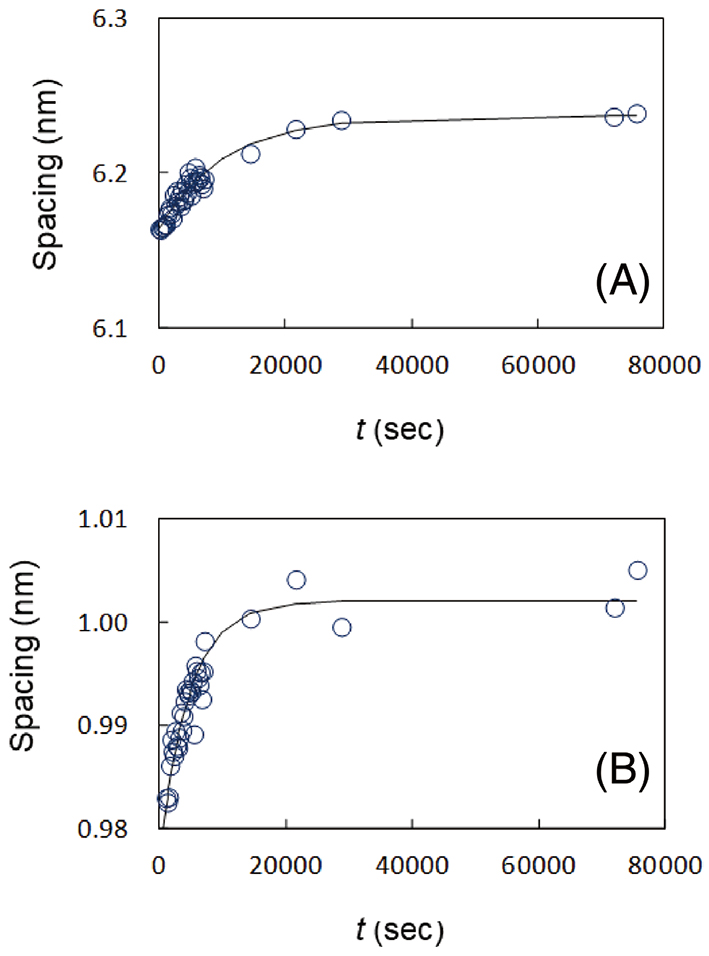
Under these circumstances, the dynamic XRD measurements were performed using the solution cell to study kinetic behavior of the SLS and the soft keratin, when water was applied to a human SC. For the measurements, the initial water content of the SC sample was set to be 15 wt% in the human SC. Sequential changes in the XRD profiles of the SLS and the soft keratin are shown in Figs. 7 (A) and 7 (B), respectively. Both profiles changed markedly with time. These profiles were analyzed by fitting them to a Gaussian function and a straight line. Figures 8 (A) and 8 (B) show the spacings of the SLS and the soft keratin as a function of time, respectively. At a glance, both spacings increased with time. The changes of the spacing of the SLS and the 1 nm-spacing due to the soft keratin were tentatively analyzed by a relaxation function. The spacing for the SLS seems to increase at a relaxation time of approximately 200 minutes, and the spacing for the soft keratin seems to increase at a relaxation time of approximately 100 minutes. The fact that the above relaxation times are close to each other might indicate that the exchange of water molecules between the short lamellar structure and the corneocytes occurs relatively quickly. The fact that the relaxation time is slightly longer in the short lamellar structure might indicate that the SLS plays a role on the regulation of the water content in the SC.

In addition to the study on the hydration effect of the SC, the study on the dehydration effect is much interesting because dryness causes skin damage. However, XRD study on the SC during drying has been rarely performed. Yamada et al.
49)
carried out the dynamic wide-angle X-ray diffraction (WAXD) measurement during drying of the fully hydrated SC. By the highly sensitive detection of the XRD profile using the solution cell, it was found that in the ORTHO the spacings and the widths showed very small but characteristic changes as follows. The overall changes of the widths were about 10% but those of the spacings were only about 0.1%. Nevertheless, it is clear that changes during drying can be described in different stages: Stage Ⅰ, where the widths and the spacings decrease in a short time by the start of drying; Stage Ⅱ, where they remain nearly flat; Stage Ⅲ, where they increase in a short time; Stage Ⅳ, where they become almost flat. From the fact that the widths became narrow and the spacing became tight for a while at stage Ⅱ, it was concluded that the stage Ⅱ is a stable state and therefore its water content is maintained at approximately 25 wt%. The important point obtained from this study is that the stable condition is maintained for a long time, even when the SC is exposed to extremely dry conditions. Therefore, skin is biologically designed to remain normal even in harsh climates such as harsh dry environments.
The effects of water on the LLS have been partially described above. The static XRD experiments showed that the peak width of the XRD narrowed at the water content of 25 wt%, but the spacing did not change
8)
,
9)
. On the other hand, the dynamic XRD experiments using the solution cell revealed that after water was applied to the hairless mice SC
50)
,
51)
, the spacing expanded, and the expansion was smaller than the size of one water molecule. The result that the water molecule is located at the two crystallographic positions, obtained from the neutron diffraction experiments of the skin lipid model
31)
, may be related to this phenomenon. The cause of this slight change and the narrowing of the peak width at 25 wt% are not clear at present. In the future, it will be important to clarify the overall picture of the water content of 25 wt%, including the role of water in the LLS.
4 Penetration of Drug-loades Nanoparticles into Stratum Corneum
Although the SC may impede transdermal penetration of nanoparticles, drug-loaded nanoparticles have been examined as formulations
50)
,
51)
. Among them phospholipid nanoparticle has been frequently used because they are thermodynamically stable and spontaneously formed due to amphiphilic nature of phospholipid molecules
50)
. However, as pointed out by Williams and Barry
52)
, there is no compelling evidence to suggest that phospholipids forming vesicles interact directly with the hydrocarbon-chain packing structures in the SC. Nevertheless, when drug-loaded phospholipid nanoparticle and related nanoparticle are applied to the SC, many studies have shown the penetration of drug molecules. Here, we investigated such scenarios by performing the dynamic XRD experiments using the solution cell.
We first discuss the case where phospholipid nanoparticle with tocopherol acetate (MW: 473), consisting of 3-O-cetyl ascorbic acid, soybean phosphatidylcholine and sodium collate, hydrated with citrate buffer containing glycerol, was applied to the hairless mouse SC
50)
. The vesicle size of the nanoparticle was approximately 140 nm. First, we performed the SAXD measurements only on the nanoparticle suspension, and we observed the intensity profile having broad peaks at about 0.14 and 0.28 nm−1, which corresponded to the first- and second-order diffraction peak of the lamellar structure in the nanoparticular vesicles, respectively. In Fig. 9, the profile around the first-order broad peak is shown with a red curve. Next, we performed the SAXD measurements only on the hairless mouse SC. The profile around the second-order peak of the LLS is shown in Fig. 9 with a black curve. Then, using the solution cell, the dynamic SAXD experiments were performed when applying the nanoparticle suspension to the SC. Since it had been observed that tocopherol acetate was accumulated in the dermis from permeation measurements using Franz-type diffusion cells
50)
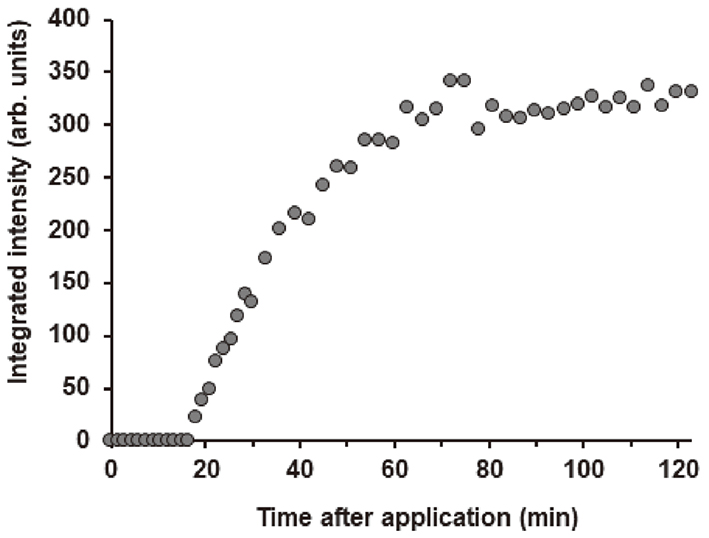
, we focused on the principle of action of the nanoparticle on the SC and the mechanism by which the nanoparticle releases tocopherol acetate. After the application of the nanoparticle vesicles, the broad peak due to the nanoparticle vesicles at S∼0.14 nm−1 (the corresponding spacing: ∼7 nm) moved to the relatively sharp peak due to the multilamellar structure at S∼0.11 nm−1 (denoted by a blue arrow, the corresponding spacing 9 nm). Such a structural change did not occur without tocopherol acetate. Therefore, the multilamellar structure that emerged as a result of the application of nanoparticle vesicles can be considered to be free of tocopherol acetate. Figure 10 shows the integrated intensity of the new lamellar peak as a function of time, where the definite intensity appeared after 17 min. The spacing and the width of the new lamellar structure were almost unchanged. Based upon these phenomena, we speculated the following. (1) Initially, the nanoparticle components accumulated around the SC surface. (2) After the time required to form the new lamellar structure, tocopherol acetate was released into the SC. (3) The new drug-free lamellar structure grew on the SC surface. The above interpretation is speculative; however, it is certain that in the intermediate between the nanoparticle vesicles and the new lamellar structure, tocopherol acetate was released in the SC.

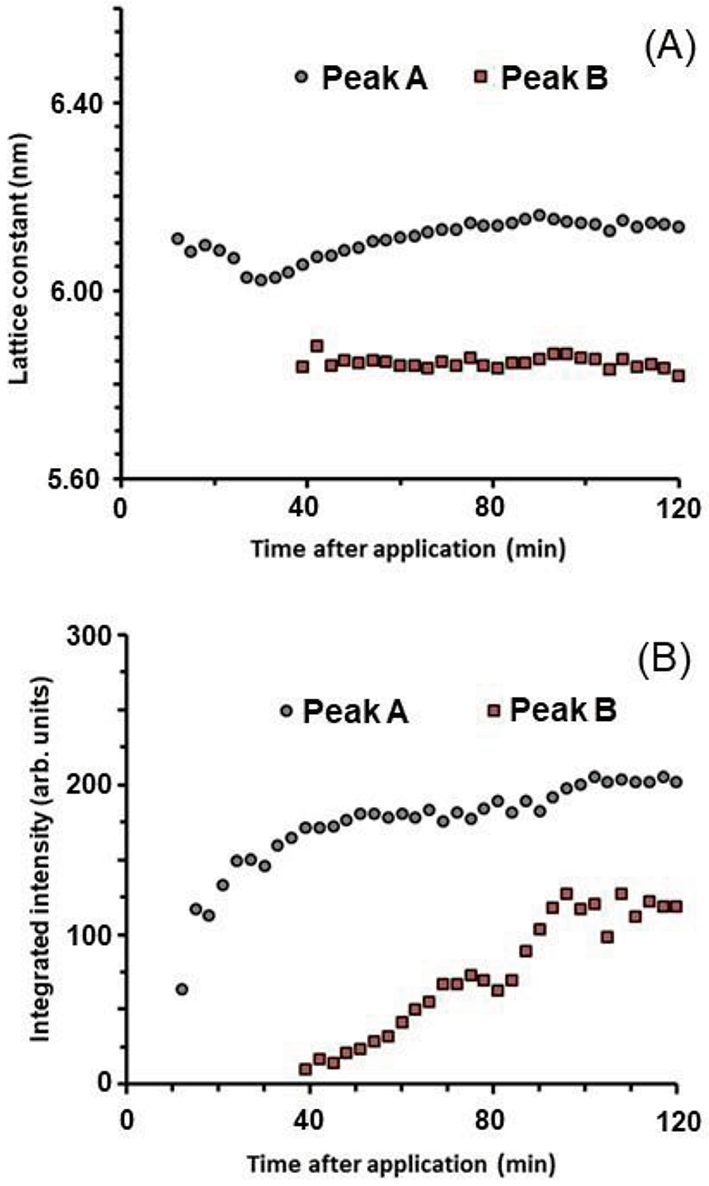
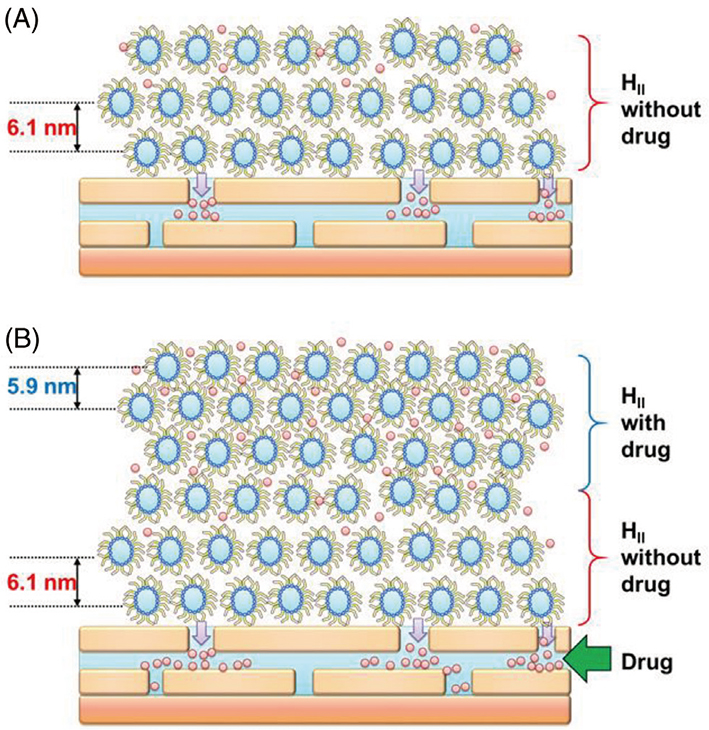
Second, we describe a case in which a nanoparticle, formed by a 1-glyceryl monooleyl ether-based inverted hexagonal liquid-crystalline structure that captures flurbiprofen (MW: 244), was applied to the hairless mouse SC
51)
. The nanoparticles were approximately 150 nm in diameter. As it is known that flurbiprofen in the inverted hexagonal liquid-crystalline structure permeates in the SC
51)
, we focused on the principle of action of the nanoparticle on the SC and the mechanism by which the nanoparticle releases flurbiprofen. After applying the nanoparticle dispersion to the SC, the XRD profiles in the range from S=0.17 to 0.23 nm−1 were observed every 3 min for 0.75 min to 120.75 min (see Fig. 11). A single peak and two subsequent peaks appeared, denoted by Peak A and Peak B. The peaks were analyzed by fitting them to two Gaussian curves and a straight line. Prior to this dynamic measurement, the static X-ray scattering experiment was performed on a flurbiprofen-loaded nanoparticle and a flurbiprofen-free nanoparticle
53)
, where the lattice constant of (1,0) diffraction peak in the inverted hexagonal liquid-crystalline structure was 5.9 nm and 6.1 nm, respectively. The change of the lattice constants over time was obtained as shown in Fig. 12 (A). The lattice constants are classified into two categories. One spacing associated with Peak A is close to the (1,0) lattice constant of the drug-free nanoparticle (6.1 nm), and the other spacing associated with Peak B is close to the (1,0) lattice constant of the drug-loaded nanoparticle (5.9 nm)
53)
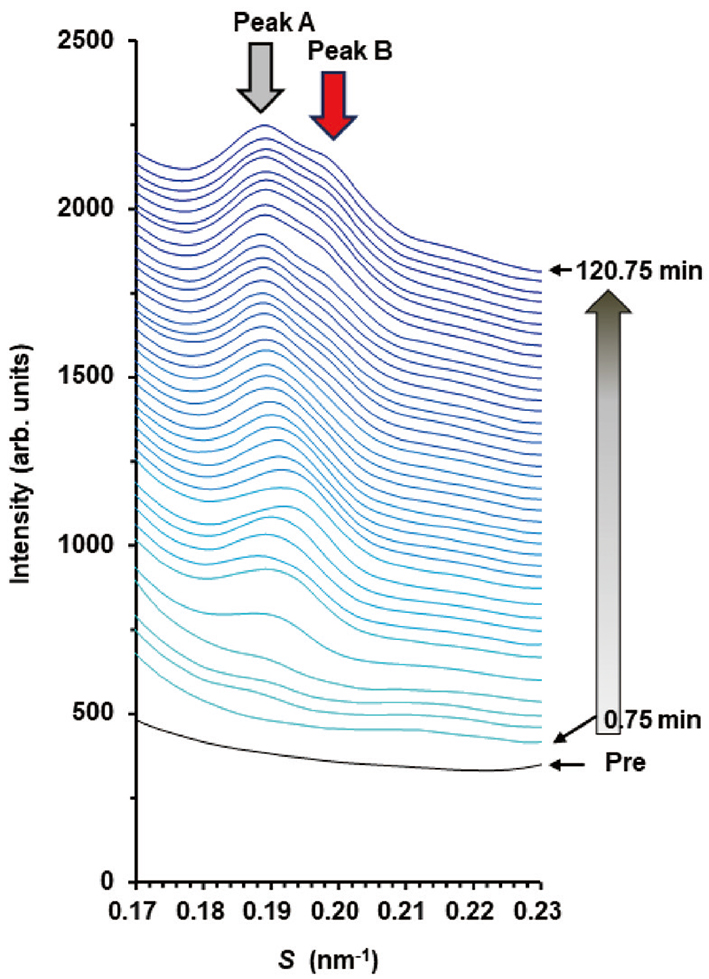
. As can be seen in Fig. 12 (B), the integrated intensity for Peak A appeared after a very small absence interval, but that for Peak B appeared later. The above fact suggests that the structure originated from the drug-free nanoparticle appeared first, the structure originated from the drug-loaded nanoparticle appeared second. Based on these behaviors, it is inferred, as shown in Fig. 13 schematically, that: (1) Owing to the interaction between the nanoparticle and the surface of the SC, when the nanoparticles come into contact with the surface of the SC, the temporary entanglement state of the inverted hexagonal hydrocarbon-chain packing structure containing the drug increases [see Fig. 12 (B)] , note the initial absence interval of the integrated intensity of Peak A. Here, we focus on the fact that the initial absence interval in Fig. 12 (B) is shorter than that in Fig. 10. This phenomenon may be due to the nature that the surface of the former nanoparticle is relatively hydrophilic and that of the latter is relatively lipophilic. (2) The internal strain of the drug-containing inverted hexagonal hydrocarbon-chain packing structure was released the drug into the SC and reduced its strain, resulting in the formation of a drug-free inverted hexagonal structure, as shown in Fig. 13 (A). (3) As the distance from the surface of the SC increased, the strain between the drug-free and the drug-loaded inverted hexagonal hydrocarbon-chain packing structures was relaxed, resulting in the piling up of the latter structure on the former, as shown in Fig. 13 (B). The above interpretation is speculative, but it is certain that in the process that occurs through the SC surface from the drug-loaded inverted hexagonal structure to the drug-free inverted hexagonal structure, the drug released into the SC.
To release drug from the drug-loaded nanoparticle to the SC, the nanoparticle may undergo structural changes on the surface of the SC and the drug may move to the intercellular lipid matrix of the SC, probably through a transient unstable state derived from the nanoparticle. The detailed mechanism of this process that occurs just above the surface of the SC needs to be studied in the future.
5 A Possible Interpretation on 500 Da Rule
Many studies have pointed out that the intercellular lipid matrix has a LIQUID in which the arrangement of lipid molecules is disordered as shown in Figs. 2 and 3. The WAXD experiments on the untreated SC sample have shown that the LIQUID has a broad peak at about 0.45 nm
54)
,
55)
,
56)
,
57)
; however, in the similar range a broad peak is superposed due to the soft keratin. In studying the mechanism of substance penetration into the SC, it is important to clarify the proportion of the LIQUID in the intercellular lipid matrix. It is difficult to distinguish the magnitude of the two peaks appeared at approximately 0.45 nm. Owing to this fact, so far, little consideration has been given to the role of the LIQUID in the penetration of substances in the SC. To estimate this broad peak, a WAXD of delipidized SC samples was carried out. The delipidization was accomplished by treating them with a 1:1 chloroform-methanol mixture
54)
,
55)
,
56)
,
57)
,
58)
, which removed a large portion of the intercellular lipids. Doucet et al.
59)
proposed an ingenious method for estimating the relative amount of the lipids in the LIQUID: they subtracted the WAXD profile of the delipitized SC sample from that of the untreated SC sample. From this, the profile of the lipid portion could be derived. They assumed that the lipids composed of both the crystalline structures (HEX and ORTHO) and the LIQUID were uniformly removed by the delipitization. By analyzing the X-ray scattering profile of the intercellular lipids, the population of the intercellular lipids in the LIQUID was estimated to be approximately 80%. As pointed out by Doucet et al.
59)
this may be overestimated because the lipids in the LIQUID may be preferentially extracted. Here we considered this issue from a different perspective.
To the best of our knowledge, there are a lot of solvents that can be used to extract the intercellular lipids in the SC. It is known that the intercellular lipids are extracted markedly by chloroform/methanol mixture
60)
,
61)
, a hexane/methanol mixture
61)
, and an acetone/ether mixture62, 63) ; slightly by acetone
61)
,
64)
,
65)
,
66)
,
67)
,
68)
and hexane
61)
,
65)
; and very slightly by ethanol
65)
,
69)
. Here, we focused on the effect of ethanol on the intercellular lipids. Based on the results of in vivo infrared spectroscopy, Bommannan et al.
69)
have proposed that ethanol enters the SC and might slightly extract the intercellular lipids; however, ethanol does not cause a collapse of the ordered hydrocarbon-chain packing structures. Therefore, ethanol within the SC is expected to affect significantly the intercellular lipids in the LIQUID in the SC.
The dynamic WAXD experiments were performed on the assumption that the lipids in the LIQUID would dissolve in ethanol
70)
, since ethanol dissolves CER
71)
, FFA
71)
and CHOL
73)
individually. The solution cell was used to obtain profiles every 210 seconds while exposing the human SC to ethanol for up to 11000 seconds. Subsequently, ethanol was removed from the SC for a total of 22 hours. The change in the XRD profile obtained by this procedure is shown in Fig. 14. The “Pre” profile was obtained before applying ethanol (shown as the lowest red curve) ; it exhibits dominant peaks at S=2.4 (0.41 nm) and 2.7 nm−1 (0.37 nm) and is superimposed on the wide peak from S∼2.2 nm−1 (∼0.45 nm) composed of the wide peaks originated by the LIQUID and the soft keratin. When ethanol was applied to the SC sample, the profile changed continuously from 0 to 11000 seconds as shown by the red to blue curve at the top in Fig. 14. Subsequently, ethanol was continuously removed from the ethanol-treated SC sample for up to 22 hours. As seen in the blue profiles at 6 and 22 hours after the removal in Fig. 14, the profile shifted lower after removing ethanol from the corneocytes. We then focused our attention on the temporal change of the peaks at S=2.4 and 2.7 nm−1. The change of each of the peaks for the hydrocarbon-chain packing structures was analyzed by fitting to the sum of a Gaussian function and a straight base line. In this analysis, the straight baseline lay just below the sharp peaks, so the wide peak resulting from the soft keratin had no effect. Figures 15 (A) and 15 (B) show the spacing of 0.41-nm peak and its integrated intensity over time, respectively and the 6-h and 22-h data are displayed at the 12000 second position. Figures 16 (A) and 16 (B) show the spacing of 0.37-nm peak and its integrated intensity over time, respectively and the 6-h and 22-h data are displayed at the 12000 second position. As seen in Figs. 15 (A), 15 (B), 16 (A) and 16 (B), the spacing and the integrated intensity were almost unchanged from the start until 11000 s. These facts indicate that ethanol in the SC did not affect the ORTHO and HEX. This is consistent with the results obtained from in vivo infrared spectroscopy
69)
.
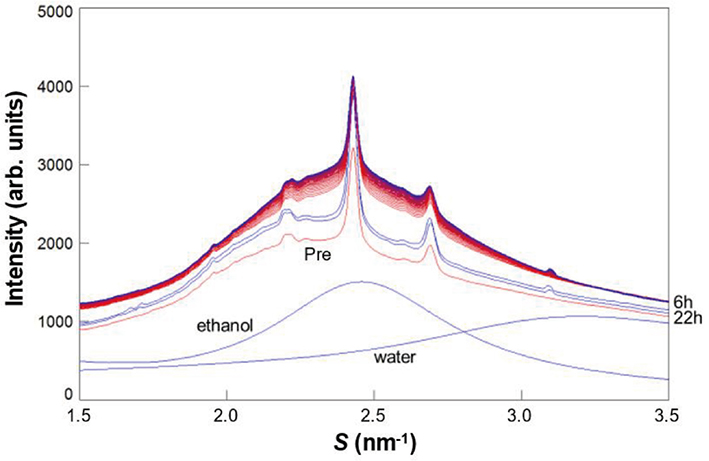
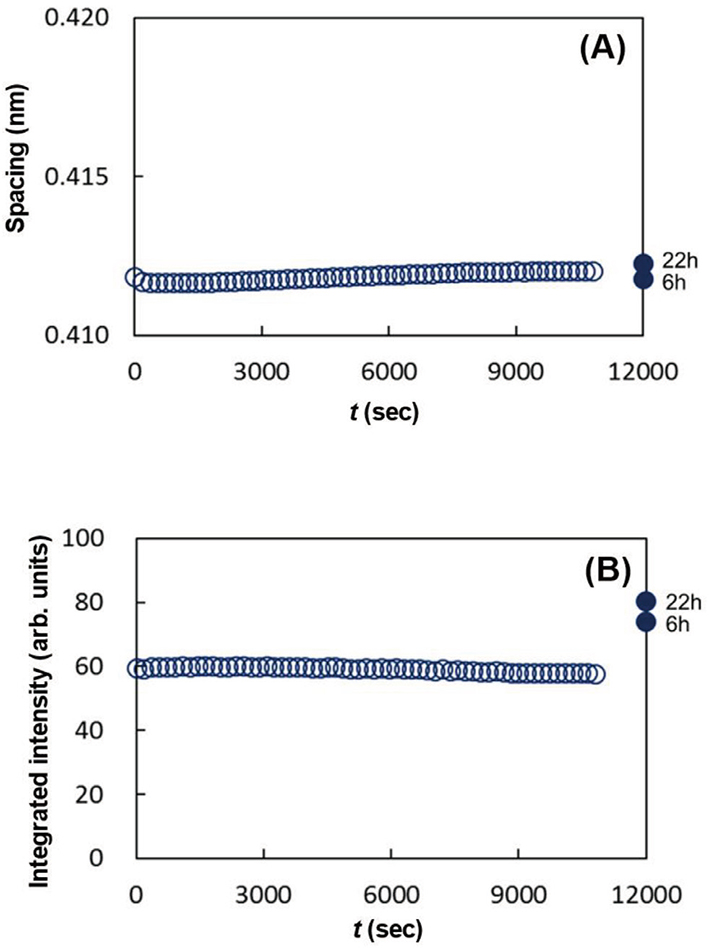
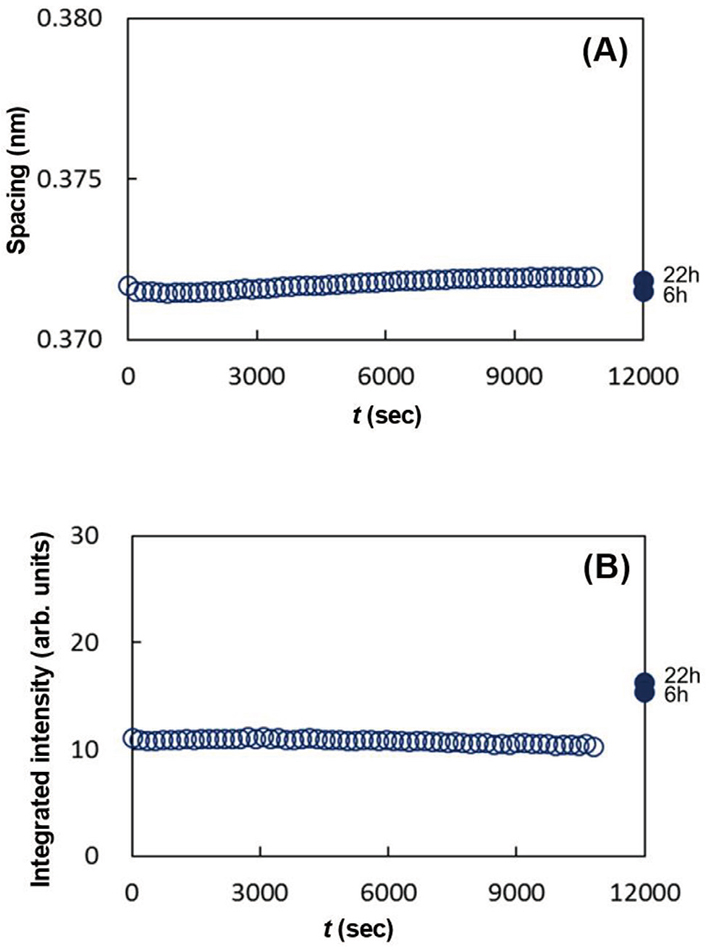
As seen in Figs. 15 (A), 15 (B), 16 (A) and 16 (B), the data denoted by 6 h and 22 h show characteristic behavior. After the removal of ethanol, the spacings, 0.41 nm and 0.37 nm, did not show remarkable change, however, the integrated intensities for both the spacings increased markedly. These indicate that by removing ethanol the ORTHO and the HEX regions emerged from the solution of the LIQUID melted in ethanol, and the newly formed ORTHO and the HEX regions had almost the same lipid composition as that before applying ethanol. Figure 17 schematically illustrates what is happening in the above process. A shows the ratio of regions occupied by the ORTHO, the HEX and the LIQUID before applying ethanol. B shows the change of these regions when the SC sample was immersed in ethanol. Both the ORTHO and HEX regions were unaffected, but the lipids in the LIQUID melted in ethanol to form a solution. C indicates that after ethanol was removed from the solution composed of the lipids and ethanol, the ORTHO and HEX regions increased, as indicated by the arrows.

Prior to estimation of the proportion of the lipids in the LIQUID, the integrated intensities of the 0.41-nm peak and 0.37-nm peak were analyzed; before exposing ethanol the integrated intensities of 0.41-nm peak and 0.37-nm peak are given by I
0.41
pre-treated and I
0.37
pre-treated(see the regions ORTHO and HEX in A in Fig. 17), respectively, and after removing ethanol from the ethanol-treated SC given by I
0.41
post-treated and I
0.37
post-treated (see the regions ORTHO and HEX in C in Fig. 17), respectively. The ratios, I
0.41
post-treated /I
0.41
pre-treated and I
0.37
post-treated /I
0.37
pre-treated, are calculated as shown in Table 1 for SC sample #1, #2 and #3 from different SC samples. Here, we should note that the ratio thus obtained is minimal, because the lipids of the LIQUID might be not completely soluble in ethanol and furthermore not all the dissolved lipids are involved in crystallization (formation of the ORTHO and the HEX) from the solution due to the difference in nucleation and crystal growth, that is, a part of the dissolved lipid are crystallized. Therefore, it is reasonable to adopt the maximum value for the estimation of the region occupied by the LIQUID. As shown in Table 1, the largest value of I
0.41
post-treated/I
0.41
pre-treated and I
0.37
post-treated/I
0.37
pre-treated is close to 2.0. Therefore, if all the lipids in the LIQUID are dissolved in ethanol and are involved in crystallization, the ratio is considered to be more than 2, that is, the proportion of the lipids of the LIQUID is estimated to be greater than 50% in the whole intercellular lipids. As mentioned above, from the results proposed by Doucet et al.
59)
the proportion of the lipids of the LIQUID is less than 80% of the total intercellular lipids. Therefore, as a whole we propose that the proportion of the lipids in the LIQUID lies between 50% and 80% in the whole intercellular lipids. Therefore, the region occupied by the disordered LIQUID should play an important role in the penetration of substances through the SC.
Table 1
Integrated intensity ratio of the pre-treated and the post-treated stratum corneum with ethanol for the lattice constants of 0.41 and 0.37 nm, where the integrated intensities are denoted by
I
0.41
pre-treated and
I
0.37
pre-treated before treating by ethanol and by
I
0.41
post-treated and
I
0.37
post-treated after removing ethanol, respectively. The data for three stratum corneum samples, #E1, #E2, and #E3, are shown
70)
.

We further consider the role of the disordered LIQUID in percutaneous penetration. For the penetration of hydrophobic molecules, 500 Da rule has been proposed by Bos and Meldardi
74)
, where argued that the molecular weight (MW) must be less than 500 to allow the penetration in skin and that larger molecules cannot penetrate. In opposition to this proposal, Roberts et al.
75)
argued that, when they examined molecules over 500 Da, this was not the case. More precisely Potts and Guy
76)
analyzed the data set (more than 90 solute compounds with MW ranging from 18 to over 790, and logK
o/w ranging from −3 to 60) and proposed that the permeabilities are expressed by an elegant empirical relation of MW and logK
o/w that also applies to molecules above 500 Da. Mitragotri
77)
has proposed a similar relation theoretically, based on a model on the lipid bilayers using a computer simulation. In this model the ordered lipid bilayers have been taken into account. However, as pointed out above, the region composed of the LIQUID functions as the dominant root in the percutaneous penetration of hydrophobic molecules. This point will be discussed in detail below.
In the study on the 500 Da rule, we estimated the MW of the most predominant molecules in the LIQUID. The region formed by the most dominant molecules in the LIQUID are one of the most likely routes in the penetration of foreign molecules having similar physicochemical properties as the lipids in the LIQUID. Therefore, it is inferred that the estimation of the average weight of the most predominant molecules in the LIQUID provides a measure of the MW of the foreign molecule that can easily penetrate the SC. In the human SC, the intercellular lipids are dominantly composed of CERs (50 wt%), CHOL (25 wt%) and FFAs (15 wt%)
78)
,
79)
,
80)
. The MW of CHOL is 387 Da. In the human SC, the relative abundance of FFAs is highest at the chain length of carbon number 24, where the chain length distribution spreads over carbon number from 12 to 36
7)
,
81)
. Therefore, the central MW of FFAs is about 369 Da (C24H48O2). The relative abundance of CERs is highest at carbon number 46 and that of CER subclasses is highest at CER NP
3)
. Therefore, the central MW of CERs is about 724 Da (C46H93NO4). In the CERs, although the relative abundance of carbon number makes roughly two peaks at carbon number 46 and 68, where the latter chain number belongs to the CERs [EO] subclasses, the relative abundance of CERs is extremely higher in the former than the latter, then in the estimation of the central MW of CERs we took this fact into account. To estimate the average MW of the intercellular lipids in the LIQUID, we tentatively calculated the sum of the central MWs weighted by their population. As a result, the average MW was 514±25 Da, where the deviation was estimated by fitting the carbon number distribution to the Gaussian curve. However, since CHOL molecules are excluded from the ordered hydrocarbon-chain packing structures (ORTHO and HEX), the average MW of the lipids in the LIQUID should be much smaller. Based upon this result, when a hydrophobic molecule of approximately 500 Da is applied to the surface of the SC, it is speculated that it merges with the lipids in the LIQUID and then permeates and diffuses into the intercellular lipid region with the LIQUID. The much smaller lipophilic molecule diffuses much easily; on the contrary, the bigger molecule becomes difficult to diffuse since diffusion constant become smaller roughly in inverse proportion to the molecular size. Furthermore, because the intercellular lipid molecules have alkyl chains, it can be inferred that the disordered LIQUID is suitable for the permeation of foreign molecules which have alkyl chains. The functional groups of the intercellular lipids may also aggregate around foreign molecules to form locally stable conformations. Therefore, the maximum molecular size that can penetrate the SC is not necessarily 500 Da but will depend on physicochemical properties such as logK
o/w, and on locally constructed structures by interaction between functional groups of the intercellular lipids and a lipophilic molecule.
In addition to the effect of ethanol on the LIQUID, it would be interesting to know the other effect of ethanol in the SC. In particular, the ethanol applied to the SC should affect the water in the SC. To study this phenomenon, it is useful to pay attention to behavior of the (1,1,1) diffraction peak of NaCl crystals at S∼3.1 nm−1 when applying ethanol. As seen in Fig. 14, (1) before exposing the SC to ethanol the (1,1,1) diffraction peak was absent, (2) in the beginning of the exposure, the peak was unobservable, (3) during further exposure to ethanol, the peak becomes clearly detectable, (4) when ethanol in the SC was removed from the SC, the peak of NaCl crystals remained. This phenomenon indicates that ethanol entered the SC and the concentration of ethanol in water in the SC increased, resulting in the crystallization of NaCl. This is because ethanol is highly soluble in water and NaCl is practically insoluble in ethanol. From the above results, when ethanol is applied to the SC, it dissolves the LIQUID and mixes with water. As a result, a complex mixture of intercellular lipid, water and ethanol is formed in the SC.
Finally, we will explain a little about the notable phenomenon that, when treating with ethanol, a mixture of the intercellular lipids, water and ethanol occurs in the LIQUID. When a hydrophilic molecule dissolved in ethanol is applied to the SC, it is inferred that in the SC ethanol collects around the hydrophilic molecule, makes a boundary between the hydrophilic molecule and the hydrophobic LIQUID region, and the outer ethanol shell dissolves the lipids in the LIQUID. This is believed to result in a penetration route of hydrophilic molecules dissolved in ethanol, as opposed to a penetration route of hydrophobic molecules in the disordered LIQUID. Hydrophilic molecules dissolved in a mixture of ethanol and water are often used for penetration. In fact, even when ethanol is applied to the skin, the ethanol concentration was reduced towards the dermis due to the water gradient across the SC. In connection with the penetration mechanism in such a case, a “pore theory” has been proposed, which suggests that in the presence of ethanol, pores carry hydrophilic molecules
82)
,
83)
,
84)
,
85)
. While it has been criticized on the basis that there is no evidence supporting the existence of pores
76)
, it is worth discussion. The pore theory has proposed a parallel permeation pathway model for skin permeation of drugs. In the theory, the SC is assumed to be a bulky sheet having lipid and pore pathways. The lipid pathway is the main permeation route for lipophilic drugs and the drug permeation can be described by the solution-diffusion theory via the LIQUID, whereas the pore pathway might be the main route for hydrophilic drugs via the LIQUID dissolved in ethanol. Additionally, in the absence of such a solvent, it is inferred that water molecules themselves may dissipate through the LIQUID while retaining a thermodynamically favorable local structure in the LIQUID region.
6 Summary and Outlook
To examine the effect of pharmaceuticals and cosmetics on the structures in the SC by X-ray scattering measurements it is beneficial to study in the SC itself instead of the SC lipid model that composed of some components of the intercellular lipids. Because it is difficult to replace the function of the SC, that is biologically originated, by such a model. However, in complex systems such as the SC, the X-ray scattering profiles are generally complex and intertwined. Furthermore, in the SC, individual differences of the X-ray scattering profiles are problematic. In this article, we have shown that the above problems can be overcome by the dynamic XRD experiments on a single SC sample using a solution cell. We could detect minute changes of the structure with high resolution when applying solution with cosmetics and pharmaceuticals to the SC. We showed examples of the results obtained using the solution cell to solve problems that some traditional methods could not achieve. In the future, we will be able to solve various problems in cosmetic science and percutaneous drug delivery in the SC by making the best use of the methods established with the solution cell.
Acknowledgements
We would like to thank Drs Katsuaki Inoue, Naomi Kunizawa, Yasuko Obata, and Naoto Yagi for their cooperation in the early stages of developing the solution cell. The dynamic synchrotron XRD experiments were performed at the BL19B2 and BL40B2 in the SPring-8, Japan. We greatly appreciated for giving us the opportunity to the experiments.
References
- 1)
Masukawa, Y.; Narita, H.; Shimizu, E.; Kondo, N.; Sugai, Y.; Oba, T.; Homma, R.; Ishikawa, J.; Takagi, Y.; Kitahara, T.; Takema, Y.; Kita, K.
Characterization of overall ceramide species in human stratum corneum.
J. Lipid Res.
49, 1466-1476 (2008). https://doi.org/10.1194/jlr.M800014-JLR200
- 2)
Masukawa, Y.; Narita, H.; Sato, H.; Naoe, A.; Kondo, N.; Sugai, Y.; Oba, T.; Homma, R.; Ishikawa, J.; Takagi, Y.; Kitahara, T.
Comprehensive quantification of ceramide species in human stratum corneum.
J. Lipid Res.
50, 1708-1719 (2009). https://doi.org/10.1194/jlr.D800055-JLR200
- 3)
van Smeden, J.; Boiten, W.A.; Hankemeier, T.; Rissmann, R.; Bouwstra, J.A.; Vreeken, R.J.
Combined LC/MS-platform for analysis of all major stratum corneum lipids, and the profiling of skin substitutes. Biochem. Biophys. Acta
1841, 70-79 (2014). https://doi.org/ 10.1016/j.bbalip.2013.10.002
- 4)
Moore, D.J.; Rawlings, A.V.
The chemistry, function and (patho) physiology of stratum corneum barrier ceramides.
Int. J. Cosmet. Sci.
39, 366-372 (2017). https://doi.org/10.1111/ics.12399
- 5)
Laffet, G.P.; Genette, A.; Gamboa, B.; Auroy, V.; Voegel, J.J.
Determination of fatty acid and sphingoid base composition of eleven ceramide subclasses in stratum corneum by UHPLC/scheduled-MRM.
Metabolomics
14, 1-12 (2018). https://doi.org/10.1007/s11306-018-1366-4
- 6)
Wertz, P.W.; Kremer, M.; Squier, C.A.
Comparison of lipids from epidermal and palatal stratum corneum.
J. Invest. Derm.
98, 375-378 (1992).
- 7)
Norlén, L.; Nicander, I.; Lundsjö, A.; Cronholm, T.; Forslind, B.
A new HPLC-based method for the quantitative analysis of inner stratum corneum lipids with special reference to the free fatty acid fraction.
Arch. Dermatol. Res.
290, 508-516 (1998).
- 8)
Ohta, N.; Ban, S.; Tanaka, H.; Nakata, S.; Hatta, I.
Swelling of intercellular lipid lamellar structure with short repeat distance in hairless mouse stratum corneum as studied by X-ray diffraction.
Chem. Phys. Lipids
123, 1-8 (2003).
- 9)
Bouwstra, J.A.; Gooris, G.S.; van der Spek, J.A.; Bras, W.
Structural investigations of human stratum corneum by small angle X-ray scattering.
J. Invest. Dermatol.
97, 1005-1012 (1991).
- 10)
Groen, D.; Gooris, G.S.; Bouwstra, J.A.
New insights into the stratum corneum lipid organization by X-ray diffraction analysis.
Biophys. J.
97, 2242-2249 (2009). https://doi.org/10.1016/j.bpj.2009.07.040
- 11)
Nakazawa, H.; Ohta, N.; Hatta, I.
A possible regulation mechanism of water content in human stratum corneum via intercellular lipid matrix.
Chem. Phys. Lipids
165, 238-243 (2012). https://doi.org/10.1016/j.chemphyslip.2012.01.002
- 12)
Hatta, I.; Ohta, N.; Inoue, K.; Yagi, N.
Coexistence of two domains in intercellular lipid matrix of stratum corneum.
Biochim. Biophys. Acta
1758, 1830-1836 (2006). https://doi.org/10.1016/j.bbamem.2006.08.014
- 13)
Nakazawa, H.; Imai, T.; Hatta, I.; Sakai, S.; Inoue, S.; Kato, S.
Low-flux electron diffraction study for the intercellular lipid organization on a human corneocytes.
Biochim. Biophys. Acta
1828, 1424-1431 (2013). https://doi.org/10.1016/j.bbamem.2013.02.001
- 14)
Swartzendruber, D.C.; Wertz, P.W.; Kitko, D.J.; Madison, K.C.; Downing, D.T.
Molecular models of the intercellular lipid lamellae in mammalian stratum corneum.
J. Invest. Dermatol.
92, 251-258 (1989).
- 15)
Wertz, W.
Current understanding of skin biology pertinent to skin penetration: Skin biochemistry.
Skin Pharmacol. Physiol.
26, 217-226 (2013). https://doi.org/10.1159/000351949
- 16)
Boiten, W.; Helder, R.; van Smeden, J.; Bouwstra, J.
Selectivity in cornified envelop binding of ceramides in human skin and the role of LXR inactivation on ceramide binding.
Biochim. Biophys. Acta
1864, 1206-1213 (2019). https://doi.org/10.1016/j.bbalip. 2019. 05.003
- 17)
Hatta, I.; Nakazawa, H.; Obata, Y.; Ohta, N.; Inoue, K.; Yagi, N.
Novel method to observe subtle structural modulation of stratum corneum on applying chemical agents.
Chem. Phys. Lipids
163, 381-389 (2010). https://doi.org/10.1016/j.chemphyslip.2010.02.005
- 18)
Tagami, H.; Yoshikuni, K.
Interrelationship between water-barrier and reservoir functions of pathologic stratum corneum.
Arch. Dermatol.
121, 642-645 (1985). https://doi.org/10.1001/archderm.1985. 01660050094022
- 19) Lévêque, J.L.; de Rigal, J.; Saint-Léger, D.; Billy, D. How does sodium lauryl sulfate alter the skin barrier function in man? A multiparametric approach. Skin Pharmacol. Physiol. 6, 111-115 (1993). https://doi.org/10.1159/000211095
- 20)
Ribaud, C.; Garson, J.C.; Doucet, J.; Lévêque, J.L.
Organization of stratum corneum lipids in relation to permeability: Influence of sodium lauryl sulfate and preheating.
Pharm. Res.
11, 1414-1418 (1994).
- 21)
Fartasch, M.
Human barrier formation and reaction to irritation.
Curr. Probl. Dermatol.
23, 95-103 (1995).
- 22)
Kawasaki, Y.; Quan, D.; Sakamoto, K.; Cooke, R.; Maibach, H.I.
Influence of surface mixtures on intercellular lipid fluidity and skin barrier function.
Skin. Res. Technol.
5, 96-101 (1999).
- 23)
Gloor, M.; Wasik, B.; Gehring, W.; Grieshaber, R.; Kleesz, P.; Fluhr, J.W.
Cleansing, dehydrating, barrier-damaging and irritating hyperaemising effect of four detergent brands: comparative studies using standardised washing models.
Skin Res. Technol.
10, 1-9 (2004).
- 24)
Waner, R.R.; Boissy, Y.L.; Lilly, N.L.; Spears, M.J.; McKillop, K.; Marshall, J.L.; Stone, K.J.
Water disrupts stratum corneum lipid lamellae: Damage is similar to surfactants.
J. Invest. Dermatol.
113, 960-966 (1999).
- 25)
Froebe, C.L.; Simion, F.A.; Rhein, L.D.; Cagan, R.H.; Kligman, A.
Stratum corneum lipid removal by surfactants: Relation to in vivo irritation.
Dermatologica
181, 277-283 (1990). https://doi.org/10.1159/000247822
- 26)
Okuda, M.; Yoshiike, T.; Ogawa, H.
Detergent-induced epidermal barrier dysfunction and its prevention.
J. Dermatol. Sci.
30, 173-179 (2002).
- 27)
Yanase, K.; Hatta, I.
Disruption of human stratum corneum lipid structure by sodium dodecyl sulphate.
Int. J. Cosmetic Sci.
40, 44-49 (2018). https://doi.org/ 10.1111/ics.12430
- 28)
Itri, R.; Amaral, L.Q.
Distance distribution function of sodium dodecyl sulfate micelles by X-ray scattering.
J. Phys. Chem.
95, 423-427 (1991).
- 29)
Yanase, K.; Hatta, I.
Disruption of human stratum corneum lipid structure by sodium dodecyl sulfate.
SPring-8 Research Frontiers 2017, 90-91 (2018).
- 30)
Bouwstra, J.A.; Gooris, G.S.; van der Spek, J.A.; Bras, W.
Structural investigation of human stratum corneum by small-angle X-ray scattering.
J. Invest. Dermatol.
97, 1005-1012 (1991).
- 31)
Mojumdar, E.H.; Gooris, G.S.; Barlow, D.J.; Lawrence, M.J.; Deme, B.; Bouwstra, J.A.
Skin lipids: Localization of ceramide and fatty acid in the unit cell of the long periodicity phase.
Biophys. J.
108, 2670-2679 (2015). http://dx.doi.org/10.1016/j.bpj.2015.04.030
- 32)
Bouwstra, J.A.; Dubbelaar, F.E.R.; Gooris, G.S.; Ponec, M.
The lipid organisation in the skin barrier. Acta Derm.
Venereol. Suppl.
208, 23-30 (2000).
- 33)
Kuemple, D.; Swartzendruber, D.C.; Squier, C.A.; Wertz, P.W.
In vitro reconstitution of stratum corneum lipid lamellae. Biochem.
Biophys. Acta
1372, 135-140 (1998).
- 34)
Imokawa, G.; Abe, A.; Jin, K.; Higaki, Y.; Kawashima, M.; Hidano, A.
Decreased level of ceramides in stratum corneum of atopic dermatitis: An etiologic factor in atopic dry skin?
J. Invest. Dermatol.
96, 523-526 (1991).
- 35)
Motta, S.; Monti, M.; Sesana, S.; Caputo, R.; Carelli, S.; Ghidoni, R.
Ceramide composition of the psoriatic scale.
Biochim. Biophys. Acta
1182, 147-151 (1993).
- 36)
Paige, D.G.; Morse-Fisher, N.; Harper, J.I.
Quantification of stratum corneum ceramides and lipid envelope ceramides in the hereditary ichthyoses.
Br. J. Dermatol.
131, 23-27 (1994).
- 37)
Conti, A.; Rogers, J.; Verdejo, P.; Harding, C.R.; Rawlings, A.V.
Seasonal influences on stratum corneum ceramide 1 fatty acids and the influence of topical essential fatty acids.
Int. J. Cosmet. Sci.
18, 1-12 (1996).
- 38)
Nakaune-Iijima, A.; Sugishima, A.; Omura, G.; Kitaoka, H.; Tashiro, T.; Kageyama, S.; Hatta, I.
Topical treatments with acylceramide dispersions restored stratum corneum lipid lamellar structures in a reconstructed human epidermis model.
Chem. Phys. Lipids
215, 56-62 (2018). https://doi.org/10.1016/j.chemphyslip. 2018.05.003
- 39)
Caspers, P.J.; Lucassen, G.W.; Carter, E.A.; Bruining, H.A.; Puppels, G.J.
In vitro and in vivo Raman spectroscopy of human skin.
Biospectroscopy
4, S31-S39 (1998).
- 40)
Egawa, M.; Kajikawa, T.
Changes in the depth profile of water in the stratum corneum treated with water.
Skin Res. Tech.
15, 242-249 (2009). https://doi.org/ 10.1111/j.1600-0846.2009.00362.x.
- 41)
Choe, C.-S.; Schleusener, J.; Lademann, J.; Darvin, M.E.
Keratin-water-NMF interaction as a three layer model in the human stratum corneum using in vivo confocal Raman microscopy.
Sci. Rep.
7, 15900 (2017). https://doi.org/10.1038/s41598-017-16202-x
- 42)
Caspers, P.J.; Lucassen, G.W.; Bruining, H.A.; Puppels, G.J.
Automated depth- scanning confocal Raman microspectrometer for rapid in vivo determination of water concentration profiles in human skin.
J. Raman Spectrosc.
31, 813-818 (2000).
- 43)
Walkley, K.
Bound water in stratum corneum measured by differential scanning calorimetry.
J. Invest. Dermatol.
59, 225-227 (1972).
- 44)
Imokawa, G.; Kuno, H.; Kawai, M.
Stratum corneum lipids serve as a bound-water modulator.
J. Invest. Dermatol.
96, 845-851 (1991).
- 45)
Middleton, J.D.
The mechanism of water binding in stratum corneum.
Br. J. Dermatol.
80, 437-450 (1968).
- 46)
Rawlings, A.V.; Harding, C.R.; Watkinson, A.; Chandar, P.; Scott, I.R.
Humectant. in Skin Moisturization (Leyden, J.J.; Rawlings, A.V. eds.). Marcel Dekker Inc., pp. 245-266 (2002).
- 47)
Fowler, J.
Understanding the role of natural moisturizing factor in skin hydration.
Pract. Dermatol. July 36-40 (2012).
- 48)
Jokura, Y.; Ishikawa, S.; Tokuda, H.; Imokawa, G.
Molecular analysis of elastic properties of the stratum corneum by solid-state 13C-Nuclear Magnetic Resonance spectroscopy.
J. Invest. Dermatol.
104, 806-812 (1995).
- 49)
Yamada, T.; Habuka, A.; Hatta, I.
Moisturizing mechanism of glycerol and diglycerol on human stratum corneum studied by synchrotron X-ray diffraction. Int.
J. Cosmet. Sci.
43, 38-47 (2021). https://doi.org/10.1111/ics.12664
- 50)
Fushimi, T.; Uchino, T.; Miyazaki, Y.; Hatta, I.; Asano, M.; Fujino, H.; Suzuki, R.; Fujimori, S.; Kamiya, D.; Kagawa, Y.
Development of phospholipid nanoparticles encapsulating 3-O-cetyl ascorbic and tocopherol acetate (TA-Cassome) for improving their skin accumulation.
Intern. J. Pharm.
548, 192-205 (2018). https://doi.org/10.1016/j.ijpharm.2018.06.030
- 51)
Uchino, T.; Kato, S.; Hatta, I.; Miyazaki, Y.; Suzuki, T.; Sasaki, K.; Kagawa, Y.
Study on the drug permeation mechanism from flurbiprofen-loaded glyceryl monooleyl ether-based lyotropic liquid crystalline nanoparticles across the skin: Synchrotron X-ray diffraction and confocal laser scanning microscopy study.
Int. J. Pharm.
555, 259-269 (2019). https://doi.org/10.1016/j.ijpharm.2018.11.031
- 52)
Williams, A.C.; Barry, B.W.
Penetration enhancers.
Advanced Drug Delivery Reviews
64, 128-137 (2012). https://doi.org/10.1016/j.addr.2012.09.032
- 53)
Uchino, T.; Murata, A.; Miyazaki, Y.; Oka, T.; Kagawa, Y.
Glyceryl monooleyl ether-based liquid crystalline nanoparticles as a transdermal delivery system of flurbiprofen: Characterization and in vitro transport.
Chem. Pharm. Bull.
63, 334-340 (2015).
- 54)
White, S.H.; Mirejovsky, D.; King, G.I.
Structure of lamellar lipid domains and corneocyte envelopes of murine stratum corneum. An X-ray diffraction study.
Biochemistry
27, 3725-3732 (1988). https://doi.org/ 10.1021/bi00410a031
- 55)
Bouwstra, J.A.; Gooris, G.S.; Salomona-de Vries, M.A.; van der Spek, J.A.; Bras, W.
Structure of human stratum corneum as a function of temperature and hydration: A wide-angle X-ray diffraction study.
Int. J. Pharm.
84, 205-216 (1992).
- 56)
Cornwell, P.A.; Barry, B.W.; Stoddart, C.P.; Bouwstra, J.A.
Wide-angle X-ray diffraction of human stratum corneum: Effects of hydration and terpene enhancer treatment.
J. Pharm. Pharmacol.
46, 938-950 (1994).
- 57)
Bouwstra, J.A.; Gooris, G.S.; van der Spek, J.A.; Lavrijsen, S.; Bras, W.
The lipid and protein structure of mouse stratum corneum: A wide and small angle diffraction study.
Biochim. Biphys. Acta
1212, 183-192 (1994).
- 58)
Wilkes, G.L.; Nguyen, A.-L.; Wilnauer, R.
Structure-property relations of human and neonatal rat stratum corneum I. Thermal stability of crystalline lipid structure as studied by X-ray diffraction and differential thermal analysis.
Biochim. Biphys. Acta
304, 267-275 (1973).
- 59)
Doucet, J.; Potter, A.; Baltenneck, C.; Domanov, Y.A.
Micro-scale assessment of molecular lipid organization in human stratum corneum using microprobe X-ray diffraction.
J. Lipid Res.
55, 2380-2388 (2014). https://doi.org/10.1194/jlr.M053389
- 60)
Bligh, E.G.; Dyer, W.J.
A rapid method of total lipid extraction and purification.
Can. J. Biochem. Physiol.
37, 911-917 (1959).
- 61)
Abrams, K.; Harvell, J.D.; Shriner, D.; Wertz, P.; Maibach, H.; Maibach, H.I.; Rehfeld, S.J.
Effect of organic solvents on in vitro human skin water barrier function.
J. Invest. Dermatol.
101, 609-613 (1993).
- 62)
Yamamura, T.; Tezuka, T.
The water-holding capacity of the stratum corneum measured by 1H-NMR.
J. Invest. Dermatol.
93, 160-164 (1989).
- 63)
Imokawa, G.; Kuno, H.; Kawai, M.
Stratum corneum lipids serve as a bound-water modulator.
J. Invest. Dermatol.
96, 845-851 (1991).
- 64)
Grubauer, G.; Feingold, K.R.; Elias, P.M.
Relationship of epidermal lipogenesis to cutaneous barrier function.
J. Lipid Res.
28, 746-752 (1987).
- 65)
Goldsmith, L.B.; Friberg, S.E.; Wahlberg, J.E.
The effect of solvent extraction on lipids of the stratum corneumin relation to observed immediate whitening of the skin.
Contact Derm.
19, 348-350 (1988).
- 66)
Grubauer, G.; Feingold, K.R.; Harris, R.M.; Elias, P.M.
Lipid content and lipid type as determinants of the epidermal permeability barrier.
J. Lipid Res.
30, 89-96 (1989).
- 67)
Menon, G.K.; Feingold, K.R.; Elias, P.M.
Lamellar body secretory response to barrier disruption.
J. Invest. Dermatol.
98, 279-289 (1992).
- 68)
Tsai, J.-C.; Sheu, H.-M.; Hung, P.-L.; Cheng, C.-L.
Effect of barrier disruption by acetone treatment on the permeability of compounds with various lipophilicities: Implications for the permeability of compromised skin.
J. Pharm. Sci.
90, 1242-1254 (2001).
- 69)
Bommannan, D.; Potts, R.O.; Guy, R.H.
Examination of the effects of ethanol on human stratum corneum in vivo using infrared spectroscopy.
J. Control. Rel.
16, 299-304 (1991).
- 70)
Hatta, I.; Ohta, N.; Nakazawa, H.
A possible percutaneous penetration pathway that should be considered.
Pharmaceutics
9, 26 (2017). https://doi.org/10.3390/pharmaceutics9030026
- 71)
Siskind, L.J.; Kolesnick, R.N.; Colombini, M.
Ceramide channels increase the permeability of the mitochondrial outer membrane to small proteins.
J. Biol. Chem.
277, 26796-26803 (2002).
- 72)
Bikman, B.T.; Guan, Y.-G.; Shui, G.-G.; Siddique, M.M.; Holland, W.L.; Kim, J.Y.; Fabriàs, G.; Wenk, M.R.; Summers, S.A.
Fenretinide prevents lipid-induced insulin resistance by blocking ceramide biosynthesis.
J. Biol. Chem.
287, 17426-17437 (2012).
- 73)
Flynn, G.L.; Shah, Y.; Prakongpan, S.; Kwan, K.H.; Higuchi, W.I.; Hofmann, A.F.
Cholesterol solubility in organic solvents.
J. Pharm. Sci.
68, 1090-1097 (1979).
- 74)
Bos, J.D.; Meldardi, M.M.H.M.
The 500 Dalton rule for the skin penetration of chemical compounds and drugs.
Exp. Dermatol.
9, 165-169 (2000).
- 75)
Roberts, D.W.; Mekenyan, O.G.; Dimitrov, S.D.; Dimitrova, G.D.
What determined sensitization potency-myths, maybe and realities. Part 1. The 500 molecular weight cut-off.
Contact Derm.
68, 32-41 (2012). https://doi.org/10.1111/j.1600-0536.2012.02160.x
- 76)
Potts, R.O.; Guy, R.H.
Predicting skin permeability.
Pharm. Res.
9, 663-669 (1992).
- 77)
Mitragotri, S.
A theoretical analysis of permeation of small hydrophobic solutes across the stratum corneum based on scaled particle theory.
J. Pharmaceutical Sci.
91, 744-752 (2002).
- 78)
Wertz, P.W.
The nature of the epidermal barrier: Biochemical aspects.
Adv. Drug Deliv. Rev.
18, 283-294 (1996).
- 79)
De Paepe, K.; Rogiers, V.
Analytical techniques for skin lipids. in Cosmetic Lipids and the Skin Barrier (Förster, T. ed.). Taylor & Francis Group, LLC, pp.149-183 (2002).
- 80)
Wertz, P.W.
Biochemistry of human stratum corneum lipids. in Skin Barrier (Elias, P.; Feingolded, K. eds.). Taylor & Francis Group, LLC, pp.33-42 (2006).
- 81)
Wertz, P.; Norlén, L.
“Confidence intervals” for the “true” lipid composition of the human skin barrier? in Skin, Hair and Nails, Structure and Function (Forslind, B.; Lindberg, M. eds.). Marcel Dekker Inc., pp.85-106 (2003).
- 82)
Ghanem, A.-H.; Mahmoud, H.; Higuchi, W.I.; Rohr, U.D.; Borsadia, S.; Liu, P.; Fox, J.L.; Good, W.R.
The effects of ethanol on the transport of β-estradiol and other permeants in hairless mouse skin. II. A new quantitative approach.
J. Control. Rel.
6, 75-83 (1987).
- 83)
Hatanaka, T.; Shimoyama, M.; Sugibayashi, K.; Morimoto, Y.
Effect of vehicle on the skin permeability of drugs: Polyethylene glycol400-water and ethanol-water binary solvents.
J. Control. Rel.
23, 247-260 (1993).
- 84)
Hatanaka, T.; Manabe, E.; Sugibayashi, K.; Morimoto, Y.
An application of the hydrodynamic pore theory to percutaneous absorption of drugs.
Pharm. Res.
11, 654-658 (1994).
- 85)
Manabe, E.; Sugibayashi, K.; Morimoto, Y.
Analysis of skin penetration enhancing effect of drugs by ethanol-water mixed systems with hydrodynamic pore theory.
Int. J. Pharm.
129, 211-221 (1996).


;%0A%09%09%09newWindow.document.open();%0A%09%09%09newWindow.document.write('<img src=%22./Graphics/70_ess21159_t1.jpg%22>');%0A%09%09%09newWindow.document.close();%0A%09%09)