3. Particle Size and Shape
3.1 Importance of particle size and shape to pharmaceutical manufacture
Particle size affects the behavior of powders in a number of ways. Some of these ways are discussed below.
The mixing of materials is an important operation3). Mixtures containing particles of significantly different sizes segregate by size during transport. The ability to obtain uniform mixtures of materials is thus affected by the relative sizes of the components. Hence, it is generally desirable to have the sizes of the component materials be similar. Particle size and interparticle adhesion affect mixing performance.
The flowability of powders is affected by particle size3–5). In the case of small particle sizes, where the friction and adhesion forces between particles are important, flow decreases with decreasing particle size. The opposite is true when gravitational forces dominate. Jallo and co-workers, in particular, have considered the relation between interparticle adhesion and a measure of flow-ability5).
Low dosage tablets require that drug material be distributed amongst a significant number of particles. If the average number of particles per unit dose is too small then content uniformity problems will result. The normal rules of statistical selection are responsible for the variation in content. The frequent use of volume weighted distributions in the pharmaceutical industry deemphasizes the importance of particle numbers in sampling.
Granulation times and the amount of liquid used for granulation are affected by surface area and hence the particle size6). The packing density of powders is affected by the particle size and particle size distribution7). The tabletting properties of the powder are governed, in part, by the ability of the powder to densify under pressure. Both packing density and particle size thus influence the tabletting process. Granulation may affect the nature of the particle surfaces by promoting contamination of surfaces thus changing the strength of interparticle adhesion.
Products for pulmonary delivery require aerosolized particles in the 2–5μm range. Interparticle adhesion and adhesion to container walls is also influenced, in part, by particle size8). The choice of formulation materials affects the ability to deliver particles of the desired respirable size.
The dissolution rate of materials9) depends on surface area. Powders consisting of small particles have greater specific surface areas. Control of particle size may be of particular importance to those developing formulations from poorly soluble compounds. Processing times for the dissolution of materials incorporated into liquid formulations may also be important.
Particle shape also affects powder behavior in the above listed areas. The effects of particle shape are less well studied are not considered in detail in this paper.
3.2 Particle size analysis
The measurement of particle size and shape is difficult for both technical and philosophical reasons. Allen10) and Etzler11) have previously provided more complete discussions of particle size analysis. Iococca12), Rawle13) and Moschwitzer14) have more recently discussed particle size analysis.
For spherical particles the particle size can be unambiguously be assigned as the particle diameter or radius. It is also possible to assign unambiguous sizes to other regularly shaped particles such as cubes but it is not usual to do so. In the case of cubes, edge length could be used as a measure of size.
For particles of irregular shape it is not possible to assign sizes unambiguously. In this instance, it is typical to express particle size as equivalent spherical diameters. Any measurement of length, area, volume or mass may be used to specify the equivalent diameter. Equivalent spherical diameters for irregularly shaped particles determined in different ways are not numerically equal. For particles that are compact but nonetheless not spherical (e.g. icosahedra) the various measures may give results that do not differ greatly from each other. Needles, disks and flakes are, however, particularly problematic. In this instance, various measurements of size may greatly differ. For this reason it is necessary to be clear with regard to the method used for particle size analysis. It is also necessary to consider the appropriateness of a particular particle size method to the problem at hand.
Particle size data can be presented in a number of ways10). Data can be presented as either a cumulative, differential, or as a histogram distribution. A histogram plot displays the fraction in a given size interval. A cumulative plot shows the fraction of particles having a size less than a certain value. This plot often has a characteristic sigmoid shape. A differential plot is the first derivative of the cumulative plot. The differential and histogram plots may look similar and should be not confused with one another. When data are presented the type of plot used should be made clear.
Particle size distributions may be based on number, volume or surface area. Only the number distribution represents a census of the particles in the system. The volume or mass distribution reflects the fraction of mass which is composed of particles of a specified size. Similarly, the surface area distribution reflects the fraction of surface area composed of particles of a specified size. Each type of plot is useful. For a given population of particles the various plots may look very different from one another. It is, thus, important to make clear which type of distribution is presented. Many publications in the pharmaceutical literature do not make this distinction clear. It is infrequent that investigators make clear the type of distribution being presented as well as the limitations of the method used. It is even more infrequent that the results of several methods are compared to provide a more complete understanding of the material at hand.
Materials composed of particles of different size will segregate by size during transport and handling. Care must be taken to ensure that size segregation does not occur during the process of providing samples to the laboratory. Laboratories receiving improperly sampled materials will report incorrect results10),15–16).
Instruments used to determine particle size distributions usually have quite high precision. If identical samples are presented to the instrument, then nearly identical particle size distributions will result. It is reasonable for the analyst to conclude that sampling errors in the laboratory have occurred if the particle size distributions of replicate samples significantly differ. It is possible to remove quite small and still representative samples from very large containers, if proper procedures are followed. The spinning riffler is considered to be the gold standard for sampling devices17).
The authors have not found that good sampling practices are consistently applied in the pharmaceutical industry. Conclusions based on poor sampling may delay product development or prevent the proper identification of problems that are, in fact, not related to particle size. For instance, two samples apparently exhibiting different particle sizes may do so because poor sampling practices have been employed. Manufacturing problems thus are mistakenly attributed to particle size when another variable is indeed causing the problem. Sampling issues can be particularly problematic when volume distributions are measured for polydisperse powders. The particles representing the greatest mass (or volume) may, indeed, be rather few in number a thus may be quite sensitive to sampling. The variable numbers of large particles may sometimes lead to variations is dissolution rates. It should be recognized that the rigor to which sampling procedures must be held depends on the nature of the powder and its use in the manufacturing process or its effect on product performance. The authors have encountered powders which are nearly impossible properly sample.
A list of the most common instrument types employed in the pharmaceutical industry is given below.
-
• Optical and Scanning Electron Microscopy. (Both manual and automated image analysis)
-
• Laser Diffraction -Mie and Fraunhoffer Diffraction.
-
• (Instruments from various manufacturers are used.)
-
• Sieves (various types).
-
• Light Obscuration (HIAC and PSS Accusizer).
-
• Malvern Zetasizer.
-
• PCS / Dynamic Light Scattering for nanoparticles. New technologies offered by Nanosight18–19) and Izon 20–21) may advance nanoparticle sizing.
-
• Aerosizer -time of flight. The Aerosizer was replaced by the TSI Particle Size Distribution Analyzer. Both instruments are now obsolete despite their rather good performance.
-
• Anderson Cascade Impactor.
Microscopy and Laser Diffraction instruments are the industry workhorses. Sieving is probably the third most used particle sizing method but is not suitable for fine pharmaceutical powders. The above list indicates, however, that a variety of particle sizing instruments are used in the pharmaceutical industry. Because a variety of equipment is used it is important to achieve an understanding of the relative performance of various instruments. More detailed discussions of the various techniques have been published in the literature10,15,22). At the present time, light microscopy is often used in conjunction with image analysis and automatic scanning to allow large numbers of particles to be measured. Several commercial instruments combine image analysis and light microscopy for particle size analysis.
The various particle sizing techniques can be generally divided into two classes - ensemble methods and particle counting methods. Particle counting methods assess the size of individual particles. The size data is then pooled into size classes in order to construct a histogram. Microscopy, Light Obscuration, Aerosizer, Nanosight and Malvern Zetasizer are examples of particle counting instruments. Ensemble methods, in contrast, do not assess the size of individual particles but rather assess the nature of the entire or a large portion of the population. Light scattering, Sieving and the Anderson Cascade Impactor are examples of ensemble methods.
The nearly procrustean use of light scattering methods (PCS and Mie-Fraunhoffer) for particle sizing by the pharmaceutical industry, while understandable in a number of regards, is unfortunate. Particle size distributions calculated from light scattering data are the result of rather complex calculations and numerical approximations. These calculations impose restrictions on the form of the calculated distribution which may not correspond to the form of the real distribution. These restrictions are most severe in the case of PCS. Commercial implementations of Mie-Fraunhoffer assumes that particles are spherical. When particles are spherical, no azimuthal dependence of the scattering pattern is observed. In contrast, if particles are not spherical a marked azimuthal dependence may be observed23–25). Application of a model intended for spherical particles to non-spherical particles may result in the reporting of ghost particles. Ghost particles are not present in the real population and are an artifact of the calculation. Each equipment manufacturer, necessarily, makes numerical assumptions in the calculation of particle size from the scattering intensities. Unfortunately, these assumptions do not appear to be the same between manufacturers. Results from Mie-Fraunhoffer instruments from different manufactures can differ significantly26).(See Fig. 1) Conclusions made using results from such instruments may be in error due to the presence of ghost particle or numerical artifacts. Number counting devices fair much better.

Problems associated with the use of light scattering methods have been discussed by a number of authors4,11,18–21,26–28). The reader is directed to these resources for a more detailed discussion.
3.3 Particle sizing summary
Particle size (and the particle size distribution) is a fundamental characteristic of a powder that influences the behavior of the powder in various applications. The determination of particle size is difficult for both philosophical and technical reasons. The method chosen to assess particle size affects the result as particle size for irregularly shaped particles is represented by the equivalent spherical diameter. As any measure of length, volume (mass) or surface area spherical diameters determined using different measures may differ. Particle size can be represented as a number, volume (mass) or surface area distribution. Not all authors make clear which type of distribution is reported or make clear that the chosen type of distribution is appropriate to the problem at hand. Particle size distributions determined by light scattering methods (PCS and Mie-Fraunhoffer) may at least partially reflect artifacts caused by fitting inappropriate optical models to the scattering data or resulting from numerical artifacts.
In order for QbD to be fully realized it will be necessary to develop and use new particle sizing tools. Limitations of currently available particle sizing equipment and the impact of these limitations on product development must also be recognized. Comparison of particle size distributions obtained using different methods may be the best way, at present, to assess the nature of a powder.
4. Particle Adhesion
The adhesion between particles is also important to the behavior of powders. Zimon29) has published and extensive and important review concerning the physics of the adhesion of particles and particles to surfaces. The principal forces acting on powders are gravity and interparticle adhesion forces. Frictional forces are also important.
4.1 The role of surface free energy – adhesion fundamentals
The adhesion between materials is determined by the area of intimate contact and the strength of the interaction between bodies. Factors such a particle shape and size as well as the degree of compression, in the case of tablets, control the quantity of interaction. Surface chemistry and surface free energy control the quality of this interaction.
The thermodynamics of the surface free energy, γ, of solids has been reviewed by Etzler30). The ideal work of adhesion, WA, between materials A and B is defined by the following relation.
|
W
A
=
γ
A
+
γ
B
−
γ
A
B | (1) |
where the subscripts A and B on the surface free energy terms refer to materials A and B. Similarly, if materials A and B are identical the work of cohesion,
Wc, can be defined as:
Fowkes
31–32) suggested that surface free energy and thus the work of adhesion could be considered as a sum of components resulting from various types of intermolecular interactions. At present, it is conventional to express the work of adhesion as a sum consisting of a term for Lifshitz-van der Waals interactions and second term resulting from Lewis acid-base interactions
30). Frequently, Lifshitz-van der Waals interactions are dominant.
Intermolecular forces between molecules result from interactions between their corresponding electron orbitals. The principal non-bonding interactions result from induced dipole–induced dipole (London), dipole–induced dipole (Debye) and dipole–dipole (Keesom) interactions. The intermolecular potential energy function, U, for each of these three types of interactions is of the same form. Here, r is the separation distance between bodies.
If only London dispersion forces are considered the constant in
Eqn. (3),
β12, can be expressed as follows:
|
β
12
d
=
(
2
I
1
I
2
I
1
+
I
2
)
(
β
11
d
β
12
d
)
1
/
2 | (4) |
Here the subscripts 11, 22 and 12 refer to interactions between like molecules (11, 22) and dissimilar molecules (12).
β,again, is the coefficient in
Eqn. (3). I is the ionization potential. If
I1≈ I2 then
|
β
12
d
=
(
β
11
d
β
22
d
)
1
/
2 | (5) |
forms the basis of the Berthelot principle
33–34) which states that dispersion interactions between dissimilar molecules can be estimated as the geometric mean of the interactions between like molecules.
The interaction potentials between molecules have been used to determine the interactions between macroscopic bodies. In this instance, the Hamaker constants, A, derived from β, also follow the geometric mean rule30,34–35). Thus,
|
A
12
=
(
A
11
A
22
)
1
/
2 | (6) |
and assuming further that intermolecular distances,
d, also follow the geometric mean rule
30). Continuing the argument, the work of adhesion due to London dispersion forces may be expressed as follows.
|
W
12
d
≈
(
A
11
A
22
)
1
/
2
12
π
d
11
d
22
=
(
W
11
d
W
22
d
)
1
/
2
=
2
(
γ
11
d
γ
22
d
)
1
/
2 | (7) |
It has been further generalized that all of the Lifshitz-van der Waals components follow the same rule thus
|
W
A
L
W
=
2
(
γ
1
L
W
γ
2
L
W
)
1
/
2 | (8) |
Berthelot’s rule (
Eqn. (8)) is widely accepted and is part of most models used to explain adhesion and contact angle phenomena.
The Lewis acid-base component of the surface free energy has been modeled in a number of ways. Etzler30) has discussed the various models in detail. Here we highlight the use of two models, one by van Oss, Chaudhury and Good and the other by Fowkes, that are frequently discussed in the literature.
According to the van Oss, Chaudhury and Good model 36–37) the Lewis acid-base component is modeled as follows
|
γ
i
A
B
=
2
(
γ
i
+
γ
i
−
)
1
/
2 | (9) |
where
γ+ is the Lewis acid parameter and
γ− is the Lewis base parameter. van Oss, Chaudhury and Good further choose
for alkanes, methylene iodide and
α-bromonaphthalene which presumably interact only through Lifshitz-van der Waals interactions. For water
|
γ
H
2
O
+
=
γ
H
2
O
−
≡
25.5
mJ
/
m
2 | (11) |
Based on these above numerical choices
γ+ and
γ− have been experimentally determined for a variety of liquids. van Oss
37) has compiled and reviewed the determination of these values (also see Etzler
30)) Della Volpe
38) has suggested that assumption expressed in
Eqn. (11) is not the best choice and has offered another choice for the assignment of
γ+ and
γ−.
Earlier Owens and Wendt39) described surface free energy in terms of two components which were called dispersive γ d and polar γ p. Thus
While it is generally recognized that
γ d ≈
γ LW the meaning of
γ p is perhaps hopelessly confused in the literature. According to Fowkes
31–32),
γ p should refer to dipole-dipole (Debye) interactions. In the van Oss, Chaudhury and Good model such interactions are, however, incorporated into
γ LW. Good
40) no longer recommends the use of
γ p. See Etzler
30) for a more complete discussion.
Recalling Eqns. (1), (8) and (9) together with the relation
it follows that
|
W
a
=
γ
l
[
1
+
cos
(
θ
)
]
=
2
(
γ
l
L
W
γ
s
L
W
)
1
/
2
+
2
(
γ
l
+
γ
s
−
)
1
/
2
+
2
(
γ
l
−
γ
s
+
)
1
/
2 | (14) |
If the van Oss, Chaudhury and Good parameters are known for at least three liquids and the contact angles of these liquids on a solid are measured, then
Eqn. (14) can be used to determine the van Oss, Chaudhury and Good parameters for the surface free energy of the solid. van Oss
37), for instance, has reviewed the numerous publications which have reported the determination of the van Oss, Chaudhury and Good parameters for various liquids.
As discussed above, Fowkes31–32) first suggested that surface free energy could be considered as a sum of components resulting from different classes of intermolecular interactions. The van Oss, Chaudhury and Good model draws upon the idea of Fowkes and as discussed above uses the geometric mean approximation to model Lifshitz-van der Waals interactions. Fowkes 31,41–42) however, has suggested a different approach to evaluating the acid base character of surfaces (also see43)). Fowkes has criticized the use of contact angles for measurement of interfacial properties44). Fowkes’ approach is, for experimental reasons, more applicable to powdered samples. As stated previously,
|
W
a
=
W
a
L
W
+
W
a
A
B | (15) |
W
AB is then, according to Fowkes, expressed by the following relation
|
W
a
A
B
=
−
f
⋅
N
⋅
Δ
H
a
A
B | (16) |
where N is the number of sites per unit area and
|
f
=
[
1
−
∂
ln
W
a
A
B
∂
ln
T
]
−
1 | (17) |
where
When using the Fowkes approach some authors have taken
f as unity although this does not seem to be a good approximation
43). Because
f and N are generally not known, direct calculations of the work of adhesion are often not made. Determination of Δ
HAB for multiple probe liquids on a given solid together with models by Drago
45) or Gutmann
46–47) can be used to assess the acid-base nature of the surface (also see
48)). Here we only elaborate further on Gutmann’s acid-base scale.
Gutmann46–47) introduced the notion of electron donor numbers (DN) and electron acceptor numbers (AN)48). These parameters are similar to the van Oss, Chaudhury and Good surface free energy parameters as they both describe the same molecular parameters but from different points of view. In 1966 Gutmann46) introduced the donor number based on the interaction with SbCl5. DN has units corresponding to enthalpy (e.g. kJ/mole). In 1975, Mayer et al49). introduced the acceptor number based on the relative 31P shift induced by triethylphosphine oxide. AN has arbitrary units. In 1990 Riddle and Fowkes48) removed the dispersive component from AN. The corrected AN* values have the usual units of enthalpy. According to Gutmann’s theory
|
Δ
H
A
B
=
K
a
D
N
+
K
d
A
N
* | (19) |
Where K
a and K
d reflect the acceptor and donor characteristics of a solid. Gutmann’s model works best with hard (low polarizability) atoms. Gutmann’s approach is suitable for use with inverse gas chromatography. It should be noted that Gutmann’s scale is based on enthalpies while the van Oss scale is based on free energies.
Inverse gas chromatography is an excellent method used to determine γLW and ΔHAB. Etzler30) has discussed, in detail, the use of inverse gas chromatography (IGC) for determination of surface free energy components.
4.2 Adhesion and atomic force microscopy
The atomic force microscope has, in recent years, become an important tool to investigate the nature of surfaces. AFM can be used to both acquire fundamental information on particle-particle and particle- surface interactions. It can furthermore be used to investigate surface heterogeneity. Each of these factors can contribute significantly to the understanding of product or process performance. Here, an overview of the AFM and its application to the contamination surfaces and the assessment of particle properties is presented. General reviews of AFM have been published by Leitte and Herrmann50) and by zur Muhlen and Niehus51).
The atomic force microscope52) does not use the transmission of electromagnetic radiation or electron beams to form images. Instead, a probe is scanned over the surface in a raster fashion similar to that employed in television. Typically (but not exclusively) a sharp probe is located at the tip of a diving board shaped or V shaped cantilever composed of silicon. A piezoelectric scanner moves the sample with sub-nanometer displacement with applied voltage. The piezoelectric scanner is capable of three dimensional movements with respect to the probe tip. In order to create an image the probe tip is brought in close proximity to the surface or in contact to the surface. The piezoelectric system is then employed to scan the probe over the sample in raster fashion. Forces between the sample and probe caused either by sample topography or the nature of forces between the sample and probe result in cantilever deflection. An image is thus constructed on a line by line basis from the deflection of the cantilever. A photodiode detector is used to detect the deflection of the cantilever using a laser light reflection of the surface of the cantilever. See Liette and Herrmann for further details regarding the operation of an AFM50). Fig. 2 is a cartoon illustrating the configuration of an AFM.

AFM is a high resolution form of microscopy that can be used to investigate the nature of surfaces. It is able to produce images at much higher resolution than optical microscopy and sometimes can achieve atomic resolution. Gan has recently discussed the resolution of AFM images54). The sample preparation and apparatus is much simpler for AFM than it is for electron microscopy. Samples may be studied in either gaseous or liquid media. The nature interaction of the probe with the surface can, furthermore, be varied; thus several AFM modes are available to the investigator. These different modes allow for the study many aspects of a surface beyond simple topography. In the present context, it will be particularly, important to consider modes that allow measurement of adhesion of particles to other particles and surfaces.
4.3 Measurement of forces using AFM
Commercially available cantilevers can be used to measure forces down to about 10pN55). The AFM is thus particularly suitable for making force measurements. The displacement control of the instrument is on the order of 0.01 nm and the sample tip contact area is typically near 10 nm2. Fig. 3 shows a hypothetical force curve for tip sample interaction. Looking at the advancing curve in Fig. 3 beginning with large distance and moving to shorter distances, it is noted that once the attractive force exceeds the cantilever stiffness the cantilever jumps into contact with the surface (distance C in the figure). Moving the cantilever closer to the surface causes repulsive forces into increase. Again, repulsion is caused by the overlapping of electron orbitals. Upon withdrawal, the tip remains in contact with the surface beyond the initial contact point (distance C in the figure). Eventually the force exceeds the adhesion force or pull off force between the sample and the probe causing the cantilever to snap off the surface (point A in the figure). If the receding and advancing curves are not parallel then plastic deformation of the surface has occurred56–57).

Displacement of the cantilever is translated into force, F, using Hooke’s Law.
Here k is the spring constant and
δc the cantilever displacement. It is usually necessary to determine spring constants experimentally. Calculation of the spring constant involves determining the resonant frequency of the cantilever before and after adding a small mass to the tip
58), determining the resonant frequency knowing the dimensions and density of the cantilever
59) or measuring thermal fluctuation of the cantilever
60–61).
Force-distance curves similar to the example in Fig. 3 can be collected for an array of points on a surface. For each pixel of the surface a force-distance curve has been, thus, collected. Extraction of various quantities from the force-distance curve allows for the construction of various images representing the surface.
The adhesion force may, for example, be extracted from each the force-volume curve to construct an adhesion map that would be capable, for instance, of identifying the presence of surface contamination. Other types of maps constructed from force-distance curves might include measurements of hardness or deformability of surfaces. Any quantity that may be extracted from a force-distance curve may be utilized as basis to form and image62–65).
A particle to be studied can be substituted for the normally sharp tip mounted to the cantilever. (See Fig. 4) The attached particle usually has a diameter between 1–20 μm. In this configuration the AFM may be used to investigate the adhesion of the probe particle with other particles or surfaces. The measured adhesion force depends on the intrinsic adhesion between the materials and the contact topography of the particular site. It is not unusual to average the results of many adhesion measurements to understand the nature of the surface. The colloidal probe method had been used by several authors62,66–71).
4.4 Adhesion forces
The adhesion of particles to surfaces and between particles has been investigated by several authors. A rather comprehensive discussion of particle adhesion has been given by Zimon29). The measured adhesion force between bodies is the summation of forces resulting from different types of interactions. These forces may include van der Waals forces, capillary forces, electrostatic forces and chemically specific forces (acid-base).
The adhesion force between particles and surfaces is usually dominated by London dispersion forces in a dry atmosphere. The adhesion mechanics of spheres to planar surfaces has been described by Johnson, Kendall and Roberts (JKR)72) and by Derjaguin, Muller and Toporov (DMT)73).
According to the DMT theory the adhesion force,
F
a
d
D
M
T is given by the following relation
|
F
a
d
D
M
T
=
2
π
R
w
i
j
k | (21) |
Where R is the particle radius and w
ijk is the work of adhesion between i and j in medium k. According the JKR model the adhesion force is alternately expressed as:
|
F
a
d
J
K
R
=
3
2
π
R
w
i
j
k | (22) |
For smooth surfaces, the DMT prediction and JKR prediction represent the upper and lower bounds of the experimentally observed adhesion force with
3
2
π being the coefficient for soft spheres and 2 π the coefficient for hard spheres. An empirical expression based the DMT and JKR expressions is thus
|
F
a
d
=
α
π
R
w
i
j
k | (23) |
From this expression the reduced load,
F̄, may also be defined
|
F
¯
=
F
a
d
π
R
w
i
j
k | (24) |
In AFM applications
α ≈ 1.6 ⋯ 1.9. A more complete discussion of this material has been given by Leitte and Herrmann
50).
The work of adhesion is determined by the surface chemistry of the materials in contact is given models such as that suggested by van Oss, Chaudhury and Good. (See above discussion concerning measurement of surface free energies.) For real particles with rough surfaces and irregular geometry proper estimation of the correct contact area is difficult or impossible. The correct contact area is necessary for the calculation of the proper adhesion force. The ability of predicting the adhesion force does not, however, preclude the constriction of useful adhesion maps based of observed adhesion forces or cantilever deflections.
4.4.1 Friction force mode
In addition to measuring the normal force exerted on the probe the lateral force may be measured from the torsion of the cantilever. The behavior of the cantilever has been found to be consistent with the classical theories of friction but is additionally influenced by adsorbed layers of water when surfaces are studied in air74–75).
4.4.2 Tapping or intermittent contact mode76–78)
In tapping mode the cantilever is excited into oscillations near the resonance frequency of the cantilever with amplitude of up to 100 nm. These oscillations cause the cantilever to tap along the surface in a manner not to dissimilar to a blind man’s cane. The tapping mode image is constructed from the contacts of the tip with the surface. Tapping mode is more gentle to the surface and is thus more suitable for use on soft materials such as those used in, for instance, the pharmaceutical industry.
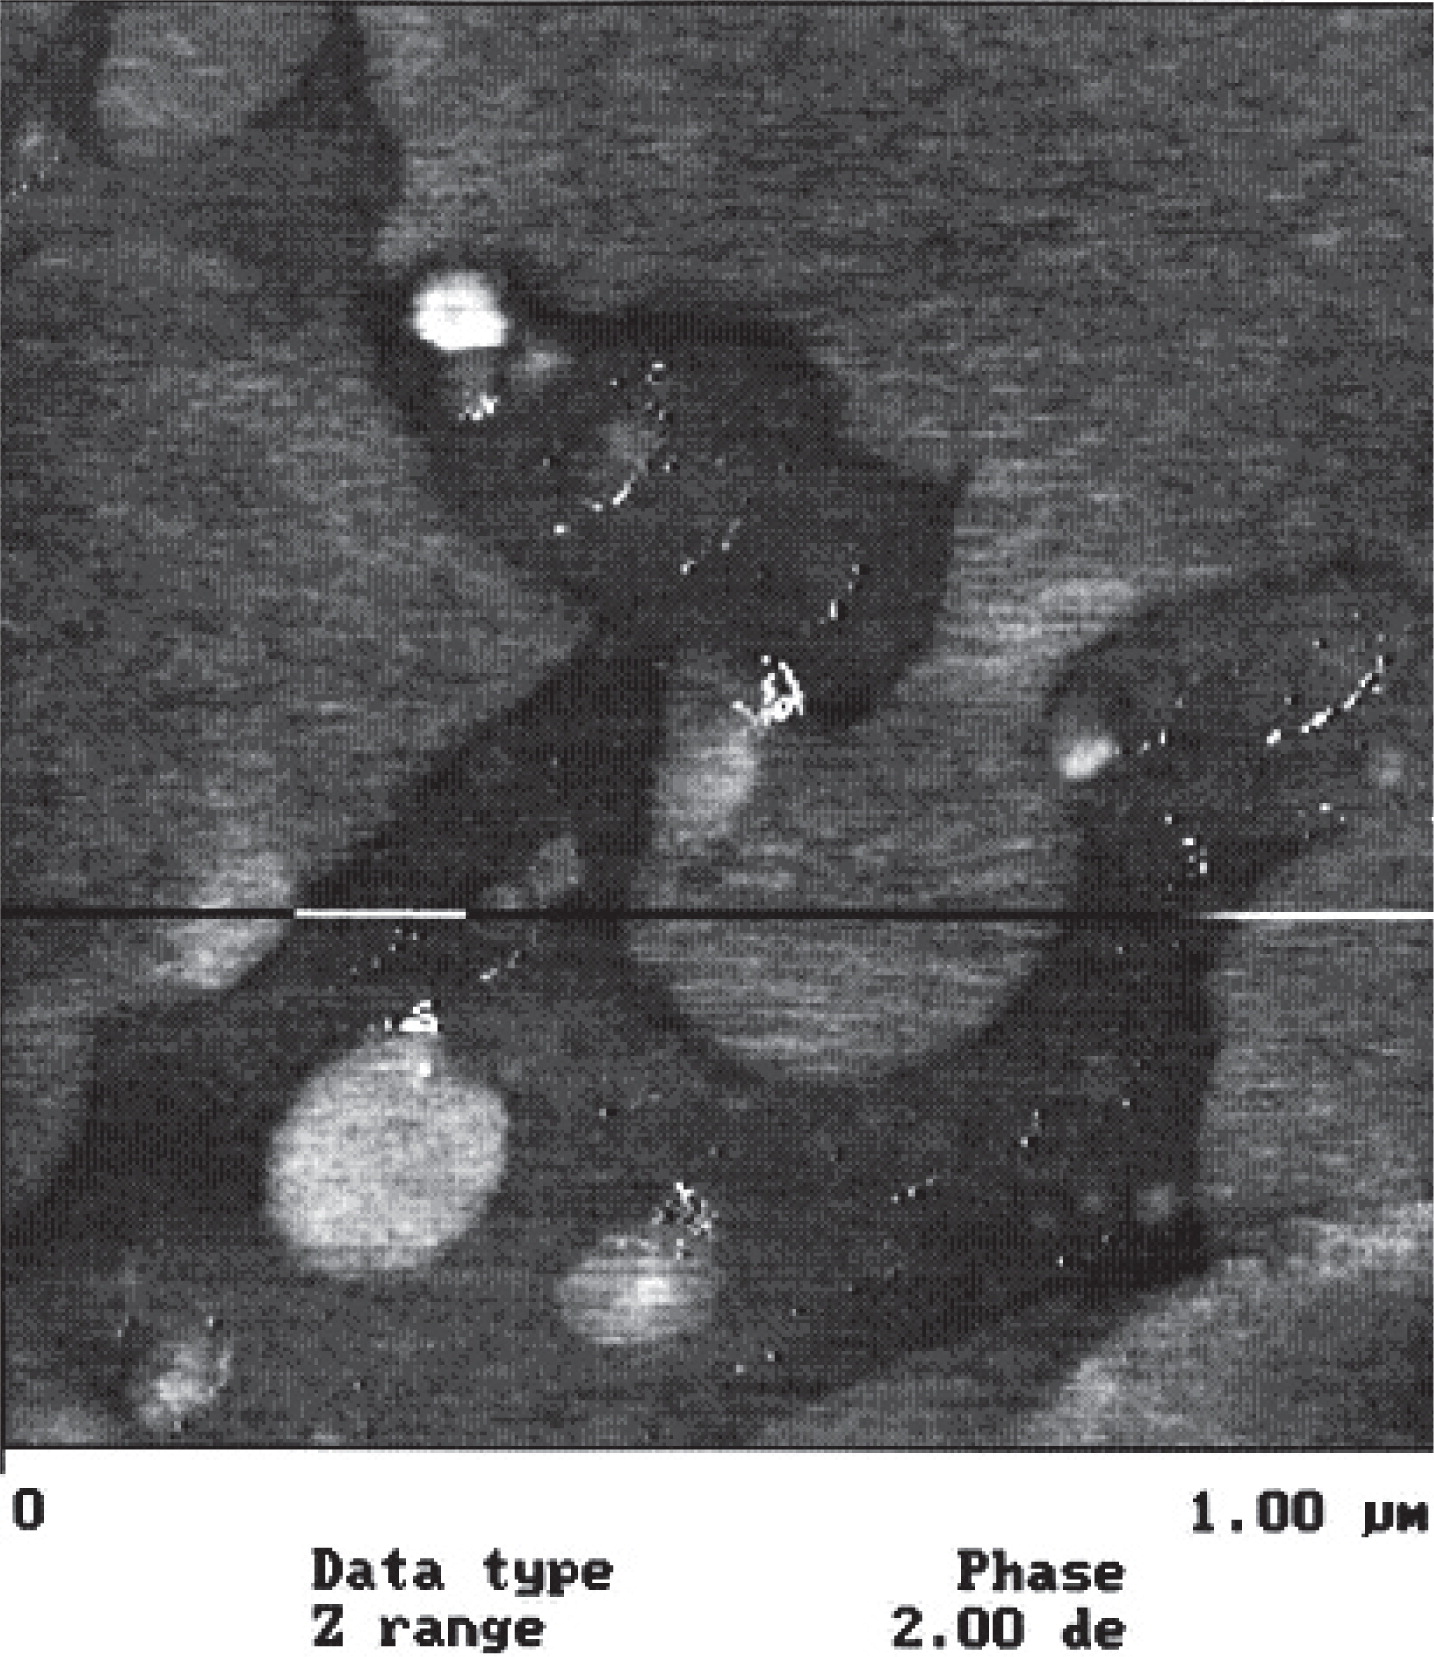
In tapping mode, the phase of the driver oscillation can be compared to that of the cantilever oscillation. Interaction of the probe with the surface will cause a phase difference between the two oscillations. The observed phase shift appears to reflect various properties of the surface including the viscoelastic properties of the surfaces. Tapping mode height images and phase images are collected at the same time. The phase image is particularly useful for identifying the presence of surface contaminants. The phase image is often able to identify surface features that cannot be identified in the height or topographic image.
4.5 Particle adhesion and particle size
The adhesion between particles within powders is a complex topic. Zimon, in particular, has reviewed the subject of adhesion of dusts and powders29). In the absence of triboelectric charging or capillary condensation (which is the usual case at moderate humidity) van der Waals and Lewis acid-base interactions contribute to the adhesion between particles. It would be typical to find that van der Waals interactions dominate.
Both the JKR and DMT models indicate that the force of adhesion, Fad, proportional to the particle radius or diameter. The drag force, Fdr, on the particle resulting from fluid flow would be proportional to the radius squared and the mass of the particle proportional to radius cubed.
For small particle diameters
thus the adhesion force causes small particles to be very difficult to remove. If particles are sufficiently small then it may be impossible to remove particles from a surface by hydrodynamic means. Because small particles are nearly impossible to remove from surfaces some manufacturing processes are performed in clean rooms.
For large particles the gravitational force presents the greatest obstacle for removal of particles. In this instance
Thus particles with the greatest mass are the most difficult to separate from surfaces.
From the above discussion it can be seen that both particle size and particle adhesion are interrelated. The relation between particle size and particle adhesion is not often well considered when thinking about pharmaceutical development problems.
4.6 Particle adhesion and crystalline state
Particle adhesion depends, in part, on the surface free energy of particles. The surface free energy depends on the precise chemical details of the surface. Heng, Williams and co-workers79–81) have investigated the surfaces of crystalline materials used in pharmaceuticals. Table 1 and 2 show advancing contact angles of water on individual crystal faces a few pharmaceutical substances and the surface free energy components (Owens and Wendt model) for Paracetamol polymorphs. These crystals were of macroscopic size. From the tables, it is clear that each crystal face has its own surface chemical characteristics. The area fraction of each crystal face is affected by the composition of the solvent from which the crystals are grown and the subsequent treatment of the crystals. The 010 face of paracetamol form I has the highest water contact angle and lowest acid-base contribution surface free energy. Crystal planes such as this are likely fracture planes and are less water wettable. The wettability and adhesion of materials thus can be affected by milling by altering the area fraction of each crystal plane.
Table 1
Advancing contact angles (Deg.) of water on facets of macroscopic single crystals
81)
| Facet |
Paracetamol Form I |
Paracetamol Form II |
Aspirin |
Racemic Ibuprofen |
S(+)Ibuprofen |
| (201) |
38.1 (4.6) |
|
|
|
|
| (001) |
15.9(3.1) |
64.5(3.5) |
60.7(3.5) |
68.5(4.8) |
64.5(3.9) |
| (011) |
29.8(5.7) |
|
42.9(4.8) |
46.9 (5.5) |
|
| (110) |
50.8(4.9) |
16.6(1.4) |
|
|
48.4(4.0) |
| (010) |
67.7 (2.5) |
17.9 (2.5) |
|
|
|
| (100) |
|
|
52.9(2.5) |
77.2(4.0) |
70.7(3.1) |
Table 2
Surface Free Energy Analysis (Owens and Wendt) of Paracetamol Form I and Form II
81). (mJ/m
2)
|
Form I |
Form II |
| Facet |
γ LW |
γ AB |
γ AB/γ |
γ LW |
γ AB |
γ AB/γ |
| (201) |
34.9 |
27.5 |
0.44 |
|
|
|
| (001) |
34.4 |
38.0 |
0.53 |
42.3 |
9.5 |
0.18 |
| (011) |
33.9 |
32.7 |
0.49 |
33.4 |
38.5 |
0.55 |
| (110) |
34.2 |
20.2 |
0.37 |
|
|
|
| (010) |
45.1 |
7.0 |
0.13 |
32.2 |
38.9 |
0.54 |
As the surface chemistry of particles affects the adhesion between particles, the studies by Heng and co-workers suggest that the choice of crystallization solvent and milling may affect interparticle adhesion by altering the exposed fraction of individual crystal planes. At present, it is not usual to consider surface variability in the formulation of pharmaceuticals despite the fact that surface chemical variations may cause product and process variations.
4.7 Particle adhesion and surface contamination
In most discussions of material characteristics of formulation components it is usual to assume that the surfaces of materials reflect the inherent nature of the studied substance. Above it is has been shown that the surface characteristics of a material can be altered by exposing different crystal planes. Alternatively, contamination of surfaces with foreign materials or intentional surface modification may alter the surface characteristics. One of us (Etzler) has investigated the surface contamination of materials used in the formulation of dry powder inhalers. A general discussion concerning dry powder inhalers has be given by Alagusundaram and co-workers82). Particle size of the component materials as well as interparticle adhesion and adhesion of particles to the delivery device affect the performance of such products.
Water is a surface contaminant the affects adhesion between particles. Beach and Drelich83) have investigated the adhesion of insulin particles to acrylonitrile-butadiene-styrene (ABS) and polypropylene (PP) surfaces as a function of relative humidity. These polymers could be used as a lining for a blister to be used in association with a dry powder inhalation device. The results are summarized in Fig. 5. From this figure it can be seen that the pull off force of insulin particles on PP is greater than that of ABS. Estimation of the pull-off forces using the JKR model (Eqn. (4)) combined with estimates of the works of adhesion are unable account for the magnitude of the observed adhesion forces. The RMS roughness determined from height images for the ABS and PP surface are 57.0 ± 6.3 nm and 386 ± 21.4 nm respectively. Presumably, the surface roughness contributes to the magnitude of the observed adhesion force and accounts at least in part for the greater adhesion to PP. Fig. 5 also shows that adhesion is a dependent on humidity and that this dependence occurs is step like manner so that three distinct adhesion ranges can be observed. It appears that in the 1st region (low humidity) the adhesion force is dominated by van der Waals forces, in the 2nd region the force results from a combination of capillary forces and van der Waals forces and in the 3rd (high humidity) region capillary forces dominate.

Lactose surface chemistry has also been has also been investigated and related to adhesion to gelatin capsule surfaces84). Fig. 6 shows the variation of surface free energy parameters for various lots of lactose. The figure suggests that both the Lifshitz-van der Waals and acid-base components vary between lots. The variation of surface acidity has been correlated with retention in (adhesion to) capsules used for dry powder inhalation (Fig. 7). Furthermore, evidence for the surface contamination, of lactose, can be directly observed using AFM. (Fig. 8). It appears that lactose surfaces are variably contaminated with protein and or lipid materials from milk. Lactose is isolated from milk.
5. Interparticle Adhesion and Pharmaceutical Product Performance
From the above discussion, it can be seen that the properties of a powder can be influenced by particle size and by the nature of the interaction between particles. While many processes and products performance are influenced by power properties, this paper will briefly address two aspects – tableting and the performance of dry powder inhalers.
5.1 Tableting
Tablets are formed by placing a powder under pressure. In order to achieve sufficient tablet tensile strength particles must have sufficient deformability under pressure (quantity of interaction) to increase the area of intimate contact. Fracture of particles may also increase the area of contact. Tablet tensile strength is sometimes referred to as tablet hardness but this type of hardness is not hardness in the traditional sense. (It is not indentation hardness.)
Cao85) and co-workers have measured
the indentation hardness of several pharmaceutical materials including
ibuprofen, phenacetin, sucrose, etc. using AFM nanoindentation86–88) to determine the hardness of single
particles. AFM nanoindentation is similar to more usual indentation hardness
tests except for the fact that an AFM tip is used to make the indentation. The
use of an AFM tip allows for hardness to be determined on single particles
rather than macroscopic surfaces.
The measurements of particle hardness by Cao and co-workers indicates that materials with either high or low hardness show poor tableting characteristics. Recall that adhesion requires both quality of interaction (surface chemistry) and quantity of interaction (surface area of intimate contact). Hard particles may not sufficiently deform under compaction pressure and thus not allow for intimate contact between surfaces. The lack of intimate contact reduces adhesion strength. Soft particles, in contrast, may have low cohesive strength and low surface free energies reducing adhesion strength as a result of poor quality of interaction.
Etzler and co- workers89) have recently investigated tablet tensile strength from an adhesion science perspective. Earlier, Ryshkewitch90) and Duckworth91) proposed an empirical equation to relate tablet tensile strength, τ, to porosity of the tablet, ε. Thus,
Here
τ0 is the tensile strength of the material at zero porosity (
D = 1) and
k a characteristic constant. Over the past several decades the Ryshkewitch-Duckworth equation has been discussed a number of times. Recently, the Ryshkewitch-Duckworth equation has been discussed by Doelker
92), Barraleta
et al.
93), Nyongesa and Aduda
94) as well as by Tye
et al.
95). The literature suggests that the Ryshkewitch-Duckworth equation has been successfully applied to a variety of systems that have applications both to pharmaceutical science and to other disciplines.
The importance of the Ryshkewitch-Duckworth equation is that it suggests that porosity is a measure of the outcome of the tableting process. Tablets of the same porosity have the same mechanical properties even though they might have been made on vastly different tablet presses operating at different speeds.
In an earlier paper, Wu et al.96) proposed a model to calculate the radial tensile strength of tablets from the Ryshkewitch-Duckworth parameters of the individual components of the powder being compressed. Tye et al.95) and Sun97) have also commented further on this approach. In particular, Tye et al.95) have extended the application to quaternary mixtures. These studies establish the importance of the Ryshkewitch-Duckworth equation for understanding tensile strength of tablets composed of multiple components. Furthermore, they reiterate the importance of porosity as a measure of the outcome of the tableting process. Tablets even though produced by vastly different tablet presses operating at different speeds can be expected to have the same mechanical properties if they have the same porosity. The compaction force or compaction pressure may, however, not be the same if different tablet presses are employed.
Etzler and co-workers89) have proposed a model which is similar to that proposed by Wu et al.96) but which differs from that of the earlier authors by drawing more strongly from the principles of adhesion science. The form of the final equation also differs. According to this model the following relation relating tablet sensile strength to the Ryshkewitch-Duckworth parameters of the component materials is proposed.
|
τ
=
∏
i
(
τ
0
i
e
−
k
i
ɛ
)
φ
v
i
→
ln
(
τ
)
=
∑
i
φ
v
i
[
ln
(
τ
0
i
)
−
k
i
ɛ
]
=
ln
(
τ
0
m
)
−
k
m
ɛ | (28) |
indicates that the Ryshkewitch-Duckworth parameters for a powder composed of several components may be calculated from the Ryshkewitch-Duckworth parameters of the individual components using the following relations.
|
ln
(
τ
0
m
)
=
∑
i
φ
v
i
ln
(
τ
0
i
) | (29) |
Here
ϕv is the volume fraction of the ith component. The subscript m refers to the mixture. The following shows an example confirming the above two equations.
Further investigations have shown that wet granulation of individual components has no effect on the observed Ryshkewitch-Duckworth parameters. The wet granulation of mixtures containing sodium dodecyl sulfate, in contrast, are found to have lower than expected tensile strength when wet granulated. This result supports the argument that tablet tensile strength results from the adhesion between particles. Recall, that adhesion depends on the properties of the surfaces. Contamination of these surfaces by, for instance, sodium dodecyl sulfate would have the effect of reducing tensile strength. The role of surface chemistry in determining the values of the Ryshke-witch-Duckworth parameters deserves further consideration.


;%0A%09%09%09newWindow.document.open();%0A%09%09%09newWindow.document.write('<img src=%22./Graphics/30_2013014_10.jpg%22>');%0A%09%09%09newWindow.document.close();%0A%09%09)
;%0A%09%09%09newWindow.document.open();%0A%09%09%09newWindow.document.write('<img src=%22./Graphics/30_2013014_11.jpg%22>');%0A%09%09%09newWindow.document.close();%0A%09%09)