Original Research Papers
Effects of Particle Size and Morphology on Filtration of Airborne Nanoparticles
2013 Volume 30 Pages 256-266
Details
2013 Volume 30 Pages 256-266
The rapid development of nanotechnology brings new challenges to aerosol filtration, which plays a critical role in controlling pollution and protecting the environment and human health. The filtration of airborne nanoparticles is becoming an important issue as they are produced in large quantities from material synthesis and combustion emission. Recent studies indicate that the filtration efficiency increases as the particle size decreases down to 2 – 3 nm. Thus the conventional filters are working well against the nanoparticles. The filtration of non-spherical nanomaterials, such as carbon nanotubes and nanoparticle agglomerates, possesses different filtration characteristics compared to spherical particles. The interception effect for elongated particles is stronger than for spheres with the same mobility, thus higher filtration efficiency is achieved. Modeling results based on the single-fiber theory are compared to experimental data and then used to predict the difference between the filter penetrations for agglomerates and spheres. The effects of the filtration velocity, filter fiber size, solidity and thickness are systematically investigated.
Aerosol filtration is used in diverse applications such as air pollution control, emission reduction, respiratory protection for human, and the processing of hazardous materials. The rising awareness of environmental agencies and the general public for a cleaner environment is forcing many industries to consider a filtration process in their plants. The filtration of airborne nanoparticles is becoming an important issue as they are produced in large quantities from material synthesis and combustion emission. Nanoparticle filtration has received significant attention in the field of occupational health and safety (Wang et al. 2011a). The filter materials and face-piece respirators have been tested using nanoparticles down to single-digit nanometers (Shaffer and Rengasamy 2009). Another important application of nanoparticle filtration is diesel particulate filters. The increasingly stringent regulations regarding engine exhaust emissions are forcing the usage of emission control devices, including the diesel particulate filter (Johnson 2006).
Concerns existed as to whether the conventional filters could be effective against nanoparticles as the thermal rebound of particles may reduce the filtration efficiency. A number of studies of the filtration of nanoparticles down to 2 – 3 nm with spherical or similar shapes have been reported (Ichitsubo et al. 1996, Alonso et al. 1997, Heim et al. 2005). Kim et al. (2007) and Wang et al. (2007) studied the filtration of silver particles in the range of 3 – 20 nm in a variety of filter media including screen filters, standard fiberglass filters and a selection of personal protective equipment filters. The testing results show unambiguously that penetration decreases as the particle size decreases, and no thermal rebound was detected. These results demonstrate that conventional filters can work effectively against nanoparticles as small as 2 – 3 nm, which is very important for nanoparticle manufacturers, filter companies and policy makers.
The filtration of nanoparticles smaller than 100 nm is dominated by the diffusion mechanism (Wang et al. 2007), which was modeled based on the single-fiber theory. Penetration of a filter may be computed if one assumes that the filter is composed of uniformly distributed fibers of the same size. Such a model is proven to be accurate for spherical particles and filters with uniform microstructures (Heim et al. 2005, Shin et al. 2008, Wang et al. 2011b,c, Cena et al. 2012). However, the filters comprise fibers of different sizes in various orientations, as commercial fibrous media commonly do, and may display lower efficiency (higher penetration) compared to the model prediction (Wang et al. 2007, Wang et al. 2008 a,b, Kim et al. 2009a, Liu et al. 2011). Such a discrepancy may be due to the inhomogeneity in the microstructure of fibrous filters. Podgorski et al. (2011) developed a model to account for the fiber size distribution in the filters and used the model to explain the observed discrepancy.
Significant research has been performed on the filtration of asbestos and fibrous aerosols. Feigley (1975) modified the classic filtration theory for spherical particles to develop a model for the deposition of fibrous particles in a fibrous filter. Spurny (1986) performed experiments to measure the collection efficiencies of asbestos fibers in Nuclepore and Millipore filters. Gentry et al. (1989) focused on the collection efficiencies of asbestos fibers in Nuclepore filters and considered the collection of fibers in the straight pore theoretically. Gradon et al. (1988) analyzed the transverse and rotary motions of an ellipsoid in the flow near a cylinder and computed the deposition efficiency for the effect of interception, inertia and sedimentation. Cheng et al. (2006), Webber et al. (2007), and Vallero et al. (2009) focused on the measurement of asbestos collection on different filters and occupational safety aspects.
Carbon nanotubes (CNTs) are finding wider applications in structural composites, conductive plastics, semiconductor devices, etc. At the same time, they are raising concerns for negative environmental and health impacts (Kim et al. 2010, Wang and Pui 2012). The studies on the filtration of CNTs in air are scarce. Seto et al. (2010) investigated the filtration of CNTs by fibrous filters. Wang et al. (2011 b, c) reported experimental results for CNT penetration through a screen filter. Both a three-dimensional numerical simulation (Wang et al. 2011b) and single-fiber analysis (Wang et al. 2011c) were performed and compared to the experimental data.
Fu et al. (1990), Lange et al. (1999), Kim et al. (2009a) and Cena et al. (2012) investigated the filtration of nanoparticle agglomerates which are made up of clusters or chains of nanosize spheres referred to as primary particles. In the size range where interception is important, the agglomerate particles showed lower penetration due to their larger interception length compared to spherical particles with the same mobility diameters.
In the present study, we first present the filtration model based on the single-fiber theory. The model is then applied to spherical particles in the nanometer range, and compared to experimental data using filters with uniform and inhomogeneous microstructures. Elongated nanoparticles are then considered with a focus on the different filtration characteristics compared with spherical particles. The model is compared to experimental results for CNTs and nanoparticle agglomerates. The effects of the filtration velocity, filter fiber size, solidity and thickness are systematically investigated using the model.
Mechanisms for particle capture include diffusion, interception, inertial impaction, gravitational settling and electrostatic attraction. Gravitational settling is usually negligible for nanoparticles and electrostatic attraction is insignificant if the nanoparticles are neutralized. The single-fiber efficiency due to diffusion (ED) may be written as (Kirsch and Stechkina, 1978)
| (1) |
| (2) |
| (3) |
| (4) |
| (5) |
| (6) |
| (7) |
| (8) |
| (9) |
The total single-fiber efficiency is computed as
| (10) |
| (11) |
| (12) |
The filtration efficiency is determined by measuring the particle number concentrations upstream and downstream of the filter. The number concentration is the most sensitive parameter for nanoparticles and is commonly measured by Condensation Particle Counters (CPCs). Aside from the CPC counting technique, in-situ optical methods have also been used to determine filtration efficiencies (Baumgartner et al. 1993, Schweers et al. 1994, Kasper et al. 2009). The test aerosols in the size range from 15 nm to several hundred nanometers may be generated by atomizing a liquid solution of sodium chloride (Japuntich et al. 2007). The particles generated from an atomizer may not provide concentrations high enough for testing particles below 15 nm. A number of researchers used silver particles generated from an electrical tube furnace as the test aerosols in the size range from 3 nm to 20 nm (Kim et al. 2007, Shin et al. 2008, Rengasamy et al. 2008). The overlapping range from 15 nm to 20 nm can be used to check the consistency of the two methods. Since diffusion is the dominant filtration mechanism for particles well below 100 nm, the particle material barely affects the efficiency.
An example of the test set-up using silver nanoparticles is shown in Fig. 1. The silver nanoparticles generated in a furnace first pass through a bipolar neutralizer (Po-210), then through a Nanoparticle Differential Mobility Analyzer (Nano-DMA) to produce monodispersed aerosol particles. The monodispersed particles pass through another Po-210 neutralizer, then enter the filter holder. A pressure gage is used to measure the pressure drop across the filter. A Condensation Particle Counter measures the number concentration of the aerosol particles upstream and downstream of the filter. Then the penetration is calculated.

Set-up for test using silver nanoparticles.
Metal screens with a highly regular and uniform microstructure can serve as good model filters. A stainless steel 304 screen (see Scanning Electron Microscopy SEM image in Fig. 2) manufactured by McMaster was used. The wire diameter was df = 90.31 μm, screen thickness was t = 203.2 μm, and the solidity was α = 0.3105. Fig. 3 shows the measured penetration as a function of the particle size in the range of 2.5 to 20 nm. The model calculation only included the efficiency due to diffusion ED since it was the dominant mechanism. The experimental data are in excellent agreement with the theoretical predictions. Experimental studies using screen filters by Heim et al. (2005), Shin et al. (2008), Wang et al. (2011a, b) covered silver and polystyrene latex (PSL) particles from 2.5 to 400 nm, and showed that the filtration model based on the single-fiber theory agreed well with the experimental data.

An SEM image for the stainless steel 304 screen.

Penetration vs. particle size dp measured using the model screen filter.
Kim et al. (2007) and Wang et al. (2007) investigated filtration using standard fiberglass filters, HE1073, HE1021, HF0031 and HF0012 manufactured by Hollingsworth and Vose. HE-type filter media approach the HEPA regime for small aerosol particles; HF-type filter media are more common to standard HVAC systems. The filtration efficiency of these filter media has been tested using the ASTM test method F1215-89. The results showed low coefficients of variation (COV) and a high degree of reliability. Characteristic parameters for these filter media are given in Table 1. The effective fiber diameter was computed based on the pressure drop. An example of SEM pictures for the standard filter media is shown in Fig. 4. In Fig. 5, the penetration values for the face velocity 10 cm/s from the experiment and model calculation are compared. The penetration computed from the model is in fair agreement with the experimental results when dp = 30 nm or larger, but substantially smaller than the experimental results when dp < 30 nm. This discrepancy is attributed to the inhomogeneity and non-uniformity in the microstructures of the standard filter media. The sizes of pores in the fiber network are not uniform. The larger pores may allow very small particles to leak through, which causes the penetration to be higher than expected. Similar discrepancies between the experimental and modeling results were observed in the filtration of nanoparticles by nanofiber filters (Wang et al. 2008 a, b), by solvent-cast membranes (Liu et al. 2011) and by melt-blown fibrous filters (Podgorski et al. 2011). Podgorski and co-workers (Podgorski 2009, Podgorski et al. 2011) developed a partially segregated flow model that accounted for the non-uniformity of the fiber diameters.
| Parameters | HE1073 | HE1021 | HF0031 | HF0012 | |
| Thickness (cm) | Average | 0.053 | 0.069 | 0.074 | 0.074 |
| % COV | 2.3 | 4.3 | 2.3 | 2.3 | |
| Solidity | – | 0.05 | 0.049 | 0.047 | 0.039 |
| Effective fiber diameter (μm) | – | 1.9 | 2.9 | 3.3 | 4.9 |
| DOP % penetration 0.3 μm at 5.3 cm/s | Average | 12.8 | 39 | 45.8 | 79.9 |
| % COV | 2.2 | 1.7 | 0.92 | 1.24 | |
| Pressure drop at 5.3 cm/s (mmH2O) | Average | 8.4 | 4.7 | 3.5 | 1.3 |
| % COV | 1.48 | 1.35 | 1.94 | 1.47 | |
| Fiber density (g/cm3) | – | 2.4 | 2.4 | 2.4 | 2.4 |

SEM image of HE 1073 filter.

Penetration vs. particle size. The symbols are experimental results and the solid lines are computed from the model.
The data show clearly that the penetration decreases as the particle size decreases down to 2 – 3 nm. It is therefore confirmed that the diffusion effect is stronger for smaller particles which leads to better filtration efficiency. Thus conventional filters are effective for particles down to 2 – 3 nm. When the particles are even smaller, their thermal speed may be high enough to rebound after contact with filter fibers, thus leading to higher penetration. Kim et al. (2006) investigated the filtration of particles down to 1 nm and reported that thermal rebound was detected for particles below 2 nm. Thermal rebound is dependent on the material properties and more studies are needed to better understand it.
The filtration of CNTs and nanoparticle agglomerates possesses different characteristics than that of spheres. The airborne nanoparticles are often measured by electrical mobility analyzers, however, their geometric size is more important for the interception mechanism in the filtration process. For spheres, the mobility size and geometric size are the same; for elongated nanoparticles, the relationship is not apparent and depends on the specific morphology. In general, the geometric size of elongated particles is bigger compared to spheres with the same mobility size, thus leading to lower penetration when the interception mechanism is important.
Wang et al. (2011 b, c) measured the penetration of multi-wall CNTs (MWCNTs) through metal screen filters. The CNTs were dispersed into airborne form using a high throughput electrospray (Kim et al. 2010). A DMA was utilized to select CNTs of a certain mobility diameter and deposited on a grid placed inside a Nanometer Aerosol Sampler (NAS, TSI 3089), then samples were analyzed using SEM. A large number of CNTs were measured from the SEM images and the length distribution was fitted into a log-normal distribution. The mean length of the CNTs was then obtained for the corresponding mobility diameter. The results showed that the mean CNT length was 2300 nm, 4300 nm and 6100 nm when the CNT mobility diameter was 200 nm, 300 nm and 400 nm, respectively. The diameter of the CNTs was dCNT = 85 nm in all cases (Wang et al. 2011b, c). Compared to spherical PSL particles, the penetration of CNTs was lower in the mobility size range of 100 – 400 nm (Fig. 6). A model calculation was performed and compared to experiments in Fig. 6. The agreement for the PSL particles was very good. To obtain good agreement for CNTs, the authors varied the value of dp in Equation (4). When dp was 2.4 times the aerodynamic diameter with an orientation angle θ ≈ 40°, the model fits the experiment well. The orientation angle θ was the angle between the CNT and the screen wire surface. This value for dp in the interception calculation was bigger than the mobility size of the CNTs, but smaller than the geometric size. It was hypothesized that deformation of the long CNTs in the flow led to a reduced interception length, which happened to be proportional to the aerodynamic diameter.

Penetration as a function of the mobility size for PSL particles and multi-wall CNTs (MWCNTs). The symbols are experimental results and the curves are modeling results.
Kim et al. (2009a) used silver nanoparticles for filtration studies. The two-furnace generation system enabled control of the particle morphology. When the sintering furnace was at room temperature, nanoparticle agglomerates with open structures were obtained; when the sintering furnace was at 600°C, sintered spheres were obtained. SEM image analysis was employed to characterize the morphology of the silver agglomerates, including the primary particle size and the maximum geometric length. The average primary sphere size was 16.2 nm with a standard deviation of 3.1 nm. The maximum geometric length L was correlated to the mobility diameter dm in a power law
| (13) |

Silver particle penetration as a function of the mobility size (test filter: HE 1073, face velocity: 5.3 cm/s). The error bars are included but they are smaller than the symbols.
The modeling results for the silver spheres and agglomerates are plotted in Fig. 7. The maximum geometric length L is used as the interception length for the agglomerates in Equation (4). This is plausible since the aspect ratio of the silver agglomerates is about 1.6 – 1.8, and the particle’s rotation time is short and less than the time for the particle to pass by filter fibers. The modeling results agree with the experimental ones qualitatively, showing that the spheres and agglomerates have similar penetration at small sizes, and the agglomerate penetration is lower than spheres at large sizes. The penetration predicted by the model is lower than the experimental value for particles of 50 nm and 20 nm. This is similar to the data shown in Fig. 5. We believe that inhomogeneity and random orientations of fibers in the filters are important reasons for this discrepancy. The penetration for agglomerates predicted by the model is also lower than the experimental value for particles larger than 200 nm. This may be due to preferential alignment of the longer agglomerates in the flow, thus higher penetration. Overall, the model for fibrous filters cannot accurately predict the penetration, however, it provides a useful tool for analyzing the different filtration efficiencies for spheres and agglomerates.
We use the model to investigate the effects of the filtration velocity, filter fiber size, solidity and thickness on the different penetration values for spheres and agglomerates. We select the silver agglomerates with open structures produced in the two-furnace system as a model agglomerate. Their geometric lengths are characterized by Equation (13). Their fractal dimension was determined to be 2.07 based on the particle mass vs. mobility size measurement (Kim et al. 2009a). The silver agglomerates have a similar morphology to a number of commonly found agglomerates. For example, soot particles from flames often possess a fractal dimension around 1.8 – 1.9 (Samson et al. 1987, Sorensen et al. 1992, Kim et al. 2009b); particles from diesel engine exhaust were found to have open structures (Wang and Pui 2012).
The model calculation is performed using the filtration velocities of 2, 5, 10, 20 and 40 cm/s. The filter parameters of HE 1073 are used in the calculation which include the fiber diameter df = 1.9 μm, thickness t = 0.53 mm, and solidity α = 0.05. The calculated penetration values at three filtration velocities are shown in Fig. 8. With increasing filtration velocity, the penetration for particles below 200 – 300 nm increases because of the weaker diffusion effect. For particles larger than 300 nm, the trend is reversed because the inertial effect is more important, which increases with the velocity. The difference between the spheres and agglomerates first increases with the particle size, then decreases. The reason is that for very small particles, the dominant diffusion effect is almost the same for spheres and agglomerates with the same mobility size; for particles larger than 400 – 500 nm, the penetration approaches zero for both spheres and agglomerates; in the intermediate size range, the interception mechanism plays an important role and the difference between spheres and agglomerates is apparent. The penetration difference is calculated at each mobility size dm,
| (14) |
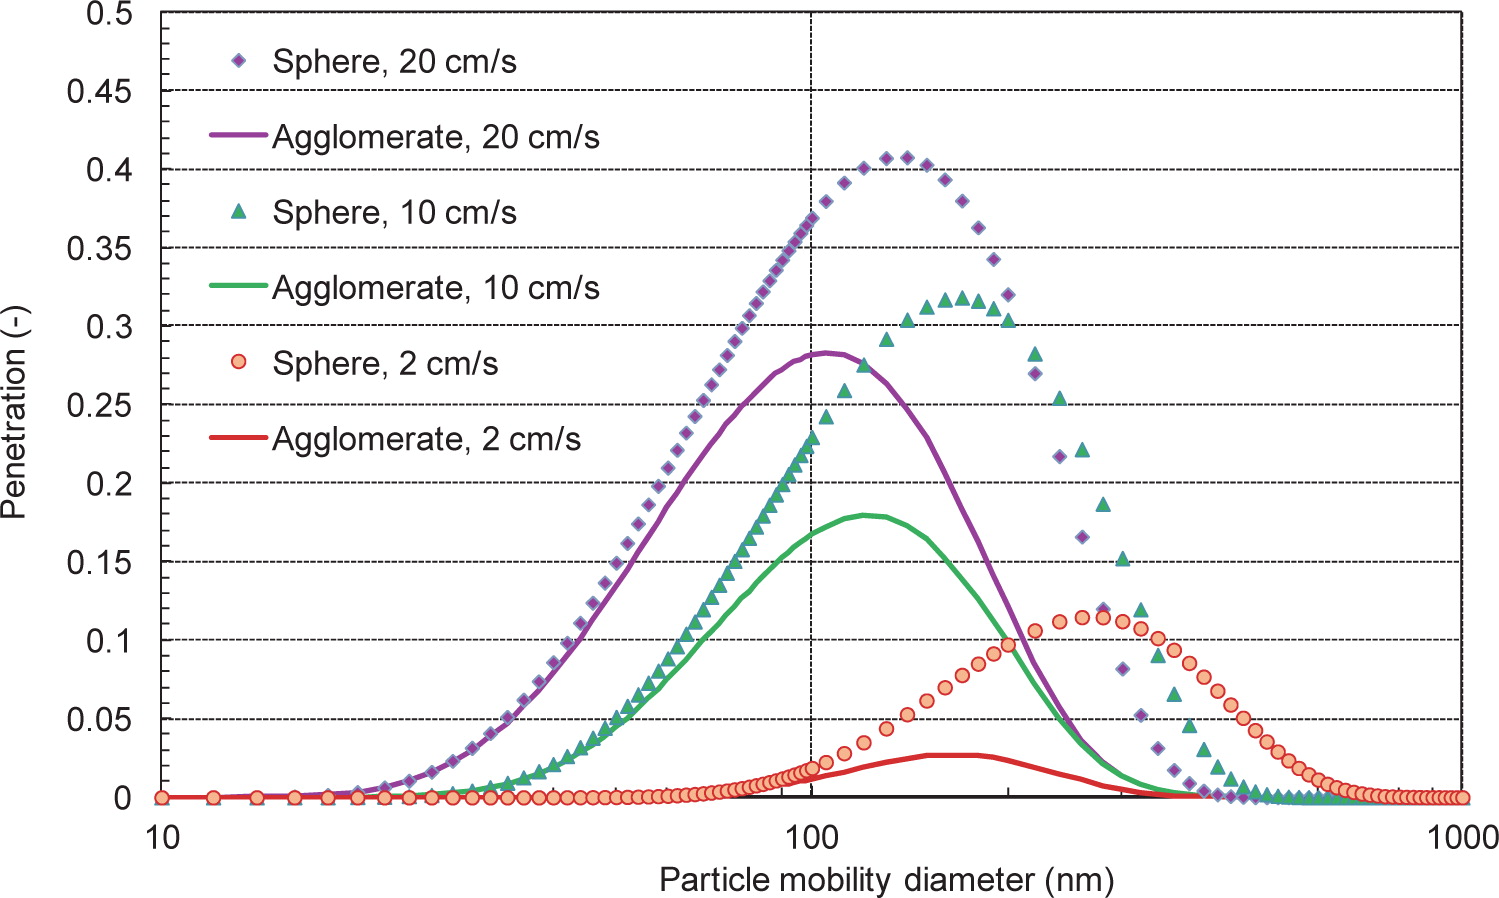
Penetration values for spherical and agglomerated nanoparticles from model calculations at the filtration velocities of 2, 5, 10, 20 and 40 cm/s.
The values of the maximum ΔPenetration and MDPS at different filtration velocities are listed in Table 2. The MDPS is always a bit larger than the most penetrating particle size (MPPS) on the penetration curve for the spheres. At such a particle size, the sphere penetration just starts to decrease from the maximum value and the agglomerate penetration approaches zero because the interception effect is much stronger, thus a large penetration difference is achieved. The value of the maximum ΔPenetration first increases with the filtration velocity, reaching the peak value at 10 cm/s, then decreases as the filtration velocity becomes greater. This is because the diffusion and inertial effects are important at low and high filtration velocities, respectively, and interception plays a smaller role. The MDPS decreases with the filtration velocity, from 290 nm at 2 cm/s to 158 nm at 40 cm/s. This trend is the same as the MPPS, which decreases with increasing filtration velocity (Lee and Liu 1980). The results in Fig. 8 suggest that the lower filtration velocity should be used to differentiate larger spheres and agglomerates, and the higher filtration velocity should be used to differentiate smaller spheres and agglomerates. The optimum filtration velocity depends on the targeted particle size and the filter parameters.
| U0 filtration velocity (cm/s) | 2 | 5 | 10 | 20 | 40 |
| Max ΔPenetration | 0.108 | 0.182 | 0.210 | 0.201 | 0.160 |
| MDPS (nm) | 290 | 247 | 218 | 189 | 158 |
The filtration model here does not consider the possible alignment of elongated particles in the flow field. Preferential orientation and alignment of fibrous particles have been observed in Nuclepore filters (Gallily et al. 1986, Gentry et al. 1989) and in the flow past a circular cylinder (Gradon and Podgorski 1990). The possibility of preferential alignment increases with the velocity and the particle aspect ratio, because the higher shear stress is more likely to overcome the random rotation of the elongated particle. The experimental results shown in Fig. 7 indicate possible alignment of agglomerates larger than 200 nm in the HE 1073 filter at the filtration velocity of 5.3 cm/s. The possible alignment for elongated particles depends on filter parameters, filtration velocity and particle morphology, and requires further studies. The calculations in this study neglect the alignment effect, thus may overestimate the penetration at high velocities for large particles.
The effect of the filter thickness is evaluated by performing the model calculation for t = 0.265, 0.53 and 1.06 mm. The other filter parameters are the same as HE 1073, including the fiber diameter df = 1.9 μm and the solidity α = 0.05. The filtration velocity is set at 10 cm/s, because the largest maximum ΔPenetration was observed at 10 cm/s in Table 2. Such a calculation represents the case of stacking two layers of HE 1073 or reducing the thickness of HE 1073 to half. The calculated penetration curves are shown in Fig. 9. It is clear that the penetration increases as the thickness decreases. The MPPS for the spheres or the agglomerates does not change with the thickness. When t = 1.06 mm, the penetration values for both the spheres and agglomerates are low, thus ΔPenetration is small. As t decreases, the maximum penetration increases and larger values of ΔPenetration can be found on the right side of MPPS. The data in Table 3 show that the maximum ΔPenetration and MDPS both increase as t decreases.

Penetration values for spherical and agglomerated nanoparticles from model calculations for filter thickness values of 0.265, 0.53 and 1.06 mm.
| Thickness t (mm) | 1.06 | 0.53 | 0.265 |
| Max ΔPenetration | 0.085 | 0.210 | 0.288 |
| MDPS (nm) | 187 | 218 | 267 |
The penetration of spheres and agglomerates is calculated for filters with fiber sizes of 0.2, 1, 1.9, 5, and 10 μm. The fiber size significantly affects the pressure drop Δp, as shown in Equation (12). In the calculation, the solidity is kept at α = 0.05 and the filter thickness t is varied to keep the pressure drop Δp constant, which is equal to the pressure drop experienced by HE 1073. The thickness is t = 0.006, 0.15, 0.53, 3.67 and 14.68 mm for α = 0.2, 1, 1.9, 5 and 10 μm, respectively. Such an approach is similar to consideration of using the figure of merit (quality factor) to evaluate the filtration performance of different filters (Wang et al. 2008 a, b). The filtration velocity is set at 10 cm/s. Calculated results are shown in Fig. 10. The values of the maximum ΔPenetration and MDPS for different fiber sizes are listed in Table 4.

Penetration values for spherical and agglomerated nanoparticles from model calculations for fiber sizes of 0.2, 1, and 5 μm.
| Fiber size df (μm) | 0.2 | 1 | 1.9 | 5 | 10 |
| Max ΔPenetration | 0.069 | 0.164 | 0.210 | 0.276 | 0.317 |
| MDPS (nm) | 111 | 162 | 218 | 336 | 457 |
The results in Fig. 10 show that the penetration difference for small particles in the range of 50 – 70 nm is significant when the fiber size is 0.2 μm, and is insignificant when the fiber size is larger than 1 μm. This is because interception is important when the particle size is comparable to the fiber size. If the interception parameter R (Equation 5) is too small, the diffusion effect dominates and the penetration difference is hardly observed. For particles larger than 200 nm, the 0.2 μm fibers have very high filtration efficiencies for both spheres and agglomerates, thus the penetration difference is small. The data in Table 4 demonstrate that both the maximum ΔPenetration and MDPS increase with increasing fiber size. It can be concluded that small fibers need to be used to differentiate small spheres and agglomerates; large fibers can be effective for the differentiation of large spheres and agglomerates.
Next, the effect of the solidity is studied by performing the model calculation for α = 0.02, 0.05 and 0.1. The solidity also affects the pressure drop Δp. In the calculation, the fiber size is kept at df = 1.9 μm and the filter thickness t is varied to keep the pressure drop Δp constant. The thickness is t = 2.1, 0.53, and 0.18 mm for α = 0.02, 0.05 and 0.1, respectively. The filtration velocity is set at 10 cm/s. The results are shown in Fig. 11 and Table 5. The maximum penetration for the spheres and agglomerates increases with increasing solidity and decreasing filter thickness. The result indicates that the decreasing filter thickness has more impact on the penetration values than the increasing solidity. Table 5 shows that the maximum ΔPenetration slightly increases, and the MDPS and MPPS both slightly decrease with the increasing solidity and decreasing filter thickness.

Penetration values for spherical and agglomerated nanoparticles from model calculations for solidity values of 0.02, 0.05 and 0.1.
| Solidity α | 0.02 | 0.05 | 0.1 |
| Thickness t (mm) | 2.1 | 0.53 | 0.18 |
| Max ΔPenetration | 0.174 | 0.210 | 0.211 |
| MDPS (nm) | 235 | 218 | 195 |
There were serious concerns as to whether the conventional filters could be efficient against exceedingly small particles. Diffusion and interception are important filtration mechanisms for nanoparticles. Diffusion loss is stronger for small particles, therefore the filtration efficiency increases with decreasing particle size in the nanometer range. However, thermal rebound of particles may reduce the filtration efficiency. Recent studies indicate that the filtration efficiency increases as the particle size decreases down to 2 – 3 nm. The possibility of thermal rebound for smaller particles or at elevated temperatures needs further studies.
The filtration model based on the single-fiber theory works well for spherical particles in filters with uniform microstructures such as metal screens. However, the model often overestimates the filtration efficiency of the filters composed of fibers of different sizes in various orientations, such as commercial fibrous media. Such a discrepancy may be due to the inhomogeneity in the microstructure of fibrous filters.
Experiments show that filtration efficiency is higher for elongated particles, such as carbon nanotubes and nanoparticle agglomerates, compared to spheres with the same mobility. Analysis using the filtration model demonstrates that the enhanced interception effect is the major reason. Further calculation using the filtration model shows that the penetration difference between spheres and agglomerates is affected by the filtration velocity, filter thickness, fiber size and solidity. The most differentiating particle size (MDPS) decreases as the filtration velocity increases. Thus a lower filtration velocity should be used to differentiate larger spheres and agglomerates, and a higher filtration velocity should be used to differentiate smaller spheres and agglomerates. Small fibers need to be used to differentiate small spheres and agglomerates; large fibers can be effective for the differentiation of large spheres and agglomerates.
There are several limitations for the filtration model used here. The inhomogeneity in the microstructure is not considered, and the preferential alignment of elongated particles is not accounted for. Both could lead to overestimation of the filtration efficiency. Even with these limitations, the model is still a useful tool for qualitative analysis of the filtration process.
The authors thank the members of the Center for Filtration Research for their support: 3M, Boeing Commercial Airplanes, Cummins Filtration, Donaldson Co. Inc., Entegris Inc., Hollingsworth & Vose Co., MANN+HUMMEL GmbH, MSP Corp., Samsung Electronics Co. Ltd., Shigematsu Works Co. Ltd., TSI Inc., and W. L. Gore & Associates Inc. as well as their affiliate member NIOSH.
Jing Wang
;%0A%09%09%09newWindow.document.open();%0A%09%09%09newWindow.document.write('<img src=%22./Graphics/30_2013024_12.jpg%22>');%0A%09%09%09newWindow.document.close();%0A%09%09)
Jing Wang is an assistant professor at the Institute of Environmental Engineering at ETH Zurich (Swiss Federal Institute of Technology Zurich). He also leads the group Air Quality and Particle Research at Empa (Swiss Federal Laboratories for Materials Science and Technology). Jing Wang obtained his PhD degree from the Department of Aerospace Engineering, University of Minnesota in 2005. He received the ‘Best Dissertation’ award in physical sciences and engineering from the University of Minnesota in 2006 and the Smulochowski award conferred by the Association for Aerosol Research (Gesellschaft für Aerosolforschung, GAeF) in 2011. His main research interests are nanoparticle transport and emission control, instrumentation for airborne nanoparticle measurement, air and water filtration, and the mechanics of multiphase flow.