Abstract
Nanopowders or nanoparticles can be used as building blocks for the preparation
of new materials with a prescribed structure. Monte Carlo simulations have shown
that the morphological properties (bulk porosity and surface roughness) of a
granular deposit can be tailored by properly adjusting the velocity of the
particles approaching the deposit. Based on these theoretical predictions,
experiments have been conducted to prepare nanostructured materials from carbon
nanoparticles. By electrohydrodynamic atomization of a liquid suspension (carbon
nanoparticles dispersed in ethanol), an electrospray of small droplets is
generated. The charged droplets are driven by the electric field with the
ethanol evaporating along the droplet path, leaving dry nanoparticles that
deposit on the collecting surface. The surface roughness of the resulting
material has been characterized as a function of the voltage drop. Moreover,
catalytic suspensions of platinum supported on carbon nanoparticles (Pt/C) in
Nafion®-alcohol solutions have been electrosprayed over
carbon paper to prepare electrodes for proton exchange membrane fuel cells
(PEMFC). The fuel cell power density was measured as a function of the platinum
loading and the range of parameters leading to optimal platinum utilization was
obtained.
1. Introduction
Powder technologies have increased their application field ranging from environmental
issues of social concern (i.e. the filtration and elimination of unwanted powders
and the reduction of particulate emissions from industrial activities, car engines
or energy production) to the fabrication of new materials with specific properties.
Thus to comply with the social needs and the environmental regulations, the control
of particle emissions requires the development of clever filtration systems (Konstandopoulos and Papaioannou, 2008).
On the other hand, the fabrication of advanced materials from aerosols promotes the
development of new powder processing techniques (Milosevic et al., 2009; Naito et al., 2009; Yurteri et al., 2010). In all these cases, a proper
knowledge of the dynamics of particle-laden gases is needed to control the particle
motion (Garcia-Ybarra et al.,
2006; Rosner et al., 1992)
and the deposition of particles on the walls confining the gas stream (Castillo and Rosner, 1989; Castillo et al., 1990; Garcia-Ybarra and Castillo, 1997). This
dynamic control allows either the delivery of the powdered material to specific
locations (as it is required in filtration systems or in some pharmaceutical
applications of aerosols) or to avoid the deposition of particles on some valuable
surfaces (in applications ranging from large furnaces to the fabrication of
microelectronic devices, for instance).
The distinctive large surface/volume (surface/mass) ratio of powders make them
especially suitable for applications requiring a large active surface area which is
the case for catalyst applications or pharmaceutical products, as well as for
different solvent-based fabrication techniques. In this way, powders can be used as
building blocks for the preparation of new materials (Luyten et al., 2010) which still retain this large
surface/volume ratio as a distinctive feature. This is the central topic of this
work: the fabrication of granular materials from powders (Section 3) emphasizing
several ways to control the structure of the final product (based on the simulations
described in Section 2) and showing in Section 4 a specific application of these
granular materials (their performance as fuel cell electrodes).
Granular materials formed by the accumulation and adhesion of incoming aerosol
particles acquire a morphological structure controlled by the form of the
constitutive particles and by the way in which these particles arrive and attach to
the forming material (Rodriguez-Perez et
al., 2005, 2007). A proper
control of the aerosol particle dynamics may lead to granular deposits with a
well-prescribed bulk morphology and surface structure.
This paper joins together three complementary studies. First, in Section 2, a Monte
Carlo simulation is used to relate the final structure of a granular material to the
arrival dynamics of the constitutive particles. The knowledge gained with the
simulations guides the preparation of materials with a given morphology and
nanostructure. To achieve this goal, and as the key starting point, a simplified
theoretical model is implemented to simulate the growth of a granular material from
the deposition of aerosol particles. Monte Carlo simulations of particle deposition
provide a correlation of the growing deposit morphology (bulk porosity and surface
roughness) with the aerosol dynamics.
These theoretical predictions are then checked by performing some experiments
conducted under controlled conditions. Thus, in Section 3, a liquid suspension
containing carbon nanoparticles is electrosprayed at a constant flow rate to form a
cloud of small liquid droplets. The electrically charged droplets are driven by an
externally imposed electrical field and evaporate along their flight toward a
collecting plate, leaving dry nanoparticles which deposit on the collector. The
parameters controlling the electrospray dynamics are the physical properties of the
liquid suspension (surface tension, electrical conductivity …), the flow
rate and the voltages applied at the electro-spray needle and at the collector
plate. For a given liquid, there is a range of flow rates where a proper combination
of needle voltage and collector voltage leads to an electric field at the needle
that keeps the electrospray working in a stable cone-jet mode, Martin et al. (2012). These voltages also play a major
role in controlling the electrical field at the collector (which affects the
dynamics of the dry nanoparticles arriving to the forming deposit). The structure of
the final granular deposit is analyzed as a function of some of these controlling
parameters (applied voltages and liquid conductivity) and the results are compared
with the Monte Carlo simulation predictions.
Finally, in Section 4, the use of these highly porous materials as fuel cell
electrodes is analyzed by preparing cathodes made by this electrospraying and
deposition technique starting with a liquid suspension with carbon nanoparticles
doped with platinum. The performance of such a cathode as compared with the
performance of a cathode prepared by a standard (impregnation) technique is studied
in a test fuel cell with controlled gas feeding, cell working temperature and outlet
pressure. The platinum utilization (maximum fuel cell power per gram of platinum in
the cathode) obtained with the electrosprayed cathode is an order of magnitude
larger than the platinum utilization achieved with standard cathodes.
The details of this research carried out at three complementary levels
(i: theoretical simulations, ii: preparation of
granular materials, and iii: demonstration of their performance as
electrodes) are presented in the following Section 2, 3, 4. In
Section 5, the relations between these three research lines are discussed.
2. Monte Carlo simulations of granular deposit formation
2.1 Model description
The growth of a granular material from the deposition of nanopowders (aerosol
particles in the surrounding gas phase) comprises several steps: particle
arrival, particle attachment to the deposit and deposit re-structuring. Each
step is governed by some distinctive mechanisms. Thus the particle arrival is
affected by the particle dynamics above the deposit. Particle attachment depends
on particle arrival velocity and on the intensity of the forces between the
deposit and the impinging particle (see for instance Walton, 2008). Moreover, deposit restructuring
linked to the coagulation, sintering and compaction of the deposit is controlled
by particle coalescence dynamics which is strongly dependent on temperature and
on the presence of vapors that may condense between the particles. One may try
to model the formation of a granular material including all these phenomena, but
it is clear that such a model would require the determination of a large number
of parameters measuring the importance of the different physical mechanisms
controlling these three steps. Instead of trying to model all these details, one
may focus on the mechanisms which play a major role and disregard all the other
effects.
Following this approach, a Monte Carlo (MC) method has been implemented to
simulate the motion of particles above the deposit and the other two effects
have been oversimplified by assuming a complete passive
deposit. Thus in this model (Rodriguez-Perez et al., 2005, 2007; Tassopoulos et al.,
1989) once a new particle reaches the deposit, this particle remains
attached at the touching location and does not move anymore. This assumption
(absence of rebounding and re-entrainment of particles in the gas) is valid when
the kinetic energy of the impacting particle is low with respect to the
potential energy of the interaction between two particles in contact or when a
kind of glue coats the particles enhancing their sticking. Moreover, deposit
restructuring is disregarded and the particles incorporated into the deposit
keep their original shape. This frozen deposit assumption is
valid when the working temperature is not elevated (i.e. is much lower than the
fusion temperature) and the ambient pressure is not too high, in such a way that
particle coalescence within the deposit is precluded.
Under these simplified assumptions, the only remaining factor to control the
deposit formation (i.e. the deposit evolution and the final structure of the
resulting material) is the dynamics of particle arrival to the collecting
surface.
In the MC simulations, time and space are discretized, depicting the particle
motion at intervals of time τ and the particle position
on a cubic lattice of size a (which coincides with the particle
diameter). That is, τ is the characteristic time for a
particle displacement equal to the particle diameter a.
Therefore, time and space are measured in units of τ
and a, respectively. A spatial domain with a square base
L × L (i.e., na
× na) and periodic boundary condition on the lateral
walls is used.
The concentration of particles in the gas phase is assumed to be small and thus
the motion of each particle is not affected by the other aerosol particles. In
this case, the deposit growth is due to the successive arrival of
uncorrelated particles and can be modeled by a sequence of
independent events, each due to a single particle. Thus one can introduce a
particle at a random position over the topmost height of the deposit and follow
its motion until either the particle moves far away from the deposit (escaping
from capture and being carried by the gas) or it touches the deposit and
attaches there. The MC model simulates the motion of one particle after another,
depicting the evolution of the deposit growth evolution.
The motion of an aerosol particle in a gas is split into two distinct
contributions:
-
• A deterministic motion that can be due to gas advection, inertia,
sedimentation or any phoretic motion (thermophoresis, photophoresis
…). This convective motion is characterized by
a mean value of the particle velocity, v. This mean
(ensemble-averaged) velocity would be taken time- and space-independent
and with the same value for all incoming particles.
-
• A random motion superimposed on the mean particle motion and due
to a stochastic transport process (Brownian diffusion, eddy diffusion,
random fields …). Thus in a reference system moving with the
mean velocity v, each particle performs a random motion
with the mean square displacement increasing linearly with time,
Δr2 =
2ndDt, Einstein (1905), where
nd stands for the space dimensions
(nd = 2 in a two-dimensional space,
and, nd = 3 in the three-dimensional
case). The importance of this random motion is measured by the diffusion
coefficient, D.
In this way, the assumption of independent aerosol particles (i.e. that the
motion of each particle is not affected by the other aerosol particles) can be
relaxed considering that the aerosol cloud generates a mean field (as in the
case of electrically charged particles that will be considered in the following
section) plus a random force (due to the incessant temporal and spatial changes
on the distribution of particles inside the cloud). The mean field affects the
deterministic motion of each individual particle (that is, the value of
v), whereas the random contribution adds to the particle
Brownian motion (or even plays the major role in the random particle motion).
These Monte Carlo simulations do not represent the motion of aerosol particles
along the whole particle path but the arrival of the particle to form the
granular deposit, in this sense v stands for the
(ensemble-averaged) arrival velocity which results from the gas-aerosol
interactions and by the presence of other fields acting on the particle
dynamics.
Therefore, the model incorporates three independent variables:
a, v, and D. Once the
direction of the particle velocity is given (perpendicular to the collector in
our simulations), the particle speed, v, together with the
characteristic length (the particle diameter, a) and the
diffusion coefficient (D) can be combined to form the Peclet
dimensionless number
This Peclet number, Pe, measures the relative importance of the
mean particle motion with respect to the random particle motion. The limit
Pe→∞ corresponds to a ballistic behavior of the
aerosol particles moving with constant speed v and vanishing
diffusion whereas the opposite case, Pe = 0, accounts
for the pure diffusive limit (v→0). Indeed, the Peclet
number can be written as the ratio of the characteristic times associated to the
two contributions to the particle motion,
|
Pe
=
t
diffusive
t
convective
| (2) |
With the characteristic convective time given by
tconvective =
a/v, and the characteristic diffusive time by
tdiffusive =
a2/D.
On this discretized space, the two contributions to the particle motion are
simulated by two stages (Fig.
1):
-
• The deterministic (ballistic) stage. Each time step, the particle
moves to the nearest neighboring site in the direction normal to the
collecting surface. Therefore, τ is the
characteristic convective time, τ =
tconvective =
a/v.
-
• The random walk stage. The diffusive time
tdiffusive is of the order of
Pe times the convective time
τ. Each time step, the particle then undergoes
nrw consecutive probabilistic walks, each
with the same probability p of moving to any of the 6
first neighboring sites in the discretized space (and a probability for
remaining at its current site given by q = 1
– 6p), with
|
n
rw
=
int
(
6
Pe
+
1
)
| (3) |
The characteristic diffusion time is of the order of the characteristic time for
each single random motion. As in this two-stage scheme, there are
nrw single random steps for each time step
τ, it results
tdiffusive≈
τ/nrw≈
τPe. Thus the value of the probability
p is chosen to provide the value of Pe; that
is p =
1/(nrwPe).
The MC simulation starts with a flat and clean collecting surface at the lower
boundary of the computation domain. The simulation scheme based on these two
stages is implemented to trace the motion of one aerosol particle until either
it escapes from the computation domain or it touches the deposit (the collecting
surface or another particle that has already being fixed to it). In the first
case, the particle escapes and in the second case the particle becomes part of
the deposit contributing to the deposit growth. After that, a new particle is
introduced at a random location on a plane parallel to the collecting plate and
located one site above the uppermost location of the deposit.
It can be shown (see for instance Tassopoulos et al., 1989 or Rodriguez-Perez et al., 2005) that this computation scheme corresponds
to the discrete description of an ensemble of diluted aerosol particles whose
number density (number concentration per volume),
np, is governed by a convective diffusive equation
(in dimensionless variables, measuring time in
tconvective units and distances in units of the
characteristic length, a, and therefore, velocities in units of
the mean particle velocity)
|
Pe
∂
n
p
∂
t
+
Pev
⋅
∇
n
p
=
∇
2
n
p
| (4) |
with
Pe representing the ratio of
characteristic times given by
Eq.
(2).
2.2 Structure of granular (powdery) deposits formed on attracting
surfaces
For an attracting surface, the mean particle velocity v is
directed towards the collecting surface and the relative intensity of the
surface attraction with respect to particle diffusion is given by the Peclet
number Pe. The sequence of particles driven to the attracting
surface forms a granular deposit on this surface (Fig. 2) whose main structural features were derived by
Rodriguez-Perez et al. (2005,
2007) and Castillo et al. (2010). A computer
drawing of the structure of the granular deposits is given by Fig. 3a showing the lateral view of a
deposit for a low value of the Peclet number (Pe = 0.1)
with the grey intensity decreasing with the depth of the field in the figure
(for illustration purposes, only the upper half of the deposit is shown). On the
other hand, Fig. 3b shows the
upper view of the same deposit characterized by bunches of particles forming a
rough surface on the scale of the particle size. Moreover, Figs. 4a & b depict the lateral and upper view,
respectively, of a deposit formed by particles whose motion is characterized by
Pe = 1. Lastly, Figs. 5a & b correspond to Pe = 100. In all
these figures, the MC domain has a square base of 512 × 512 cells and
the simulation is stopped when the same maximum deposit height
(hmax = 1024 a) is reached.
It becomes clear that ballistic-dominated deposition (large Peclet numbers,
Figs. 5) leads to compact
deposits with a rough patched surface. However, diffusion-controlled deposits
(low Peclet numbers, Figs. 3)
are tree-like and fluffy, with a very porous bulk structure formed by open
structures and a highly branched surface.

The deposit bulk structure can be analyzed by determining the mean
density (the occupation number or relative number of space cells
occupied by particles within the deposit) at different heights,
ρ(h). To achieve representative
values, the density at each height is averaged over 10 deposit simulations
performed with the same Peclet number. It turns out that the bulk of the
granular deposit becomes layered in three different regions (Fig. 6):
-
• A bottom layer (near-wall region) whose structure
is affected by the presence of the flat collecting surface. Here, the
density decreases continuously from a high surface cover at the
collecting plate down to the value at the next layer.
-
• A middle layer (consolidated region)
characterized by a plateau with a constant mean density where new
particles can no longer arrive from the surrounding gas.
-
• A top layer (active region) open to the ambient
air and still active for new particle attachment.
The size of the bottom layer depends on the Peclet number, whereas the thickness
of the active regions increases slightly with time. Some properties of these two
extreme regions were provided by Rodriguez-Perez et al. (2005, 2007). Here we will focus on the features of the consolidated region.
The thickness of this central consolidated region depends on the deposition
time. In Fig. 7, the density
profile (averaged over 10 deposits) for Pe = 0.1 is
represented, depending on the maximum deposit height,
hmax (measured in units of cell size,
a). It becomes clear that the arrival of new particles to the
deposit (increasing hmax) enlarges the thickness of
the consolidated region where the mean density is almost constant and
time-independent, as it was already obtained by Houi and Lenormand (1984).

In Fig. 8 the mean density
profile is depicted for deposits grown at different Peclet numbers up to the
same maximum height, showing that the consolidated region becomes more porous
(and the depth of the active region thickness increases) as Pe
decreases. When the tendency of the particles to move toward the collecting
surface is reduced, a more porous deposit with a larger active surface is
obtained.
A detailed analysis of the granular deposits for different Pe
numbers leads to correlation of the mean density of the consolidated region with
the particle Peclet number, Pe (Fig. 9), resulting in
|
ρ
¯
(
Pe
)
=
ρ
∞
(
1
+
Pe
0
Pe
)
−
B
| (5) |
where
ρ∞
stands for the maximum occupation fraction and
Pe0
is a normalizing Peclet number. In our simulations
|
ρ
∞
=
0.302
;
Pe
0
=
4.8
;
B
=
0.52
| (6) |

The fitting expression Eq. (5) has
a general application whereas the numerical values of the fitting coefficients
given in Eq. (6) indeed depend on
the model features. Thus, for on-lattice models like the one used here, the
limiting occupation fraction for ballistic deposition is
ρ∞ = 0.302. However, for
off-lattice models (when the particle location is not restricted to the lattice
cells but can be any point in the computational space), a packing density
(normalized with respect to the maximum density of fully packed spheres)
ρ∞ = 0.17 is achieved (Jullien and Meakin, 1987). Moreover
here, ρ∞ accounts for the relative
number of occupied cells, but for comparison with the mass density of actual
deposits one has to take into account the fraction of the cell occupied by a
particle, which in the case of a spherical particle in a cubic lattice
corresponds to π/6. Moreover, the value of
Pe0 depends on other model features such as the
space dimension or the angle between the mean velocity and the collecting
surface (taken as perpendicular directions here).
Note that in the case of a material with fractal dimension
DF, when looking at a cubic volume
V of side 2R built on any point inside the
material, the mean occupation fraction would depend on R in the
form
|
ρ
¯
(
Pe
,
R
)
=
N
occupied
(
Pe
,
R
)
N
(
R
)
∝
R
D
F
R
3
| (7) |
where
Noccupied is the
number of occupied cells, and
N is the total number of cells in
the volume
V.
Based on Eq. (7), the fitting
expression (5) defines a characteristic length
such that the granular deposit looks fractal at length
scales smaller than
RPe, (measured in units of the
particle size,
a) with the mean density depending on the volume
as specified by (7). However, for larger volumes, the fractal structure becomes
embedded in
V, with the mean occupation fraction becoming
independent of the size of
V as indicated by
Eq. (5).
RPe is thus a
cut-off distance for
the fractal structure of the consolidated deposit. In the absence of particle
diffusion (ballistic limit), the cut-off distance shrinks to the particle size
whereas in the opposite (pure diffusion) limit, the whole deposit remains
fractal at all the scales. The existence of a cut-off length for the fractal
structure was also proposed by
Nagatani (1989) in the context of particle aggregation.
Thus diffusion dominates on the short distances being responsible for the fractal
structure of the deposit on the small length scales up to
RPe, whereas convection introduces the cut-off
distance RPe (which increases as diffusion becomes
more and more important) beyond which a constant mean density is achieved and
the fractality is swept off.
Therefore, the numerical value of the exponent B in Eq. (5) is related to the fractal
dimension induced by diffusion at the short scales. For diffusion-limited
deposition, a deposit in the pure diffusive limit (Pe =
0) has a fractal dimension DDLD = 2.5 (Tolman and Meakin, 1989), and it
turns out that
|
B
=
3
−
D
F
≈
3
−
D
DLD
| (9) |
Eq. (5) provides the density of a
granular deposit as a function of the particle dynamics in the gas over the
collecting surface, with the dynamics characterized by the Peclet number. On the
base of these simulations, one can prepare materials with a prescribed bulk
density or mean porosity and with a tailored structure by controlling the way
the particles arrive at the attracting surface. Also, layered materials formed
by the superposition of layers with a different mean density can be prepared by
modifying the particle dynamics during different timed intervals.
This result has a broad application. For example, Elmøe et al. (2009) carried out a simulation
of particle capture by filters and found out that the dusty layer growing over
the filter has a mean density which is well fitted by Eq. (5).
Indeed, the MC simulation described here is free from any constraining
hypothesis, and thus Eq. (5) is
expected to be valid in any dusty layer created by accumulation of fine
particles in the absence of erosion or deposit consolidation. The simulation
opens doors for the design of controlled experiments dealing with material
processing from aerosols. One of these doors is explored in the following
section.
3. Granular materials built from the deposition of an electrosprayed liquid
suspension
3.1 Electrosprayed liquid suspensions
The simple model underlying the MC simulations described in the previous section
shows the trends for controlling the deposit structure and indicates several
ways to prepare granular materials from nanopowders with a tailored morphology
depending on their final use. A step forward in nanomaterial research will
consist of the performance of experimental studies that could confirm these
theoretical predictions. To achieve this goal, an experimental set-up (sketched
in Fig. 10) was implemented to
generate nanoparticles in a gas that are later driven towards a collecting
surface. In this study, a standard catalyst ink commonly used for preparing
electrodes that are valuable for proton exchange membrane fuel cells (PEMFC) was
used. The inks are constituted by a catalyst supported on carbon nanoparticles
(Pt/C: 10 wt% Pt on Vulcan XC-72R) dispersed in a liquid solvent
(ethanol 96% v/v, Aldrich) and an ionomer (Nafion® 5
wt% in lower aliphatic alcohols and water). The
Nafion® loading was fixed to 30 wt% in the solid
fraction (fraction of dry mass of Nafion® on the dry mixture
of Nafion® and Pt/C). The electrical conductivity of the
liquid suspension was measured as a function of the concentration of carbon
nanoparticles (Fig. 11),
showing that the electrical conductivity can be well fitted by a linear
dependence on the concentration of carbon nanoparticles.


The electrospray technique (Barrero and
Loscertales, 2007, Jaworeck
and Sobczyk, 2008) is used to generate almost monodispersed sprays of
small electrically charged droplets from this liquid suspension. The liquid
suspension is ultrasonically dispersed for at least 2 hours before the
electrospray deposition is started. Then, a syringe pump (KDS 100) drives the
liquid suspension through a stainless steel needle (inside diameter of 0.75 mm)
at a constant flow rate Q. Moreover, by means of two DC
high-voltage power supplies (Bertan 225-30R and Spellman MM15P2.5W,
respectively), a high voltage difference is applied between the metallic needle
(kept at a constant voltage Vn) and the flat
collecting plate (at a voltage Vp) respectively,
with this plate located some distance away from the needle tip. The electric
charge passing through the needle and the charge collected by the plate are
measured by two ammeters (Isotech IDM67) inserted in the circuit lines of the
needle and the substrate connections to their respective power supplies.
The electrically conducting liquid in the needle is affected by the electric
field there (Fernandez de la Mora,
2007; Higuera, 2010),
which leads to an accumulation of charges at the liquid surface formed at the
needle exit. Under suitable conditions, the electrical stresses elongate this
surface to form a Taylor cone with a very thin jet emerging from the cone tip
(Fig. 12). In this cone-jet
configuration, the jet is steady and adjusts to the fixed flow rate
Q. At some distance away from the cone tip, the jet breaks up
in a spray with droplets much smaller than the needle diameter forming a cloud
of tiny droplets with a narrow distribution of droplet sizes (Fig. 12). The flow rate and liquid
properties (conductivity, surface tension, density) determine the characteristic
droplet size (Chen and Pui,
1997; Fernandez de la Mora and
Loscertales, 1994; Gañan-Calvo et al., 1997; Yurteri et al., 2010). Due to the dependence of the
electrical conductivity on the nanoparticle concentration (Fig. 11), a wide range of droplet
sizes can be analyzed. These charged droplets evaporate along their flight in
the gas leaving dry charged nanoparticles which are driven by the electric field
towards the collecting surface. The arriving nanoparticles accumulate on the
collector plate and form a structured granular deposit. The
Nafion® covering the nanoparticles facilitates their adhesion
to the deposit and reduces particle surface diffusion after adhesion. Fig. 12 is a composed picture
representing the whole electrospraying process. The cone-jet at the needle exit
forms the electrosprayed droplet cloud and the dry nanoparticles form a
nanostructured deposit on the collector plate. For illustration purposes, the
deposit image in Fig. 12 is an
enlarged SEM image superimposed on the needle-electrospray picture with the
scale for the SEM image given by the scale bar at the bottom, whereas the 2-mm
bar is the scale for the rest of the picture.

The cone-jet mode remains stable for a range of parameters (Cloupeau and Prunet-Foch, 1994; Li, 2007; Martin et al., 2012; Noymer
and Garel, 2000; Ragucci et
al., 2000; Tang and Gomez,
1996; Yurteri et al.,
2010). Roughly, when the electrical field at the needle tip is weak, the
surface accumulation of charges is low and the electrical stresses are not able
to comply with the flow rate Q. Then, the cone-jet cannot be
maintained in a steady way and the system works in a dripping mode with a sparse
sequence of large droplets being formed at the needle tip. The droplet grows by
the continuous arrival of liquid pushed by the syringe pump until the meniscus
cannot support the attached droplet (as large as the needle diameter) which
detaches from the needle and a new dripping cycle starts. Moreover, for high
enough voltage differences, the electric field at the Taylor cone is quite
large, the cone-jet becomes unstable and the electrospray evolves to a more
complex configuration (Gu et al.,
2010; Kim et al.,
2011): oscillatory mode, multiple-jet mode or electrical discharges in
the surrounding gas, among others.
The parameter space where the electrospray works in the steady cone-jet mode is
one of the issues that must be investigated in advance for determining the range
of flow rates and the corresponding applied voltages for which the liquid
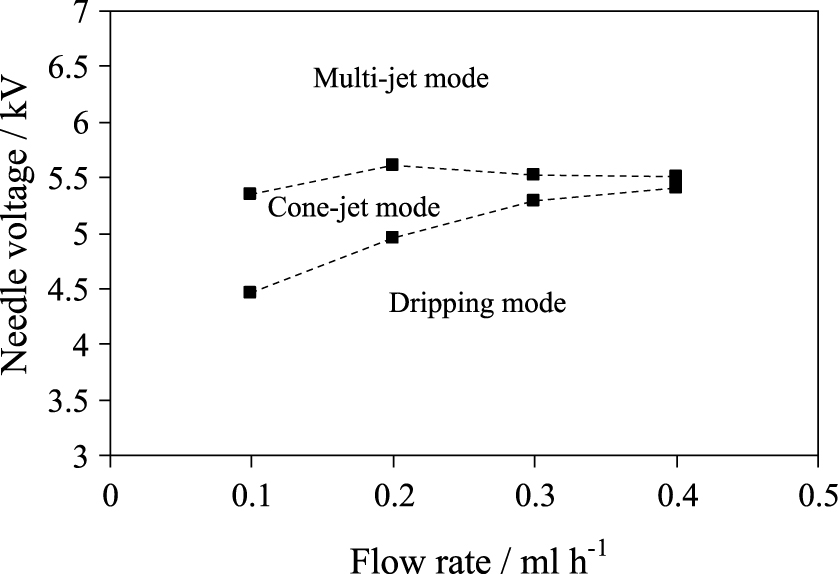
suspension can be electrosprayed in a regular and continuous manner (Martin et al., 2012). Fig. 13 shows the steady cone-jet
domain of a catalyst ink (whose electrical conductivity was 5.77 ×
10−4 S m−1 and for a needle-substrate
distance fixed to 3.5 cm) when a positive voltage is applied to the needle while
the collector plate is connected to ground. In this cone-jet mode the
electrospray induces primary droplets and smaller satellite droplets with most
of the electrosprayed liquid mass contained in the primary droplets. To obtain
the cone-jet mode domain given in Fig.
13, the different electrospraying regimes have been identified by
observing the liquid meniscus at the needle tip. The liquid shape at the needle
exit was visualized using a CCD camera (Panasonic AW-E600E) coupled with an
optical zoom (Optem 70XL). Due to the known hysteresis phenomena linked to the
cone-jet stability, the voltage range leading to a stable cone-jet was
determined, starting always with a formed cone-jet. Therefore, the resulting
range of voltages for a stable cone-jet corresponds to the widest possible
range. Starting with a stable cone-jet within the stability island, the applied
voltages were either decreased or increased until the cone-jet became unstable,
giving rise to the dripping mode or the multijet mode, respectively.
In a recent work (Martin et al.,
2012), the stable cone-jet domain was extended by keeping the collector
under a negative voltage (and the surroundings to ground). Larger flow rates can
be achieved with this double polarization configuration and the electrospray
remaining in a stable cone-jet mode.
Outside of this cone-jet domain, the nanoparticles arriving at the deposit would
have a broader distribution of sizes (due to the uneven atomization process and
the subsequent coagulation of the nanoparticles within the original liquid
droplets when drying), and each nanoparticle will have a different dynamics when
approaching the collector (due to the dependence of the electrical mobility on
size and charge of the particle). Therefore, to compare the morphology of the
nanostructured deposits with the results obtained with the MC simulations
described in Section 2, the electrospray should work in the steady cone-jet
mode.
The main objective of the electrospraying process is to collect all the charged
nanoparticles emitted by the needle on the substrate and to form, after the
solvent evaporation, a porous deposit consisting of the catalyst particles. The
efficiency in the capture of the electrosprayed particles may be substantially
improved if an opposite voltage with respect to the needle voltage is applied to
the collector substrate. In the double polarization scheme depicted in Fig. 10, the charged particles are
forced by the electric field to deposit preferentially over the substrate, thus
reducing the leakage of flying nanoparticles and improving the performance of
the deposition process. Moreover, the electrospray cone-jet domain may be
substantially enlarged by proper selection of the voltage at the collecting
plate, and a noticeable increase in the flow rate range for electrospraying in
the cone-jet mode can be achieved (Martin et al., 2012). Thus, in summary, the double polarization can be
used to control the electric field at the needle tip (which indeed is the key
factor for achieving a stable cone-jet electrospray) as well as the electric
field at the collecting plate (which determines the particle motion over the
deposited material and thus the corresponding particle Peclet number). The
Peclet given by Eq. (1) becomes
|
Pe
=
va
D
=
qE
p
ab
kTb
=
qE
p
a
kT
| (10) |
where
b is the particle mobility,
q the particle charge,
Ep the
electric field at the collecting plate,
k the Boltzmann
constant and
T the gas temperature.
Eq. (10) indicates that
Pe is the ratio of the particle electrical drift to the
intensity of the particle thermal motion, being proportional to the electrical
field over the collecting plate.
3.2 Morphology of the electrosprayed catalytic layers
As expected from Eq. (10) and
from the results of the MC simulations given in Section 2.2, the nanostructure
of the granular deposit depends on the suspension properties, on the mass flow
rate Q, and on the voltages (Vn and
Vp) applied.
In all the cases presented in this section, the electro-sprayed deposits were
carried out at a needle-substrate distance of 3.5 cm and a voltage drop of 7 kV
between the needle and the collector plate (+5.5 kV voltage applied at
the needle with the collector kept at −1.5 kV). This double polarization
configuration has two main advantages:
-
• It reduces the particles losses by setting the collector plate to
a negative voltage with respect to ground, then favoring the deposition
of the catalyst particles on the electrode instead of on the
surroundings which are to ground potential.
-
• Larger flow rates can be achieved (beyond those indicated in Fig. 13) with the
electrospray remaining in a stable cone-jet mode (Martin et al., 2012).
Fig. 14 provides some SEM images
of the deposited catalyst layers with the same deposit accumulative mass (same
final ultra-low Pt loading, 0.01 mgPtcm−2)
obtained for several flow rates and different electrical conductivities of the
catalyst ink (note that the liquid electrical conductivity increases with the
concentration of nanoparticles in the original liquid suspension as shown in
Fig. 11). The micron bar in
Figs. 14a–d and f is 20 μm
in length, whereas in Fig. 14e,
it corresponds to 500 nm. Moreover, Fig. 15 shows a diagram of the flow rates and conductivities of the
catalyst ink that give rise to the different morphologies depicted in Fig. 14.
Each SEM image in Fig. 14 is
representative of a type of deposit. The morphology of the catalyst layer can be
classified as a fractal-like structure (a), accumulation of patched clusters
(b), compact deposits based on a fractal structure (c) and compact deposits
formed from patched clusters (d).
Thus Fig. 14a shows a
fractal-like deposit characteristic of low Peclet numbers which are obtained for
low-conductivity suspensions electrosprayed at moderate flow rates (♦
points in Fig. 15). Moreover,
Fig. 14e shows a closer view of
the same deposit.
The fractality of the granular deposit is better seen in the general views a) to
d) than in the closer views such as e). In Fig. 14a there is no evidence of any dominant macroscopic
length because the corresponding characteristic length
RPe (see Eq.
8) is larger than the picture size (compare with the simulation shown in
Fig. 3b, corresponding to
Pe = 0.1, which leads to
RPe ≅ 50). Figs. 14b to 14d show large and rather homogeneous clusters where fractality is
confined to much smaller sizes (see Figs. 4b and 5b,
corresponding to Pe = 1 and Pe
= 100, respectively, leading to RPe
≅ 5 and RPe ≅ 1, respectively).
These fractal-like structures (Figs. 14a and e) are composed of clusters (of a few catalyst particles each) with a
characteristic size of approximately 100 nm and arranged in a dendritic way.
This is the most appropriate type of catalytic deposit for PEMFC electrode
preparation (due to the large active surface area). The small size of the
catalyst clusters causes most of the catalyst to be exposed to the surface and
available for the reactant gas. Besides this, the dendritic arrangement of the
catalyst clusters results in a highly porous deposit with an enhanced
permeability and increased active surface. One can expect that all these
morphological properties of the granular material lead to high catalyst
utilization when used as a catalyst layer.
On the other hand, Fig. 14b
shows a deposit formed by patched clusters of thousands of single particles
(⋄ points in Fig. 15).
These patched clustered deposits (composed of large aggregates of catalyst
clusters with sizes in the micrometer range) appear for moderate Peclet numbers
(larger flow rates than those for fractals deposits). Here, the granular
material is more compact, leaving void spaces between the substrate fibers which
diminish the effective surface of the catalytic layer. There is a significant
amount of the catalytic material located in the inner regions of these large
clusters that may lead to poorer catalyst utilization. Furthermore, Fig. 14c & d are compact deposits (with the
arriving particles compacting on the initial carbon paper which is shown in
Fig. 14f) representative of
large Peclet numbers (achieved when the flow rate is large enough, see □
and ▵ points in Fig.
15). These compact deposits result from an incomplete evolution of the
droplets during their flight toward the substrate. The droplets do not have
enough time to evaporate and Coulomb fissions (Maxwell explosions due to the
accumulation of electrical charges on the liquid droplet whose repulsion
overcomes the surface tension) are not in effect to reduce the droplet size.
Therefore, the deposit is formed from wet suspensions with the ethanol
evaporating later on. Note that the Monte Carlo simulation described in Section
2 considers that any particle reaching the deposit attaches to the touching
position. This condition is not fulfilled in the case of collected droplets
carrying a dry residue. Therefore, the results derived from these simulations
cannot be directly used when complete drying does not occur during the droplet
flight but the droplet evaporates after arrival.
When the Peclet number associated to the arriving droplets corresponds to a
fractal-like deposit, the resulting dry compact deposit is as the one depicted
in Fig. 14c, with fractal
patches formed on the original fibers. Lastly, when the droplet Peclet number
corresponds to a clustered deposit, the structure of the dry deposit is depicted
by Fig. 14d, with denser
deposits on the fibers leaving larger voids between them.
The diagram depicted in Fig. 15
represents the region of the parameter space (electrical conductivity versus
flow rate, for a constant voltage drop and a fixed needle-plate distance)
leading to fractal-like structures (with the limits of this fractal-like region
depicted by the dashed line). The deposit structure is different on each side of
the dashed line. For a given electrical conductivity of the catalytic suspension
(see Fig. 11), there is a
threshold flow rate below which fractal-like structures are formed. Flow rates
higher than this threshold value give rise to patched cluster structures or
compact structures. The diagram shows that the range of flow rates leading to
fractal-like structures expands as the electrical conductivity of the suspension
decreases until a critical electrical conductivity is reached. For even lower
electrical conductivities, the range of fractal-like deposits is substantially
reduced. Moreover, beyond the fractal thresholds and above the critical
electrical conductivity, the deposit structure is based on patched clusters.
Finally, for electrical conductivities lower that the critical value, the
fractal deposit becomes first compact based on fractals and later on compact
based on patched clusters as the flow rate increases.
When the needle-substrate distance is increased sufficiently, the ethanol has
enough time to evaporate along the droplet flight and only dried base deposits
(type a or b) are achieved. Work to obtain a complete diagram of the deposit
microstructure depending on several controlling parameters is currently
underway.
On the base of the knowledge gained with these experiments, the suspension with
an electrical conductivity of 5.77 × 10⁻⁴ S
m−1 was electrosprayed under the same conditions (3.5 cm
distance between needle and collector, and a voltage drop of 7 kV) for longer
time periods on a carbon paper collector with two different flow rates: a flow
rate Q = 0.2 ml h−1 lying in the
range of fractal deposits, and a larger flow rate Q =
0.5 ml h−1 beyond that domain and leading to patched cluster
deposits (see Fig. 15). A
square carbon paper with a dimension of 5 cm2 was used as a
substrate. The mass of deposited nanoparticles was the same in both cases
(leading to the same Pt loading of 0.1 mgPtcm−2 in
the catalytic layer). Fig. 16
shows SEM lateral views of the respective catalytic layers deposited over the
carbon paper substrate.

The SEM image of the deposit made at a flow rate of 0.2 ml h−1
(Fig. 16a) reveals its fractal
character as it is formed by dendritic trees approximately 300 μm in
height, and resembling very much the MC simulated deposits for low Peclet
numbers (see Fig. 3a). However,
the deposit made at the higher flow rate of 0.5 ml h−1
(beyond the fractal threshold in Fig.
15) exhibits a more compact structure as it is based on the growth of
patched clusters that lead to globular structures after a long deposition time
(Fig. 16b). The same amount of
material was deposited in both cases (Figs. 16a and b).
Therefore, at the higher flow rate (Fig. 16b) and as consequence of the compactness, the thickness of the
deposit was reduced to about one-half with respect to the deposit shown in Fig. 16a.
The porosity for these deposits has been estimated as the proportion of the void
volume to the total volume of the catalytic layer (Baturina and Wnek, 2005; Gasteiger et al., 2003). Despite the difference in
the thickness of the catalyst layer, the porosity is very similar in both cases.
For the fractal deposit made at the lower flow rate (Q
= 0.2 ml h−1, Fig. 16a), a porosity of 98% was measured, whereas
the more compact deposit (Q = 0.5 ml
h−1, Fig.
16b) has a 95% porosity (thus, the occupation fraction or mean
density was doubled in the second deposit as it becomes clear from the reduction
in the deposit height). In any case given their high porosity, both types of
deposits will present similar mass transport resistances in the gas phase
although, as was indicated before, the catalyst utilization will be lower in the
compact deposit because a significant amount of the catalyst is incrusted inside
the patched cluster and is thus unavailable for the reactants in the gas.
It should be mentioned that these values of material porosity are significantly
higher than those reported in the literature for catalyst layers prepared by
other conventional techniques. Thus, for the decal method (Gasteiger et al., 2003) and the air-brush spray
technique (Ihonen et al.,
2002), porosity values in the range of 60% and 30%,
respectively, have been obtained for catalyst layers with loadings close to 0.1
mgPtcm−2. Using the electrospray technique, Baturina and Wnek (2005) reported a
porosity of 84% for a similar catalyst loading (0.09
mgPtcm−2).
To complete the analysis, the surface distribution of the catalyst and the
ionomer was determined by energy-dispersive X-ray spectrometry (EDX) for the
fractal-like catalytic layer presented in Fig. 16a. Fig.
17 shows the EDX spectrum with the elements detected in the sample
surface corresponding to the catalyst (Pt/C) and the Nafion®
ionomer (sulfonated tetrafluoroethylene). Table 1 provides the results from a local quantitative
analysis of the catalytic layer shown in Fig. 16a, measured at different locations on the top
surface of the material. No appreciable composition differences on the surface
of the catalytic layer were observed, indicating that the electrospray process
occurs in a spatially uniform manner (same radial distribution). This means that
in the electrospray phase, the constituents of the catalyst ink are homogenously
distributed and there is no accumulation of a component in any particular region
within the electrospray. Therefore, the atomization-deposition process maintains
the homogeneous distribution of the original liquid suspension. Note that the
double polarization with the collector at an opposite voltage with respect to
the needle is used to focus the charged particles to the collecting area.
Moreover, the main contribution to the deposit comes from the larger primary
droplets as the tiny satellite droplets carry a small fraction of the
nanoparticles in the liquid suspension.

The morphological properties of the deposits discussed in this section confirm
the MC simulations results of Section 2.2. Fractal and open deposits are
obtained when diffusion dominates the deposition process (low Peclet number
corresponding to a weak electrical field at the collecting surface in the case
of electrosprayed suspensions), whereas the deposit porosity decreases as the
relative importance of diffusion decreases (the Peclet number increases). These
results provide a way to prepare materials from powders that have a given
consolidated structure. The main features of this analysis are not restricted to
any deposition mechanism (the electrical drift of charged particles in the
experiments shown here) but have a broader application. Indeed, it applies to
any other particle-dominated transport combined with particle diffusion.
Given the morphology of the materials formed by this technique (high porosity and
large effective surface area), they can be used as catalytic layers with wide
applications. Their use as electrodes for PEM fuel cells is discussed in the
next section.
4. Applications. Electrodes for fuel cells
The morphological properties (structural stability, large porosity, low weight and
high active surface) of granular material growth from nanopowders as those shown in
Fig. 16 make them suitable for use
as catalytic materials. A small amount of catalyst on the nanopowders composing the
material will be enough to achieve a high catalytic performance, as the catalyzers
on the original powders will still remain mostly at the active surface of the
generated material. These days, the proper manufacture of fuel cell electrodes is
one of the areas requiring a high utilization of catalyzers, as Pt requirements
strongly affect the development of these technologies. Indeed, DOE 2007 pointed out
that one of the main challenges that have to be overcome for introducing fuel cells
as competitive power supply devices is to reduce the catalyst loading at the
electrodes without compromising the fuel cell performance by means of increasing the
catalyst utilization (maximum power output per gram of Pt at the electrodes).
In a Proton Exchange Membrane Fuel Cell (PEMFC) working with hydrogen and oxygen as
reactants, both gases (in some cases the oxygen diluted in an inert gas such as
nitrogen) enter through different inlet ports (Fig. 18) and are distributed by the gas diffusion layers
(carbon fiber paper or carbon fiber cloth). These gas currents are kept separate by
a Membrane Electrode Assembly (MEA). The MEA is formed by two porous catalytic
materials (acting as electrodes) with a thin membrane (the polymeric electrolyte)
between them. Hydrogen is dissociated by adsorption on the Pt at the surface of the
anode; the electron in the hydrogen atom generates the fuel cell electrical current,
whereas the proton diffuses through the anode and the electrolyte to reach the
cathode surface. On the cathode side, oxygen molecules are also adsorbed on the
platinum dots and the oxygen atoms react with the incoming protons (receiving an
electron from the electrode) to form water. Water management is quite important in
these fuel cells as a certain degree of humidity in the MEA is required to favor the
proton transport, whereas flooding of the cathode would inhibit the adsorption of
oxygen and stop the reactive process. To achieve an effective process, the
electrodes should be:
-
• Porous materials to facilitate the penetration of the gases.
-
• Good electrical conductors to allow for the electron and proton
transfer.
-
• Catalytically active. Thus, a catalyst must be evenly distributed on
the material surface with a very large effective area available for
catalytic reaction.
The materials described in the previous section which were generated by
electrospraying a liquid suspension containing Pt-doped carbon nanoparticles fulfill
all these requirements. They have over a 90% porosity (see Fig. 16) and are good electrical
conductors due to the combination of the carbon nanoparticles (electron conductors)
with Nafion® (proton conductor). Moreover, the Pt dots on the
carbon nanoparticles form a large catalytically active area not just restricted to
the topmost region of the material but well distributed on the entire surface inside
the material pores. Based on these properties, we used them as the cathode in an MEA
and tested their efficiency in a fuel cell monitored in our laboratory (Martin et al., 2010a, 2010b).
In these MEAs, the electrolyte was a Nafion® 212 membrane
compressed between the two electrodes. The ensemble was bonded by hot pressing at a
pressure of 5 MPa and a constant temperature of 120°C applied for 2 min. The
electrochemical performance of these MEAs was tested in a commercial fuel cell
hardware accommodating a 5-cm2 single cell geometry (FC05-01SP
Electrochem, Inc.) connected to an external electronic load (Hocher & Hackl
ZS-506). The fuel cell hardware employs machined graphite flow field plates with
serpentine flow patterns and copper gold-plated current collectors. The feed gases
were dry oxygen and dry hydrogen supplied by mass flow controllers (Bronkhorst
Hi-Tec). Thus the fuel worked in a self-humidifying regime.
A reference MEA was prepared with the two electrodes made using a standard
impregnation method with a Pt loading of 0.3 mgPtcm−2
at the cathode and 1 mgPtcm−2 at the anode. In a
second MEA with the same electrode at the anode, the cathode was prepared by the
described electro-spray method with an ultra-low Pt loading of only 0.012
mgPtcm−2; that is, a reduction of 1/25 in the amount
of Pt with respect to the reference cathode. The electro-sprayed electrode was
prepared under the conditions to obtain the fractal material corresponding to the
SEM image shown in Fig. 16a (i.e. a
flow rate Q = 0.2 ml h−1, a catalytic
suspension with an electrical conductivity of 5.77 × 10⁻⁴
S m−1, a needle-to-collector-plate distance of 3.5 cm, and a
voltage drop of 7 kV).
The performances of both MEAs are compared in Fig. 19. Fig.
19a shows the fuel cell characteristic polarization curve, voltage provided
by the device (left vertical axis) and the resulting power density (right vertical
axis) versus the current density (Martin
et al., 2010a, 2010b).
Solid triangles correspond to the reference MEA whereas squares are for the MEA with
the electrosprayed cathode. Although the reference MEA seems to offer a higher
performance, it should be emphasized that the Pt content is 25 times larger in the
reference cathode. Therefore, the electrosprayed MEA is able to attain 59%
of the maximum power density supplied by the reference MEA but with only 4%
of the catalyst loading on the cathode.

The potential benefits of the electrosprayed catalytic layer become evident when the
catalyst utilization is evaluated. The specific power (fuel cell power per gram of
Pt in the cathode) is represented in Fig.
19b. The maximum catalyst utilization (referred to the cathode) attained for
the MEA with the electrosprayed cathode was 11.5 kW g−1, whereas
a significantly lower value of 0.78 kW g−1 was obtained by the
MEA with electrodes prepared by a conventional impregnation method. Thus, the MEA
with the electrosprayed cathode achieved a maximum catalyst utilization almost 15
times larger than the utilization reached by the reference MEA under the same
working conditions. This factor of 15 is quite promising for future
applications.
Note that the catalyst utilization of the electrosprayed MEA may even be increased if
more suitable operating conditions of the cell are selected. Thus Fig. 20 shows the increase of the cell
performance when the back-pressure at the cathode and the anode exit lines is
increased from atmospheric pressure up to 1.7 bar overpressure. For the
electrosprayed MEA, a maximum cathode specific power of 19.1 kW
g−1 was attained (although not shown in this figure, the
performance of the reference MEA also increases with the fuel cell working pressure,
but this improvement is rather moderate with respect to the electrosprayed MEA). The
resulting platinum utilization is comparable to that achieved by cathodes prepared
by sputtering, a well-established method for depositing ultra-low Pt loadings. Using
these sputtered electrodes, specific power values between 14 kW
g−1 and 20 kW g−1 have been reported (Caillard et al., 2008; Cavarroc et al., 2009; Gruber et al., 2005). However, the
sputtering technique requires a strict atmospheric control and vacuum conditions
that make it quite expensive and difficult to scale-up. In contrast, the
electrospraying method described in this paper is carried out with a simple and
inexpensive experimental set-up (only a pump-needle system and two high-voltage
power supplies), the technique has no vacuum requirements and can be easily
scaled-up, making it an attractive option for the mass-production of electrodes for
the fuel cell industry.

5. Discussion of results and conclusions
The results presented here open a new line of research for the preparation of
granular materials from nanopowders. Nanopowders or nanoparticles can be used as
building blocks for making new materials with a prescribed structure. For deposits
formed by monodisperse particles, a way of controlling the final deposit morphology
by adjusting the dynamical behavior of the particles when approaching the collecting
surface has been shown.
Thus a simple model of particle motion has been used to simulate the deposit
evolution, considering two contributions to the particle motion: A means
(ensemble-average) determinist arrival velocity v normal to the
collecting surface plus a superimposed random motion characterized by a diffusion
coefficient D. The resulting control parameter is the Peclet
number, Pe = va/D, where
a is the particle diameter. This Peclet number measures the
relative importance of the deterministic motion to the random contribution. Thus,
the limit of infinite Peclet numbers corresponds to ballistic deposition when
particles follow straight trajectories normal to the collector. Whereas the opposite
limit of vanishing Peclet number accounts for a pure Brownian motion. A Monte Carlo
simulation has been performed to track the particle motion and their attachment to
the evolving deposit. These simulations have shown that deposits formed by particles
with a large value of the Peclet number (near the ballistic limit) are more compact
(see Fig. 5a) but have quite a rough
surface (Fig. 5b). However, for low
Peclet numbers, the deposit presents a tree-like structure with large voids (Fig. 3a) and its surface is quite rough
with large pores entering deep into the deposit bulk (Fig. 3b). In any case, an analysis of the deposit mean density
allows definition of three different regions in the deposit (Fig. 6). Thus there is a denser region
close to the initially flat collecting surface where the density changes rapidly
from a maximum value at the deposit bottom until reaching a middle plateau region
where the mean deposit density remains constant and independent of the deposit
height. These two regions form the frozen or consolidated deposit where new
particles can no longer be attached. On top of the plateau regions, there is an
active region where the density decreases from the constant plateau value down to a
vanishing value at the uppermost layer of the deposit. On this active region, new
particles may be incorporated to consolidate the deposit. A detailed analysis of the
plateau region shows that the mean density there depends only on the Peclet number
associated with the motion of the particles which arrive to form the deposit. This
mean bulk density is given by Eq.
(5). This simple relation is one of the main results of the Monte Carlo
simulations because (when the features of the particle motion are given) it allows
the deposit density to be known in advance. In summary, these Monte Carlo
simulations have shown that the morphological properties (bulk porosity and surface
roughness) of a granular deposit can be tuned by properly adjusting the velocity of
the particles approaching the deposit.
On the basis of these theoretical predictions, experiments have been conducted to
prepare nanostructured materials from carbon nanoparticles. These nanoparticles
enter the gas from the atomization of a liquid suspension using the electrospraying
technique (Fig. 10). Thus the
liquid suspension is pumped at a fixed flow rate through a syringe where a high
voltage is applied. The charges accumulate on the liquid surface and a stable
cone-jet can be achieved (Fig. 12)
by proper selection of the applied voltage and liquid flow rate (see Fig. 12). When the electro-spray works in
a steady cone-jet mode, the jet breaks up forming small liquid droplets. These
droplets are charged and become affected by the externally imposed electrical field
that drifts them towards a collector plate located in front of the ejecting needle
and perpendicular to it. The evaporation of the liquid along the droplet path leaves
dry nanoparticles which deposit on the collector. The intensity of the electrical
field over this collector determines the mean particle velocity there, and then the
corresponding Peclet number. Using this technique, nanostructured deposits with a
tree-like structure have been grown. The scanning electron microscope (SEM) images
of the deposits are quite similar to the images of the deposits formed by Monte
Carlo simulations (compare the SEM image of the real deposits shown in Fig. 16 with the simulated deposit
represented in Fig. 3). In general
terms, the experiments confirm the theoretical predictions that denser deposits (or
more porous deposits depending on the requirements) can be made when the control
parameters are properly adjusted.
The accordance of the theoretical predictions with the experimental results
facilitates the preparation of porous granular materials made from powders. These
materials have a rough surface with large pores that penetrate into the bulk
resulting in a bulk structure of highly interconnected pores. This open structure is
especially suitable for applications requiring a large active surface area as in the
case of catalysis or any surface-activated heterogeneous reaction. To check the
validity of these materials for these kinds of applications, a granular deposit
prepared by the indicated electrospraying technique was used as a cathode in a PEM
fuel cell. The resulting material surface can be tailored to render a high-quality
catalytic electrode for use in a proton exchange membrane fuel cell (PEMFC).
Catalytic suspensions of platinum supported on carbon nanoparticles (Pt/C) in
Nafion®-alcohol solutions electro-sprayed over carbon paper were
used in an experimental fuel cell set-up. In previous works, the fuel cell power
density was measured as a function of the platinum loading and the range of
parameters was obtained, leading to optimal platinum utilization for a given fuel
cell efficiency (Martin et al.,
2010a, 2010b). The tests on
a controlled fuel cell have shown that the electrosprayed deposits were able to
reach a fuel cell performance which overcomes the maximum catalyst utilization
achieved with cathodes prepared by state-of-the-art techniques (Martin et al., 2013).
The results for the fuel cell cathode show the validity of the method in a particular
case. But the same methodology can be used for other applications. The structure of
the material can be tailored according to the application needs to have a given
porosity and surface composition. Moreover, layered or composed materials (with a
different porosity or different composition on each layer) can be prepared by
adequate changes in the control parameters (liquid flow rate and applied voltages in
the electro-spraying technique) which determine the dynamics of the particles
approaching the deposit.
Acknowledgements
This work was supported by research funding agencies in Spain: Ministerio de Ciencia
e Innovación (grant ENE2008-06683-C03-01, and program Consolider-Ingenio
2010 grant CSD2010-00011), and also by Comunidad de Madrid (project HYSYCOMB,
S2009ENE-1597). A collaborative agreement with YFLOW Company (Malaga, Spain) is also
acknowledged. The advice from YFLOW team, Prof. Ignacio G. Loscertales (University
of Malaga) and Prof. Antonio Barrero† (University of Seville) was
essential for the electrospray set-up and operation. Moreover, Jose L. Castillo and
Pedro L. Garcia-Ybarra thanks Prof. Daniel E. Rosner (Yale University, New Haven,
CT, USA) and Dr. Athanasios G. Konstandopoulos (CERTH/CPERI, Thessaloniki, Greece)
for many years of fruitful discussions on these topics and Prof. Sotiris E.
Pratsinis (ETH Zurich) for encouraging us to write this paper.
Author’s short biography
Jose L. Castillo

Jose L. Castillo received an M.Sc. in Physics from Universidad Autonoma de Madrid and
a Ph.D. in Physics from UNED. He has been an associate research scientist at Yale
University (Chemical Engineering Department), collaborator at Los Alamos National
Laboratory (Center for Nonlinear Studies, Los Alamos, NM) and sabbatical visitor at
University of Miami (Department of Physics). He is a professor at UNED, member of
the editorial board of the Journal of Aerosol Science, and representative of the
Spanish Aerosol Society at the European Aerosol Assembly. He was president of the
Experimental Science Committee for the assessment of non-tenure university positions
at ANECA (National Agency for Quality Evaluation and Accreditation, Spain), and is
now an ANECA deputy director for academic staff evaluation.
Santiago Martin

Santiago Martin received a B.Sc. in physics and an M.Sc. in applied physics (fuel
cell research) from UNED. He received his Ph.D. thesis at UNED in the applications
of electrohydrodynamic spraying for the generation of nanostructured catalyst layers
for PEM fuel cell use.
Daniel Rodríguez-Perez

Daniel Rodríguez-Perez received an M.Sc. and a Ph.D. in physics from UNED. He
is a senior lecturer at UNED working, among other areas, in discrete Monte Carlo
computer simulation of growing structures.
Alvaro Perea
Alvaro Perea received an M.Sc. in physics from Universidad Complutense de Madrid and
a Ph.D. in physics from UNED. He is a senior lecturer at UNED, working in the area
of particle transport phenomena.
Pedro L. Garcia-Ybarra

Pedro L. Garcia-Ybarra received an M.Sc. in physics from Universidad Autonoma de
Madrid and a Ph.D. in physics from UNED, after a predoctoral stay at
Université de Provence (Aix-Marseille I, France). He has been a Chercheur
Associé at Université de Rouen (France), visiting research scientist
at Yale University (Chemical Engineering Department), Universidad Nacional Autonoma
de Mexico (UNAM) and University of California at San Diego (Center for Energy and
Combustion Research). He is currently a professor at UNED, after being head of the
Fossil Fuels Department at CIEMAT (Madrid). He is the secretary of the Spanish
Section of the Combustion Institute.
References
- Barrero
A.,
Loscertales
I.G.,
Micro- and nanoparticles via capillary flows,
Annual Review of Fluid Mechanics, 39
(2007)
89–106.
- Baturina
O.A.,
Wnek
G.E.,
Characterization of Proton Exchange Membrane Fuel Cells with
Catalyst Layers Obtained by Electrospraying,
Electrochemical Solid-State Letters, 8
(2005)
A267–A269.
- Caillard
A.,
Charles
C.,
Boswell
R.,
Brault
P.,
Improvement of the sputtered platinum utilization in proton
exchange membrane fuel cells using plasma-based carbon
nanofibres, Journal of Physics D Applied
Physics, 41 (2008)
185307.
- Castillo
J.L.,
Mackowski
D.,
Rosner
D.E.,
Photophoretic Modification of the Transport of Absorbing
Particles Across Combustion Gas Boundary Layers,
Progress in Energy and Combustion Science, 16
(1990)
253–260.
- Castillo
J.L.,
Rodriguez-Perez
D.,
Martin
S.,
Perea
A.,
Garcia-Ybarra
P.L.,
Structure of Granular Deposits Formed by Aerosol Particles
Conveyed by Fluid Streams, in: Fitt
A.D.;
Norbury
J.;
Ockendon
H.;
Wilson
E. (Eds.),
Mathematics in Industry, vol 15: Progress in
Industrial Mathematics at ECMI 2008,
Springer-Verlag, 2010, pp.
455–461.
- Castillo
J.L.,
Rosner
D.E.,
Theory of Surface Deposition from a Unary Dilute Vapor-Containing
Stream, Allowing for Condensation within the Laminar Boundary
Layer, Chemical Engineering Science,
44 (1989)
925–937.
- Cavarroc
M.,
Ennadjaoui
A.,
Mougenot
M.,
Brault
P.,
Escalier
R.,
Tessier
Y.,
Durand
J.,
Roualdès
S.,
Sauvage
T.,
Coutanceau
C.,
Performance of plasma sputtered fuel cell electrodes with
ultra-low Pt loadings, Electrochemistry
Communications, 11 (2009)
859–861.
- Chen
D.-R.,
Pui
D.Y.H.,
Experimental investigation of scaling laws for electrospraying:
dielectric constant effects, Aerosol Science and
Technology, 27 (1997)
367–380.
- Cloupeau
M.,
Prunet-Foch
B.,
Electrohydrodynamic spraying functioning modes: a critical
review, Journal of Aerosol Science,
25 (1994)
1021–1026.
- DOE,
Hydrogen, Fuel Cell and Infrastructure Technologies Program Multi-Year research,
Development and Demonstration Plan, DOE Editor, Department of Energy,
US,2007.
- Einstein
A.,
Über die von der molekularkinetischen theorie der
wärme geforderte bewegung von in ruhenden flüssigkeiten
suspendierten teilchen, Annalen der Physik,
322 (1905)
549–560. See, Einstein
A.,
Investigations on the Theory of Brownian
Movement, Dover, New York,
1956, p. 17 and successive.
- Elmøe
T.D.,
Tricoli
A.,
Grunwaldt
J.-D.,
Pratsinis
S.E.,
Filtration of nanoparticles: Evolution of cake structure and
pressure-drop, Journal of Aerosol Science,
40 (2009)
965–981.
- Fernandez de la Mora
J., The
fluid dynamics of Taylor cones. Annual Review of Fluid
Mechanics, 39 (2007)
217–243.
- Fernandez de la Mora
J.,
Loscertales
I.G., The
current emitted by highly conducting Taylor cones,
Journal of Fluid Mechanics, 260
(1994)
155–184.
- Gañan-Calvo
A.,
Davila
J.,
Barrero
A.,
Current and drop size in the electrospraying of
liquids. Scaling laws, Journal of Aerosol
Science, 28 (1997)
249–275.
- Garcia-Ybarra
P.L.,
Castillo
J.L.,
Mass Transfer Dominated by Thermal Diffusion in Laminar Boundary
Layers, Journal of Fluid Mechanics,
336 (1997)
379–409.
- Garcia-Ybarra
P.L.,
Castillo
J.L.,
Rosner
D.E.,
Drag on a Porous Sphere with Self-Similar Structure: An
Asymptotic Analysis, Journal of Aerosol
Science, 37, (2006)
413–428.
- Gasteiger
H.A.,
Gu W.,
Makharia
R.,
Mathias
M.F.,
Sompalli
B.,
Beginning-of-life MEA performance-Efficiency loss
contributions, in: Vielstich
W.,
Lamm
A.,
Gasteiger
H.A. (Eds.),
Handbook of Fuel Cells: Fundamentals. Technology and
Applications, vol. 3, John Wiley
& Sons, 2003, pp.
593–610.
- Gruber
D.,
Ponath
N.,
Müller
J.,
Lindstaedt
F.,
Sputter-deposited ultra-low catalyst loadings for PEM fuel
cells, Journal of Power Sources,
150 (2005)
67–72.
- Gu
W.,
Heil
P.E.,
Choi
H., Kim
K.,
Generation of stable multi-jets by flow-limited field-injection
electrostatic spraying and their control via I-V
characteristics, Journal of Physics D: Applied
Physics, 43 (2010)
492001.
- Higuera
F.J.,
Numerical computation of the domain of operation of an
electrospray of a very viscous liquid, Journal of Fluid
Mechanics, 648 (2010)
35–52.
- Houi
D.,
Lenormand
R.,
Particle deposition on a filter medium, in:
Family
F.,
Landau
D.P. (Eds.),
Kinetics of aggregation and gelation, Elsevier
Science Publishers, 1984, pp.
173–176.
- Ihonen
J.,
Jaouen
F.,
Lindbergh
G.,
Lundblad
A.,
Sundholm
G.,
Investigation of Mass-Transport Limitations in the Solid Polymer
Fuel Cell Cathode II. Experimental, Journal of the
Electrochemical Society, 149–4
(2002)
A448–A452.
- Jaworek
A.,
Sobczyk
A.T.,
Electrospraying route to nanotechnology: An
overview, Journal of Electrostatics,
66 (2008)
197–219.
- Jullien
R.,
Meakin
P.,
Simple Three-Dimensional Models for Ballistic Deposition with
Restructuring, Europhysics Letters,
4 (1987)
1385–1390.
- Kim
H.-H.,
Kim
J.-H.,
Ogata
A.,
Time-resolved high-speed camera observation of
electrospray, Journal of Aerosol Science,
42 (2011)
249–263.
- Konstandopoulos
A.G.,
Papaioannou
E.,
Update on The Science and Technology of Diesel Particulate
Filters, KONA Powder and Particle Journal,
26 (2008)
36–65.
- Li
J., On
the stability of electrohydrodynamic spraying in the cone-jet
mode, Journal of Electrostatics,
65 (2007)
251–255.
- Luyten
J.,
Mullens
S.,
Thijs
I.,
Designing With Pores—Synthesis and
Applications, KONA Powder and Particle Journal,
28 (2010)
131–142.
- Martin
S.,
Garcia-Ybarra
P.L.,
Castillo
J.L.,
Electrospray Deposition of Catalyst Layers with ultra-low Pt
Loadings for PEM Fuel Cells Cathodes, Journal of Power
Sources, 195 (2010a)
2443–2449.
- Martin
S.,
Garcia-Ybarra
P.L.,
Castillo
J.L.,
High Platinum Utilization in ultra-low Pt Loaded PEM Fuel Cell
Cathodes Prepared by Electrospraying, International
Journal of Hydrogen Energy, 35 (2010b)
10446–10451.
- Martin
S.,
Perea
A.,
Garcia-Ybarra
P.L.,
Castillo
J.L.,
Effect of the collector voltage on the stability of the cone-jet
mode in electrohydrodynamic spraying, Journal of Aerosol
Science, 46 (2012)
53–65.
- Martin
S.,
Martinez-Vazquez
B.,
Garcia-Ybarra
P.L.,
Castillo
J.L.,
Peak utilization of catalyst with ultra-low Pt loaded PEM fuel
cell electrodes prepared by the electrospray method,
Journal of Power Sources, 229
(2013)
179–184.
- Milosevic
O.,
Mancic
L.,
Rabanal
M.E.,
Gomez L.
S., Marinkovic
K.,
Aerosol Route in Processing of Nano-structured Functional
Materials, KONA Powder and Particle Journal,
27 (2009)
84–106.
- Nagatani
T.,
Growth model with phase transition: drift-diffusion-limited
aggregation, Physical Review A,
39 (1989)
438–451.
- Naito
M., Abe
H.,
Kondo
A.,
Yokoyama
T.,
Huang
C.C.,
Smart Powder Processing for Advanced Materials,
KONA Powder and Particle Journal, 27
(2009)
130–143.
- Noymer
P.D.,
Garel
M.,
Stability and atomization characteristics of electrohydrodynamic
jets in the cone-jet and multi-jet modes, Journal of
Aerosol Science, 31 (2000)
1165–1172.
- Ragucci
R.,
Fabiani
F.,
Cavaliere
A.,
Muscetta
P.,
Noviello
C.,
Characterization of stability regimes of electrohydrodynamically
enhanced atomization, Experimental Thermal and Fluid
Science, 21 (2000)
156–161.
- Rodriguez-Perez
D.,
Castillo
J.L.,
Antoranz
J.C.,
Relationship between Particle Deposit Characteristics and the
Mechanism of Particle Arrival, Physical Review
E, 72 (2005)
021403.
- Rodriguez-Perez
D.,
Castillo
J.L.,
Antoranz
J.C.,
Density Scaling Laws for the Structure of Granular
Deposits, Physical Review E,
76 (2007) 011407.
- Rosner
D.E.,
Mackowski
D.W.,
Tassopoulos
M.,
Castillo
J.,
Garcia-Ybarra
P.L.,
Effects of Heat Transfer on the Dynamics and Transport of Small
Particles Suspended in Gases, Industrial and Engineering
Chemistry Research, 31 (1992)
760–769.
- Tang
K.,
Gomez
A.,
Monodisperse electrosprays of low electric conductivity liquids
in the cone-jet mode, Journal of Colloid and Interface
Science, 184 (1996)
500–511.
- Tassopoulos
M,
O’Brien
J.A.,
Rosner
D.E.,
Simulation of Microstructure Mechanism Relationship in Particle
Deposition, AICHE Journal, 35
(1989)
967–980.
- Tolman
S.,
Meakin
P.,
Off-lattice and hypercubic-lattice models for diffusion-limited
aggregation in dimensionalities 2–8, Phys. Rev.
A, 40 (1989)
428–437.
- Walton
O.R.,
Review of Adhesion Fundamentals for Micron-Scale
Particles, KONA Powder and Particle Journal,
26 (2008)
129–141.
- Yurteri
C.U.,
Hartman
R.P.A.,
Marijnissen
J.C.M.,
Producing Pharmaceutical Particles via Electrospraying with an
Emphasis on Nano and Nano Structured Particles—A Review,
KONA Powder and Particle Journal, 28
(2010)
91–115.
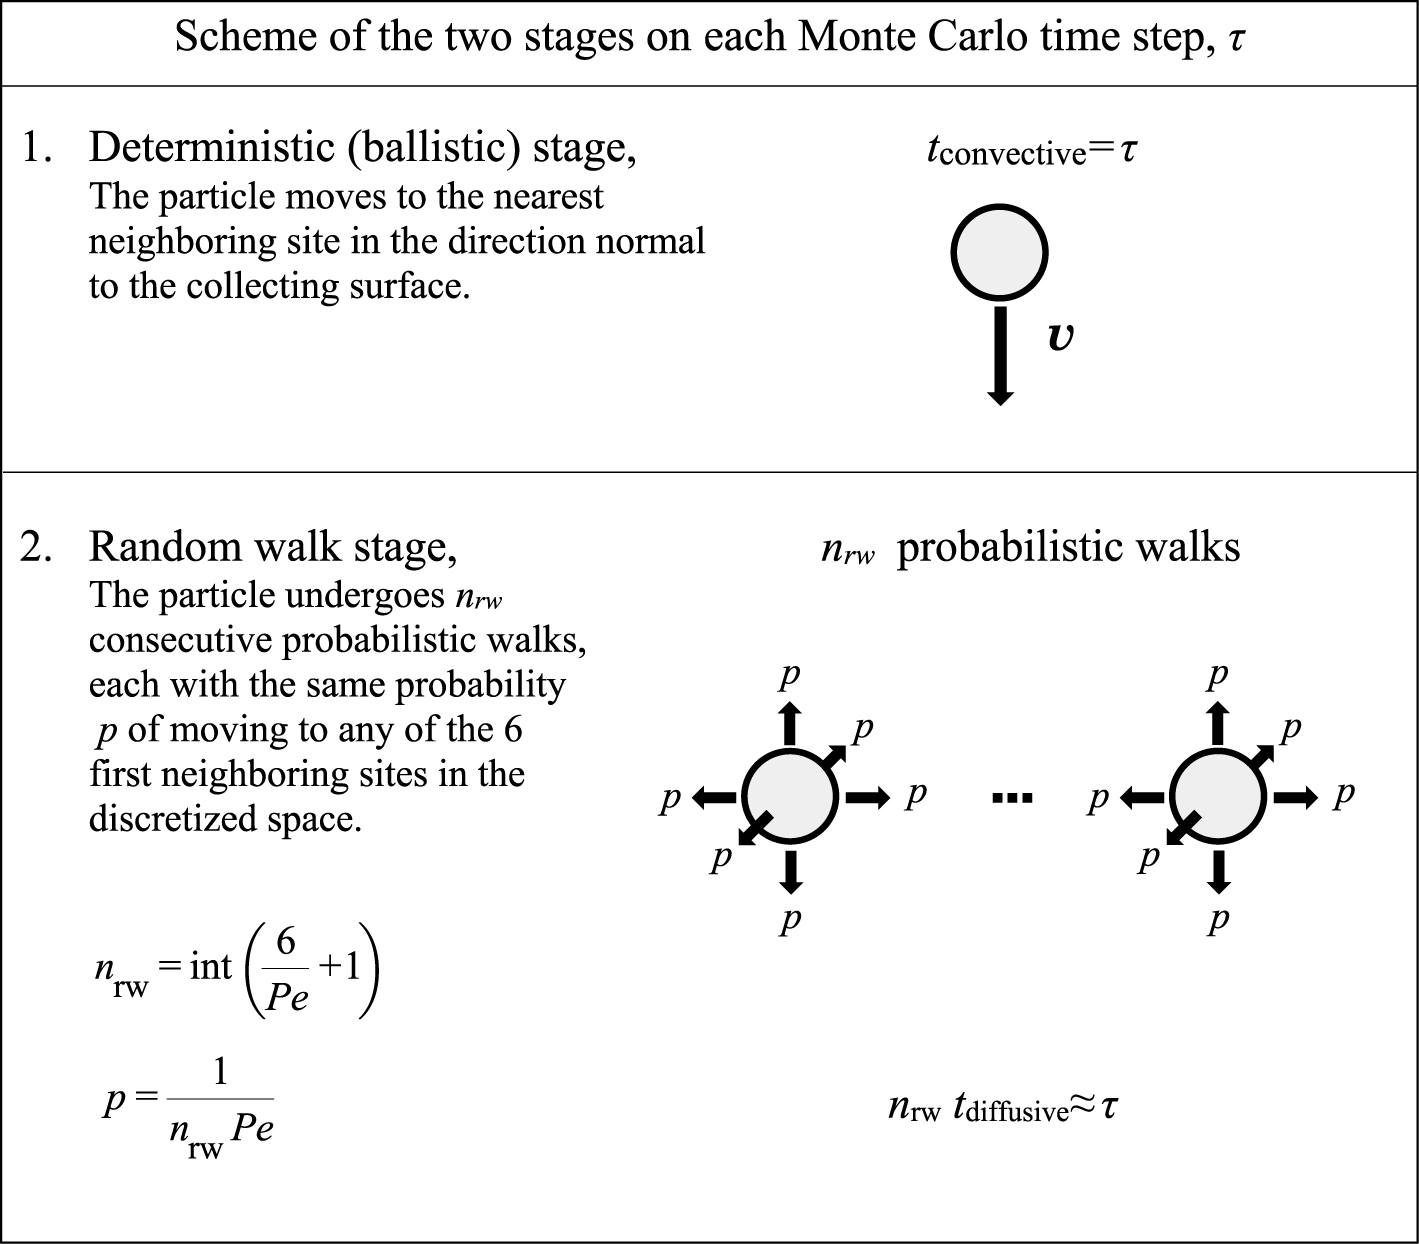
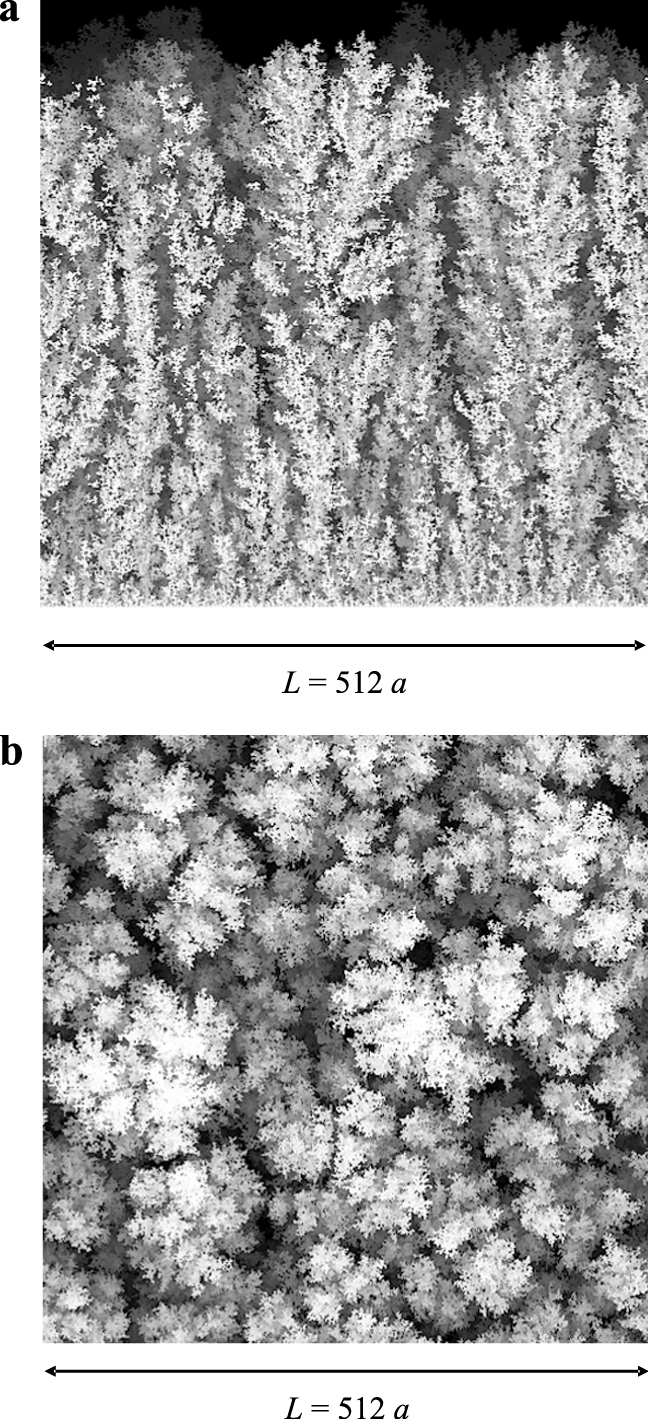

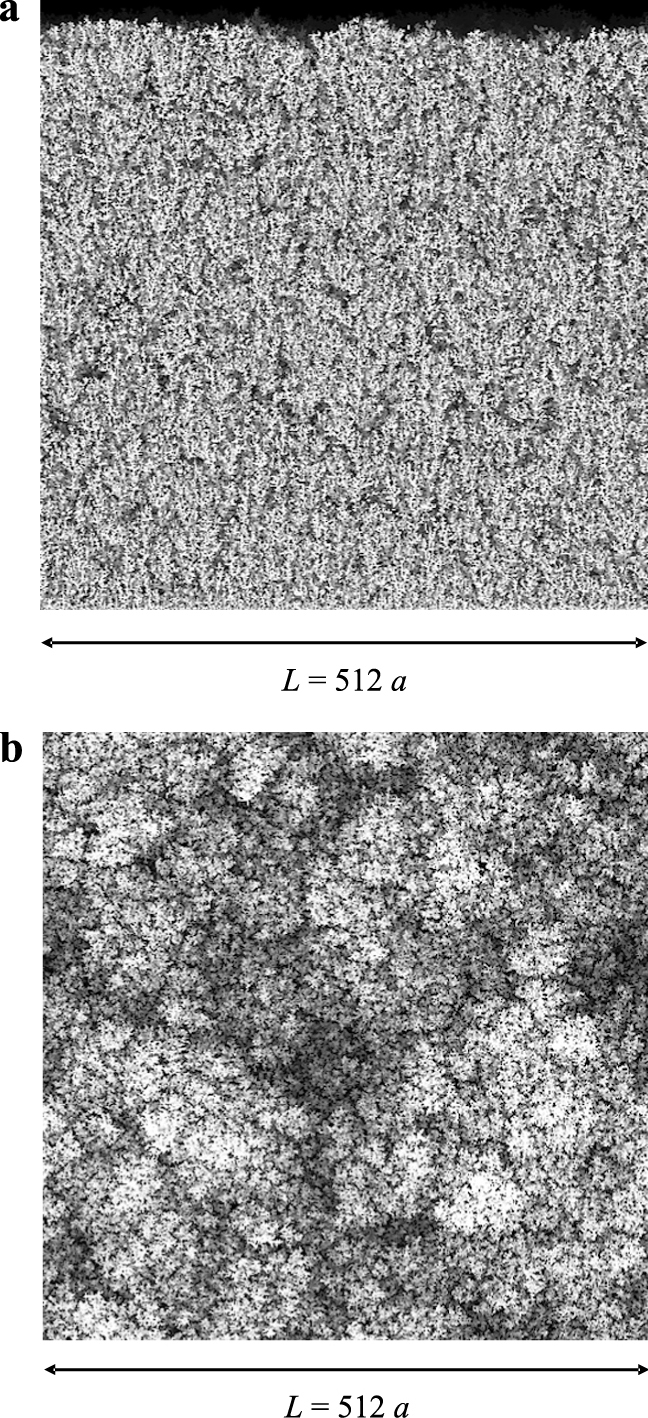
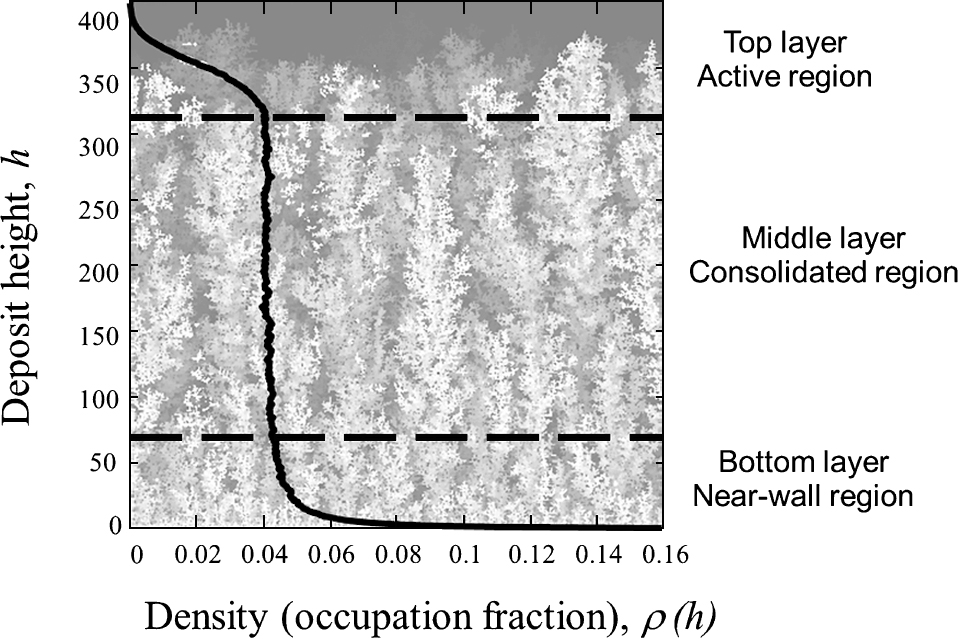


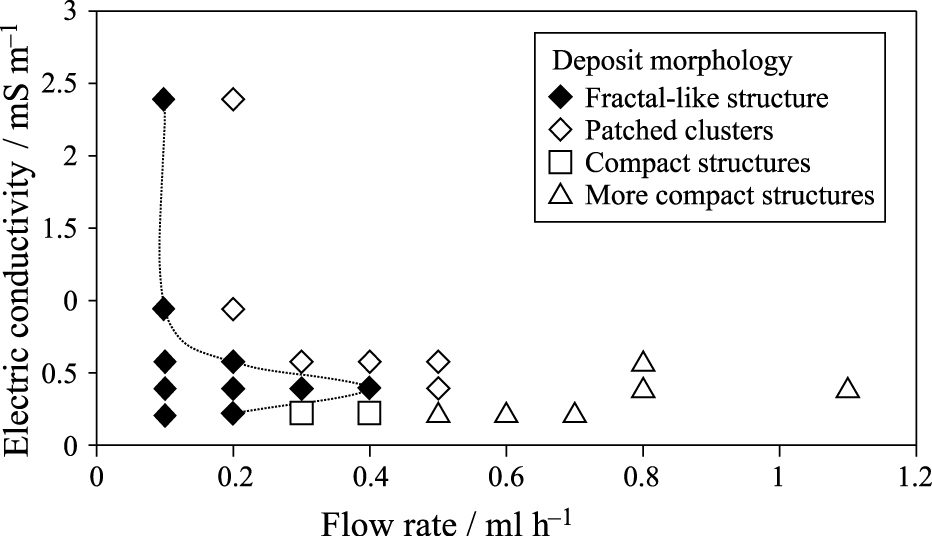


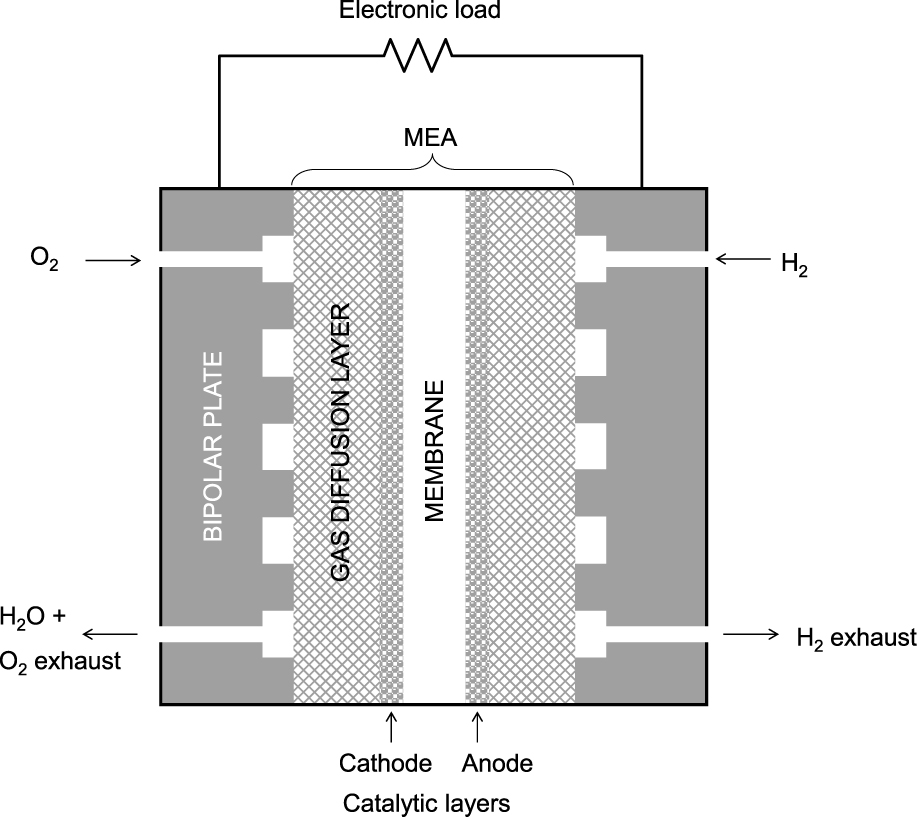
;%0A%09%09%09newWindow.document.open();%0A%09%09%09newWindow.document.write('<img src=%22./Graphics/31_2014012_21.jpg%22>');%0A%09%09%09newWindow.document.close();%0A%09%09)
;%0A%09%09%09newWindow.document.open();%0A%09%09%09newWindow.document.write('<img src=%22./Graphics/31_2014012_22.jpg%22>');%0A%09%09%09newWindow.document.close();%0A%09%09)
;%0A%09%09%09newWindow.document.open();%0A%09%09%09newWindow.document.write('<img src=%22./Graphics/31_2014012_23.jpg%22>');%0A%09%09%09newWindow.document.close();%0A%09%09)
;%0A%09%09%09newWindow.document.open();%0A%09%09%09newWindow.document.write('<img src=%22./Graphics/31_2014012_24.jpg%22>');%0A%09%09%09newWindow.document.close();%0A%09%09)
;%0A%09%09%09newWindow.document.open();%0A%09%09%09newWindow.document.write('<img src=%22./Graphics/31_2014012_25.jpg%22>');%0A%09%09%09newWindow.document.close();%0A%09%09)