Abstract
Generally, in order to learn about a certain quality of a population, a small
portion (sample) is extracted and analyzed for the desired property. In order to
obtain accurate information, the sample has to represent the stream it is taken
from (plant feed, intermediate product, and/or final product). In materials
processing sampling of materials (powders or slurries) is very important to the
quality control and quality assurance purposes. This sample can be too large and
has to be further subdivided, or too small and a two-stage sampler has to be
introduced. In most cases, the desired property is determined by analyzing a
sample as small as a few milligrams. In this regard, obtaining a representative
sample is not as straightforward as it sounds. For homogeneous materials, it is
easy to use statistical probabilities to estimate numbers and sizes of samples
that accurately represent the whole population. However, this is not so easy in
the actual practice especially dealing with inhomogeneous materials. Therefore,
sampling representativeness, perhaps the most important aspect of sampling
practice is emphasized in this paper. Sampling strategies and equipment for dry
materials and slurries are discussed with links to related literature and
sampling equipment manufacturers.
1. Introduction
In order to learn about a certain quality of a population, a small portion is
extracted and analysed for the desired property. If the sample is extracted
correctly (representative of the population), it can provide information that is
used to describe the population. In powder production, as in any materials
processing operations, sampling is very critical to the quality control and for
quality assurance purposes. Such sampling could be done on the feed stream, the
intermediate products, and/or the final products. If this sample is too large then
it has to be further subdivided, and if it is too small then a two-stage sampler has
to be introduced. In most cases, the desired property is determined by analysing a
sample as small as a few milligrams. Using a defined statistical parameter, we can
determine if the sample is representative of the larger quantity. We can utilize
automatic analysis equipment in process-control sampling to minimize detrimental
time delays. The sampling process is as follows:
-
1. Take a gross sample from bulk material.
-
2. Divide the sample into smaller weights as required by the subsequent
processing step. Sample crushing and/or grinding may be needed during such
step.
-
3. Conduct required tests.
2. Sample Weight
Variations in materials quality dictate sampling techniques. For example, materials
containing wide size distributions will require more rigorous sampling than those of
close size distributions. In addition, coarse material needs to be sampled more
carefully as the desired valuable mineral could be non-uniformly distributed in all
the particles. Thus, finer materials may require less sampling than course ones as
shown in Table 1.
Table 1
Minimum Weight of Samples as a Function of Particle
Size
http://www.mine-engineer.com/mining/sample_1.htm
| Particle Diameter In Inches |
Minimum Weight of Sample
(pounds) |
| 0.04 |
0.0625 |
| 0.08 |
0.5 |
| 0.16 |
4 |
| 0.32 |
32 |
| 0.64 |
256 |
| 1.25 |
2048 |
| 2.5 |
16348 |
To specify minimum sample size for estimating particle distributions within allowed
variance, we use a simple approach based on a screening process in terms of binomial
distribution. The particles will either pass through the screen or not. This is
clear from examining the following example given in Perry’s Chemical Engineering handbook (1997). The
sample weight needed for screen analysis can be calculated as follows:
|
W
=
G
(
100
−
G
)
w
/
V
| (1) |
Where:
G= % weight did not pass the desired screen
w = weight of one particle remaining on that screen
V = variance = (Standard error)2
Another example is given by Allen
(2003) and summarized by Davies
(2009) relating a minimum weight for the sample depending to the particle
size and the variance of the tolerated sampling errors as expressed in the following
equation:
|
M
s
=
1
/
2
{
ρ
/
ϕ
2
}
{
1
/
W
λ
−
2
}
d
3
λ
×
10
3
| (2) |
Where:
Ms is the limiting weight in grams
ρ is the powder density in gm/cm3
Φ is the variance of the tolerated sampling error
Wλ is the fractional mass of the largest size
class in the bulk
dλ is the arithmetic mean of the cubes of the
largest diameter in the size class in cm3
3. Number of Samples
In practice, there will always be some differences between the sample and the
population. Repeated samples from the same population may also yield different
results. Therefore, it is important to answer questions such as “What are
the sources of such variations?”, “What is the optimum number of
samples?”, and “How to minimize the errors?” The answers to
these questions are very important so that cost effective and efficient sampling
plans can be designed to achieve the desired information. These sampling principles
are covered by the Theory of Sampling (TOS) which, if properly applied, can lead to
information gathering at a minimum cost and in the shortest possible time. For
materials processing, there are several challenges encountered due to the nature of
the material and/or the processing methods (Gy, 1998). Various sampling errors are discussed in
details by Petersen et al. (2005)
and will be summarized later in this paper.
In statistics it is convenient to use the term population for the
aggregate of all possible measurements or observations of a given type. Of course,
one sample (n = 1) drawn from a population would not give
enough information. However, more samples (n = 100 for
example), if properly drawn, could be very informative about that population.
Important statistical information can be derived from the observations. For example,
the average and the variance can be calculated as shown below.
Usually, the population is characterized by value of the mean
η, and the variance σ2.
The information in the sample is unfolded by calculating the
average, yav.
|
y
av
=
(
y
1
+
y
2
+
…
+
y
n
)
/
n
=
[
Σ
y
i
]
/
n
i
=
1
| (3) |
In practical situations we have a sample, from which we estimate the average, as
mentioned above, and the variance as:
|
s
2
=
[
Σ
(
y
i
−
y
)
2
]
/
(
n
−
1
)
or
s
2
=
[
Σ
y
i
2
−
(
Σ
y
i
)
2
/
n
]
/
(
n
−
1
)
s
2
| (4) |
Where:
Σ yi2 = Crude Sum of
Squares.
(Σ yi)2/n =
the Correction Factor.
[Σ yi2 – (Σ
yi)2/n] = the
Corrected Sum of Squares
(n – 1) = v = the degrees
of freedom
Thus, s2 = the Corrected Sum of Squares/degrees
of freedom.
√s2 = standard error (s.e.)
From the Central Limit Theorem, if y1,
y2 ... yn is a random sample
of size n from a distribution with mean η
and variance σ2, then
yav = η and the variance
V =
σ2/n. It should be noted that
increasing the number of observations (samples) can lead to reduction in the
variance. The implications related to sampling materials will be clarified
later.
Variation in a particular result may be contributed by a number of different
sources.
For example, the yield of a chemical process on a particular day might be determined
by taking one small sample of the product and submitting that sample to a single
laboratory test. Variation in the resulting observed yield would be contributed by:
-
1) the intrinsic day-to-day variability of the process,
-
2) the sampling error, and
-
3) the analytical error.
Before efforts can be directed at reducing the over-all variation it is necessary to
know the relative importance of these different potential sources of variation.
To estimate these sources of variation a special hierarchical (or nested) design may
be run in which two or more samples are taken on each of a number of days, and two
more chemical analyses are run on each sample.
An analysis of variance of the results (ANOVA) makes it possible to isolate and
estimate the separate components of variance associated with:
-
1) variation of the process alone,
-
2) the sampling error alone, and
-
3) the analytical testing error alone
As a result of such a special study, the researcher who is interested in reducing
over-all variation can direct her/his inquiries to the process itself, to the
sampling technique, or to the analytical method, as appropriate. Alternatively,
she/he may increase the number of samples, or the number of analytical tests, so
that through the process of averaging the variance, contribution by any component
may be reduced.
Therefore, it is important to be aware of the sources of errors in any sampling plan.
These errors are summarized below and explained in details by Petersen, et al. (2005).
4. Sampling Errors
In addition to particle size, all the constituent elements of the stream should have
an equal probability of being represented in the sample. Thus, good sampling plans
are designed to avoid the following errors (Petersen et al. 2005):
-
• Compositional error: variations caused by temporal differences in the
chemical nature of the bulk material give rise to this error. This error is
usually reduced by milling the sampling stream and taking many sample
increments from the resulting production cycle.
-
• Segregation error: this depends on the nature of the material and the
ranges of size, shape and density distributions present. Thus, it is
directly related to the amount of segregation in a lot. It can be minimized
a) by mixing or building up a well-mixed composite sample from a large
number of increments and b) by a correct design of the sampling system.
-
• Statistical error: it is the only sampling error that cannot be
suppressed and occurs even in ideal sampling. It can be estimated beforehand
and reduced by increasing the sample size (number of samples) as explained
above.
In this paper, we will focus on mechanical extraction of representative samples of
proper weight and numbers. Manual sampling methods are also used in practice;
however mechanical sampling techniques should be used as much as possible to obtain
best results with minimum errors. In addition, a good sampling strategy should
involve important unit operations as emphasized by several authors (Allen, 2003, Minnitt et al., 2007, and Petersen et al., 2005) including:
-
○ Heterogeneity characterization of new materials
-
○ Sampling bulk material or powder only when in motion.
-
○ Sampling the whole of the moving material stream in many short
increments, rather than part of the stream for the whole of the time.
-
○ Mixing (homogenization) well before all further sampling steps
-
○ Composite sampling
-
○ Particle size reduction (comminution or milling) whenever
necessary
-
○ Representative mass reduction
5. Sampling Practice of Particulate Materials
5.1 Sampling/mass reduction tools and methods
There are several sampling tools and methods that may be used to extract the
primary sample. The choice of particular method depends on many factors
including the relative reliability, type of lot to be sampled, etc. Mass
reduction is often done via scooping devices or using specific mass reduction
devices. Some common mass reduction techniques and devices include: grab
sampling, alternate shoveling, fractional shoveling, spoon method, riffle
splitters, and rational splitters. Examples of these tools are given below for
free and non-free flowing materials.
5.2 Thief or spear sampling
-
• There are several companies that produce and/or sell such
equipment including Samplers direct, Sampling Systems Ltd. UK, EET
Corporation, etc. (Specific sampling equipment supplier names are
provided for information purposes only and do not necessarily imply
endorsement of the equipment by the author) Links to these
companies’ web sites are given at the end of the paper. Sampling
steps generally include,
-
• Thrusting the spear into the bulk (Fig. 1). (Powder falls through holes into the
spear.)
-
• Rotating handle and extracting spear with enclosed sample
Sampling of small heaps is frequently done by coning and quartering. The heap is
flattened and separated into four equal parts by a sharp edged tool, opposite
quadrants are recombined, half the heap is discarded, and the remaining half is
quartered again (Fig. 2). This
process is repeated until the desired sample mass is achieved. Quartering should
not be used for the sampling of free flowing powders. It is more accurate to
sample the powder while it is being poured into a heap rather than after. It is
not recommended to sample stationary free-flowing powder due to segregation.
However, if it must be done, samples should be taken and analyzed separately to
determine the degree of segregation. Fine particles will be concentrated in the
center of the heap while coarser particles will be located in the outer
portions.
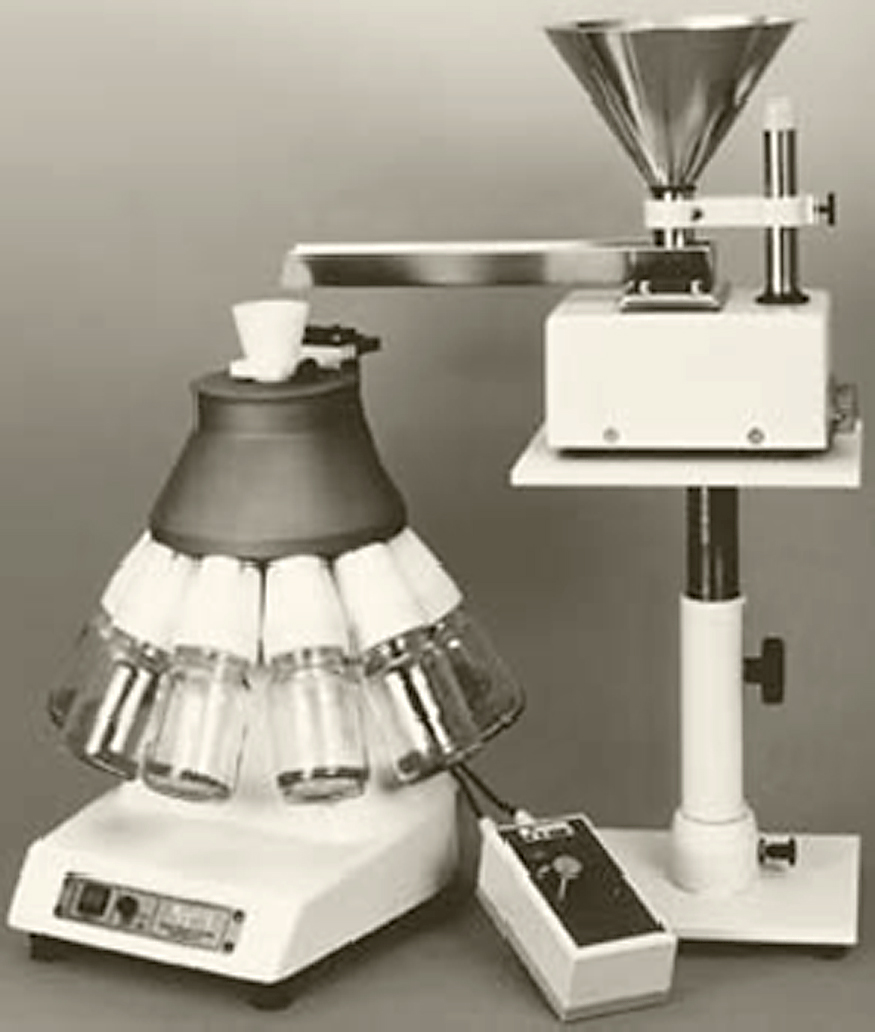
5.4 Laboratory Spinning Rifflers
There are several companies producing such splitters. Among them is Quantachrome
Instruments Company. A picture of a Micro Riffler is given in Fig. 3. There are a couple of videos
on the company’s web site showing the operation of such splitters. For
particles of larger size and samples of larger mass, chute rifflers are used. A
couple of these rifflers are shown in Fig. 4.
It should be noted that reliability of some of these methods is low as shown in
the following Table 2.
Table 2
Reliability of some sampling/mass reduction techniques
| Method |
Estimated Maximum error
(%) |
| Cone & Quartering |
22.7 |
| Scoop Sampling |
17.1 |
| Table Sampling |
7.0 |
| Chute Riffling |
3.4 |
| Spinning Riffling |
0.42 |
The following points should be taken into consideration before sampling takes
place:
-
▪ It is usually assumed that the material is well mixed, but this
assumption is often incorrect and biased sampling results.
-
▪ Surface sampling by scoop is unreliable.
-
▪ Better accuracy is obtained if samples are taken from the body
of the material by the use of a sampling spear or thief.
-
▪ A template should be devised so that samples can be withdrawn
from various parts of the material volume.
-
▪ Never take scoop samples if at all possible from heaps. If it
must be done, use coning and quartering or chute riffling of the whole
heap.
-
▪ Sampling materials in bags, bins, wagons, bottles should not be
done using scoop or spatula samples. Try to sample the materials when
the containers are being filled.
-
▪ Expect large sampling errors from stored material sampling.
Examples of point samplers for free-flowing and non-free-flowing materials from
gravity lines and hoppers are also given in the web site of Sentry Equipment
Corporation. A picture of this sampler in operation is given in Fig. 5 below.
The sampler takes a sample when a gear motor-driven auger draws the product to
the discharge point. A schematic of similar operation is shown in Fig. 6 below (After Davies 2009).
5.7 Sampling Flowing Streams
In this case, Terry Allen’s Golden Rules of Sampling should be applied as
suggested by Davies (2009):
-
• A bulk material or powder should only be sampled when in
motion.
-
• The whole of the moving material stream should be sampled in many
short increments, rather than part of the stream for the whole of the
time.
-
• The sampling cutter should be designed to introduce no bias in the
sampling of the largest particles present, and the cutter must never be
allowed to overflow.
-
• To sample a moving stream the gross sample is made up of a series
of increments. In this case, the minimum incremental weight is given by
multiplying the flow rate times the cutter width (for a traversing
cutter) and the cutter velocity. The cutter width should be large enough
(about 10 times the largest particle diameter) so that a biased sample
deficient of coarse particles may be avoided.
When sampling from a conveyor belt, it is best to sample material as it cascades
over the end of the conveyor belt as shown in Fig. 7. If this is not possible samples must be taken from
the belt itself. Some automatic samplers have a moving arm that sweeps across
the belt collecting all of the materials within a particular area. Sampling from
a moving stream can be done continually or intermittently. Poor and good
sampling procedures are shown below. A schematic drawing is shown in Fig. 8 to illustrate the reasons for
such classification (Courtesy of Davies, 2009).
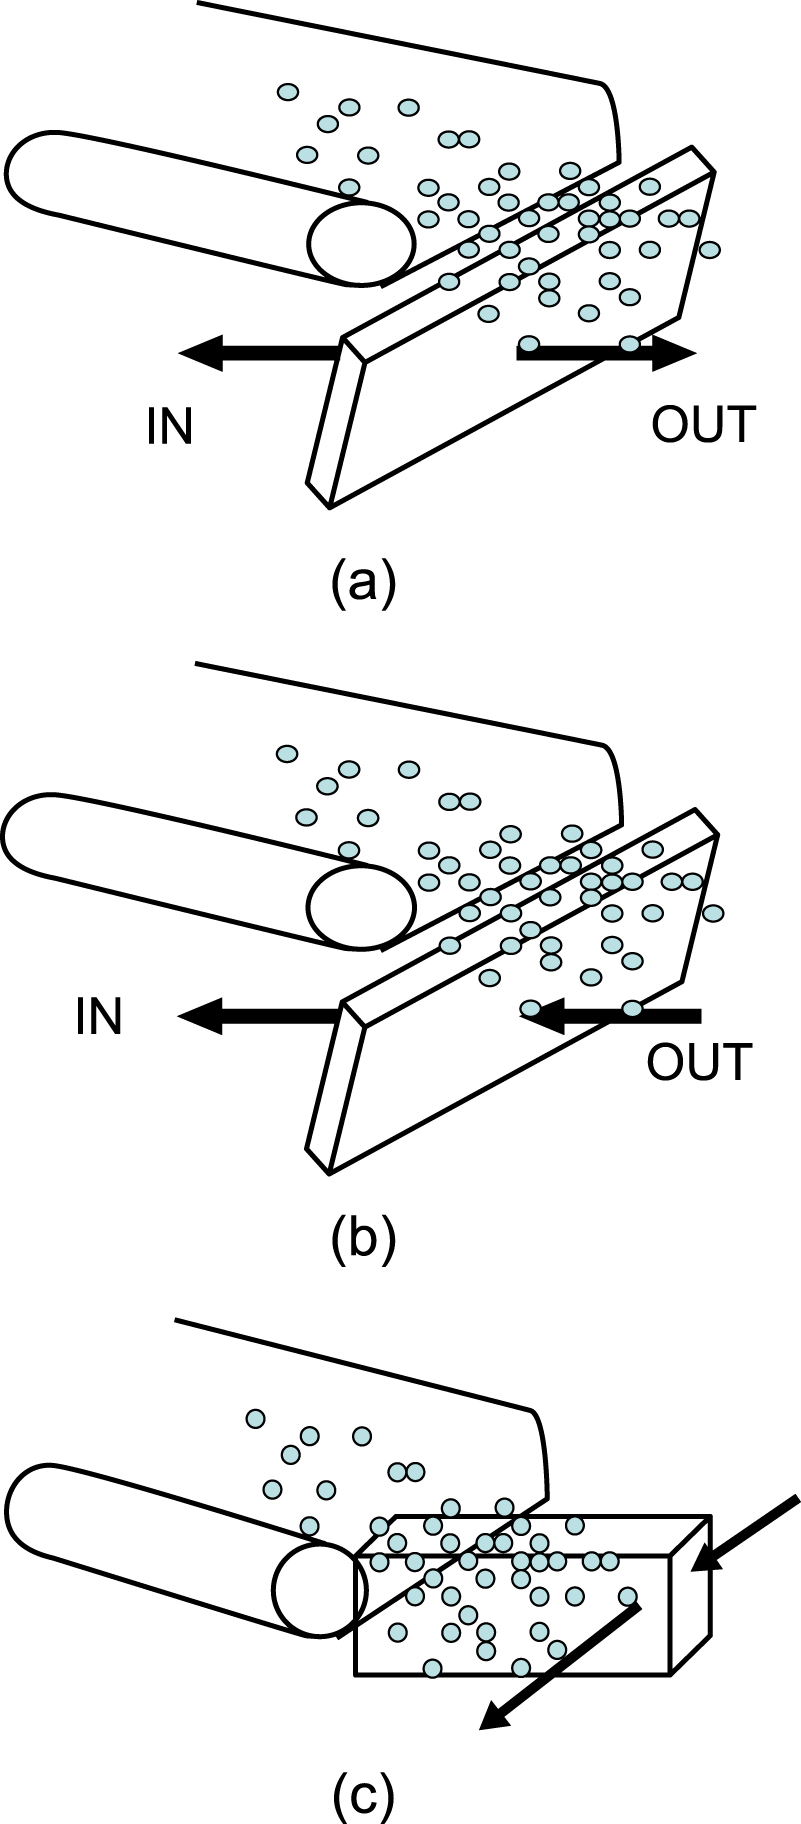
In Fig. 8 (a) the
sample will not represent the whole size distribution as the course particles
will not be collected together with the fine particles. However, this does not
happen in part (b). There are several samplers that can be used for
Belt Conveyor sampling such as the ones sold by Sentry Equipment Corporation
[www.sentry-equip.com] and Intersystems Company
[www.intersystems.com]. The picture of this machine is shown
below. The company’s web site contains more details as well as a video
for this sampler and others.
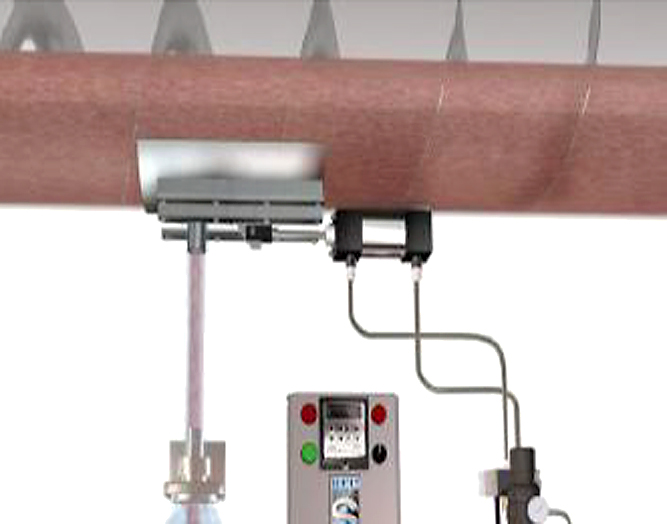
Point samplers for sampling granules from a screw conveyor are also among the
automatic sampling devices sold by various manufacturers. An example is the one
sold by Sentry Equipment Corporation [www.sentry-equip.com] shown in Fig. 9 below. Their web site contains more details as well
as a video of an operating sampler.
6. Slurry Sampling
Slurries (a mixture of liquid and solid) are generally easier to sample than solids.
Since slurries can be pumped through pipes and are in constant motion, we can almost
get a perfect representative sample. However, getting a complete cross section can
be difficult due to the pipes being round. In-pipe samplers do not adequately
extract particles at the pipe walls and thus you must consider both the location and
the type of sampler in order to obtain a representative sample.
For accurate primary sampling, it is recommended that you sample at a dumping point.
Samples are taken at a pipe discharge point using a cross stream sampler along with
a slurry cutter. For secondary sampling, the primary sample can be split using a
vezin sampler discussed on the web site of Multotec Company, 2012 (www.multotec.com.au.). Fine particles can be reduced by using a
2% cutter, reducing the primary sample by 98%. Two or three vezins
can be used to split larger samples to final lab size volumes for the quality
control testing.
In order to assure a representative sample, all material in a process flow should
have an equal probability of being part of the sample. Typical process streams
require a turbulent flow to keep the slurry in suspension (speed >1.5 m/s)
as turbulence keeps the slurry well mixed. Lighter and finer solids in slurry
require a greater level of mixing. When particles are above 100 μm in size
and/or of high specific gravity material, mixing still produces the desired effect
in the horizontal direction. We can use several mechanical sampling equipment, as
discussed below, to obtain representative samples.
6.1 Mechanical sampling equipment
For slurry that flows by gravity through launders and sloped pipes, samples are
taken from the point of discharge. Samples can also be taken at an open
discharge from a vertical gravity pipe. There are two basic mechanical sampler
designs for sampling material from a gravity flow such as sampling with linear
cutter motion and sampling with radial cutter motion. When equipment is properly
designed and operated, both designs produce the same result. Based on flow
quantity, we can determine the mechanical installation factors. Equipment
suppliers should be consulted to provide the proper design for any particular
application. For helpful information, you may consult Perry’s Handbook
of Chemical Engineering (1999).
6.2 Sampling from Pipes
In Florida phosphate industry, sampling equipment is either home-custom made or
obtained from suppliers such as in Fig. 10 from Sentry Equipment Corp. The following is a general
description of sampling slurries either flowing under pressure or by
gravity.
6.2.1 Pressure Flow
We must determine the primary sample flow for process streams under pressure.
This is done by finding the balance between sampler pressure head and sample
pipe friction. Outokumputechnology.com (2011) offers a full description of
primary samplers and criteria relating sampler specifications to pipe size
and flow rates. In addition, sentry-equipment.com offers a wide array of
sampling equipment that can be used for slurry sampling from pipes under
pressure flow or gravity flow. Fig. 11 shows an example of such equipment
(ISOLOK® SAA Automatic Fixed Volume Sampler).
6.2.2 Gravity Flow
Gravity flowing slurries either through in launders, sloped pipes or vertical
gravity flow pipe, should be sampled at the point of discharge. A vertical
sample cutter can be used for process streams at/around ambient pressure. In
order to obtain a proper sample using this technique, you must ensure that
the cutter used has an opening many times larger than the largest particle
size of sample slurry (preferably greater than 20 mm, no less than 8 mm).
You can use an adjustable cutter opening to adjust sample flow for pipe
sizes up to 400 mm. Several sampling steps or innovative sampling designs
are required.
Outokumputechnology.com (2011). In addition to Outokumputechnology (now
Outotec), Sentry Equipment Corporation and other suppliers have several
samplers that can be used for this purpose. These companies’ web
sites are given below to guide you to choose the best sampler for your
application. Another example of samplers that can be used for flowing
streams either under pressure or under gravity is shown in Fig. 11 as published by Sentry
Equipment Corporation (2011).
There are other types of samplers using linear and rotary traverse
mechanisms. The following is an example of how to calculate amount of sample
in every increment as mentioned in Perry’s Handbook of Chemical Engineering (1997).
6.2.3 Slurry Sampling by Rotary Traverse of Gravity Flow
Given the following information, the quantity of slurry extracted by one
rotation, S, can be calculated.
S = increment volume (quantity of slurry extracted by
one rotation)
B = bulk slurry flow, in volume/unit time
R = rotation of cutter, in rpm
D = cutter angle opening, D/360
= extraction ratio for continuous cutter rotation
In addition to mechanical sampling equipment, hand sampling can be used to
obtain samples from gravity flowing material from chutes, vibrating screens,
belts, etc. When sampling from such streams, it is best to sample material
as it cascades over the end of the equipment as explained earlier in the
case of belt conveyors.
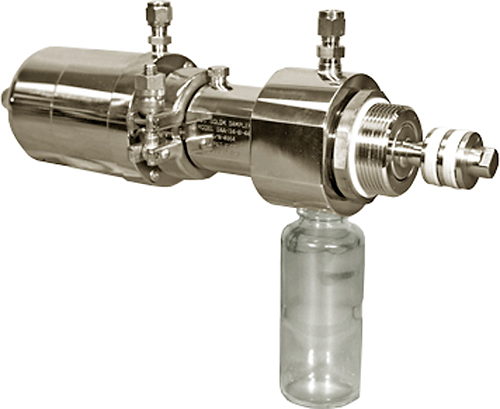
Suppliers of sampling equipment are eager to help in choosing the proper
samplers for specific applications. Another example of such equipment is
presented in Fig. 12 as a
courtesy of Sentry Equipment Corp. The
ISOLOK® SAB operates when compressed air
forces the plunger into the process line to capture a fixed volume of
material. Compressed air then acts on the opposite side of the piston to
retract the plunger to a position which allows the sample to drop by gravity
into a container. The operator is isolated from the process at all times by
the sampler’s seal design, and the sample captured in the container
is “locked out” from external influences. The reader is
advised to consult the manufacturer catalogue for further details.
6.2.4 Calculation of Sample Extraction Increments
Cooper in Perry’s Handbook
of Chemical Engineering (1997) presents clearly several examples
illustrating calculation of incremental weights obtained by three commonly
used sampling methods. These methods include: (a) Linear Traversing
Trajectory Cutter, (b) Slurry Sampling by Rotary Traverse of Gravity Flow as
explained above, and (c) Cross-Belt Sampling of Solids from Conveyors
6.2.5 Processing Wet Samples
Collected samples are dried in air and/or ovens provided that drying does not
affect the chemistry of the sample contents. The dried samples then will be
treated as dry powder sampling procedure explained earlier.
7. Summary Highlights of Sampling Rules
Several authors including Allen
2003, Davies 2009, Gy 1998, 2004a, 2004b, Minnitt et al. 2007,
and Petersen et al. 2005 stressed
the importance of the following points:
There are several sampling tools and methods that may be used to extract the primary
sample. The choice of particular method depends on many factors including the
relative reliability, type of lot to be samples, etc. It should be noted that
reliability of some of these methods is low.
It is usually assumed that the material is well mixed, but this assumption is often
incorrect and biased sampling results.
Select general guidelines for obtaining reliable sampling results are as follows.
-
• Never take scoop samples if at all possible from heaps. If it must be
done, use coning and quartering or chute riffling of the whole heap.
-
• Sampling materials in bags, bins, wagons, bottles should not be done
using scoop or spatula samples. Try to sample the materials when the
containers are being filled.
-
• A bulk material or powder should only be sampled when in motion.
-
• The whole of the moving material stream should be sampled in many
short increments, rather than part of the stream for the whole of the
time.
-
• When sampling from a conveyor belt. It is best to sample material as
it cascades over the end of the conveyor belt. If this is not possible
samples must be taken from the belt itself.
Acknowledgements, Copy right statement and disclaimer
Financial support of this work was provided by the Center for Particulate and
Suspension Systems (CPaSS) a NSF I/UCRC (NSF Grant #0749481). Opinions
expressed are those of the authors and do not necessarily represent the views of the
NSF or the CPaSS Industry Members. Commercial suppliers of the various equipment are
provided for information purposes only and do not necessarily imply endorsement of
the specific equipment by the authors.
Links to Literature
-
• The Accuracy of Systematic Sampling from Conveyor Belts: http://www.jstor.org/stable/pdfplus/2985832.pdf
-
• Sampling equipment: http://www.powderandbulk.com/analyzers/samplers.htm
-
• Belt conveying equipment:
http://www.powderandbulk.com/conveying/belt.htm
http://www.directindustry.com/industrial-manufacturer/bulk-and-powder-handling-and-equipment-152/conveyor-belt-61357.html
http://www.ktron.com/products/pneumatic_conveyors/index.cfm
http://www.flexicon.com/us/products/PneumaticConveyingSystems/index.asp
http://www.vac-u-max.com/pneumatic.html
Author’s short biography
Hassan El-Shall

Dr. El-Shall is a professor emeritus at the Department of Materials Science and
Engineering of University of Florida. He has been serving as an associate professor
of Materials Science and Engineering and Associate Director for Research at The
Particle Engineering Research Center of University of Florida since 1994. He also
served as Associate Director for beneficiation research at the Florida Institute of
Phosphate Research from 1986–1992. In the early 80’s, he has served
as assistant professor of Mineral Processing at Montana Tech from 1980 to 1986. He
posses thirty nine years of diverse experience in research (both basic and applied),
management, as well as hands-on experience in the areas of Applied Surface and
Colloid Chemistry, Mineral Processing, Chemical Metallurgical Engineering, and
related environmental services. His work related to industrial minerals such as
phosphate, gypsum, clay, etc is recognized by his peers allover the world. In
addition, he has extensive and practical experience in the development of training
and teaching programs for both undergraduate and graduate students in the above
fields. His major research interests include interfacial phenomena and its
applications in mineral industry, and waste treatment in various industries. He
expanded his research efforts to include mineral modifications for medical
applications.
Dr. El-Shall has published over 165 publications including: 11 patents, 9 edited
books, one authored manual, 19 chapter contributions to books, over 50 Refereed
articles in prestigious journals such as Powder Technology, Mineral and
Metallurgical Processing, International Journal of Mineral Processing, and others,
in addition to many industrial reports.
Dr. El-Shall is a dedicated teacher in the fields of Mineral processing Engineering,
Materials Science and Engineering, and Chemical Engineering. He has served as chair,
co-chair, or a member of over 50 graduate committees for M.S. and Ph.D. students
including his own 15 M.Sc. and 13 Ph.D. students who are currently employed by
various industries.
BRIJ M. MOUDGIL

Dr. Brij M. Moudgil is a Distinguished Professor of Materials Science and
Engineering, Director of the Particle Engineering Research Center (PERC), and the
Center for Particulate and Surfactant Systems (CPaSS–NSF I/UCRC) at the
University of Florida, Gainesville, FL. Dr. Moudgil also serves as the Director of
the UF Mineral Resources Research Center. He received B.E. (Metallurgy) degree from
the Indian Institute of Science (IISc), Bangalore, and M.S. and Eng.Sc.D. Degrees in
Mineral Engineering from the Henry Krumb School of Mines, Columbia University, New
York, NY. His research and professional leadership accomplishments are recognized by
several major awards including his election to the National Academy of Engineering
(NAE), U.S.A. He has been also elected as Foreign Fellow of the Indian National
Academy of Engineering. He is recipient of the 2003 Distinguished Alumni Award of
the Indian Institute of Science, Bangalore. He served as 2006 President of the
Society for Mining Metallurgy and Exploration, Inc. (SME). His current research
interests include engineered particulate systems for enhanced performance in nano
and bio technologies, advanced materials and minerals, microelectronics,
photocatalytic degradation of hazardous microbes, nanotoxicity, and greener reagents
and particle technologies.
References
- Allen
T., Powder
sampling and particle size determination, first ed.,
Elsevier, New
York, 2003.
- Cooper
H., Sampling of
Solids and Slurries in Solid-Solid Operations and Equipment, section 19,
Perry’s Handbook of Chemical Engineering, seventh
edition, McGraw-Hill,
1997.
- Davies
R., Sampling
Particulate Materials, A short course at Particle Engineering Research
Center, University of Florida,
(April 2009).
- Gy
P., Sampling for
analytical purposes, John Wiley &
Sons, New York,
1998.
- Gy
P.,
Sampling of discrete materials, A new introduction to the theory
of sampling: I. Qualitative approach, Chemometrics and
Intelligent Laboratory Systems, 74(1)
(2004a)
7–24.
- Gy
P.,
Sampling of discrete materials: A Quantitative approach—
sampling of zero-dimensional objects, Chemometrics and
Intelligent Laboratory Systems, 74(1)
(2004b)
25–38.
- Minnitt
R.C.A.,
Rice
P.M.,
Spangenberg
C., Part
1: Understanding the components of the fundamental sampling error: A key to good
sampling practice, Journal of the South African
Institute of Mining and Metallurgy,
107(8) (2007)
505–511.
- Petersen
L.,
Minkkinen
P.,
Esbensen
K.H.,
Representative sampling for reliable data analysis: Theory of
sampling, Chemometrics and Intelligent Laboratory
Systems, 77(1–2)
(2005)
261–277.


;%0A%09%09%09newWindow.document.open();%0A%09%09%09newWindow.document.write('<img src=%22./Graphics/31_2014014_13.jpg%22>');%0A%09%09%09newWindow.document.close();%0A%09%09)
;%0A%09%09%09newWindow.document.open();%0A%09%09%09newWindow.document.write('<img src=%22./Graphics/31_2014014_14.jpg%22>');%0A%09%09%09newWindow.document.close();%0A%09%09)