Original Research Papers
Mechanical Properties of Agglomerates Produced by the Mechanical Vibration of Cohesive Powders
2016 Volume 33 Pages 287-295

Details
2016 Volume 33 Pages 287-295
The process of granule formation from aggregative cohesive powders under the action of mechanical vibration is studied. Vibration frequency and acceleration levels were set independently in the experiments. The process of agglomerate formation is examined by measuring the size distributions of the agglomerates and their resistance under uniaxial compression. The results indicate the formation of wide particle size distributions and hard and compact agglomerates. The experimental results and the interpretation of data suggest that, in order to produce agglomerates by mechanical vibration, powders should have flow functions with a flow factor value smaller than 3. In agreement with the theoretical framework proposed, agglomerate consolidation pressures and deformation at breakage seem to be almost independent of the agglomerate diameter and the vibration conditions.
Powder granulation is used in many different industrial applications such as the production of pesticides, fertilizers and ceramics. The general purpose is to improve the handling and the storage behavior of these solid materials. On the one hand, with fine and cohesive powders, mechanical vibrations can be used to produce stable agglomerates (Ku N. et al., 2015; Mawatari Y. et al., 2007). On the other hand, the self-agglomeration of cohesive powders may happen in processes involving mechanical vibrations, leading to undesired problems. Among these, we mention solids segregation in processes involving powder flow and also gas-solids segregation in industrial applications which require an intimate gas-solids contact. The aggregative behavior of fine cohesive powders under the action of vibrations was described by Barletta D. and Poletto M. (2012) following the analysis introduced previously (Barletta D. et al., 2007). Nano-powders also produce self-aggregation phenomena in vibrated beds (Van Ommen J.R. et al., 2012). Mechanical vibrations have also been applied together with powder drying processes to control and promote powder agglomeration (Cruz M.A.A. et al., 2005). The objective of this paper, however, will be the agglomeration of cohesive powders due to compaction in vibrated beds without the use of a fluidizing gas or at least under application of a minimum gas rate with the purpose of system conditioning, but not the ability to sustain the bed.
One of the most significant characteristics of a granulation process is the granules’ mechanical resistance. In fact, the produced granules should be able to resist the external forces during storage and transportation in order to avoid dust formation and changes to the granules’ size distribution. A recent study on the resistance of agglomerates under the action of compression and their mechanical behavior was given by Antonyuk S. et al. (2005). They provided a significant insight into the rupture mechanism and into the mechanical response of agglomerates for elastic, elastic-plastic and plastic agglomerate deformation regimes. The resistance of agglomerates in dynamic conditions was studied by Antonyuk S. et al. (2006).
In this paper, the process of granule formation from aggregative cohesive powders under the action of mechanical vibration is studied. The equipment used allows the vibration frequency and acceleration levels to be set independently. The process of agglomerate formation is examined by measuring the agglomerate’s size distributions and also by the agglomerate’s resistance under uniaxial compression.
The apparatus used is described by Barletta D. et al. (2013). A sketch of the apparatus, a vibrated fluidization column, is shown in Fig. 1. The fluidization column was made of Perspex with an 85-mm ID and a height of 400 mm (1). At the bottom, the air was distributed by a 10-mm thick porous plate of sintered brass particles. The porous plate was clamped in the flange connecting the wind box and the fluidization column. In the column flange, a pressure port was connected to a U-tube manometer (6) filled with water. Desiccated air from the laboratory line was fed to the wind box by a thermal mass flow controller (Tylan FC2900V) with a maximum flow rate of 5 10−5 Nm3 s−1 (4). The column was fixed to the vibrating plane of the actuator by means of a rigid steel and aluminum structure (3). The actuator (2) was an electric inductance vibrator (V100 Gearing and Watson, USA) that was able to produce a sinusoidal vertical movement in the range between 2 and 6500 Hz with displacement amplitudes of up to 12.7 mm, exerting a maximum force of 26.7 kN. The vibrator amplifier was connected to a vibration controller Sc-121 (Labworks inc., USA) (7). The controller measured the effective vibrations by means of a piezoelectric accelerometer (8636B60M05 Kistler, USA) (5) fixed on the metal structure supporting the fluidization column. The system was able to control vibrations by fixing, within the operating range, any of the two possible pairs of vibration parameters, i.e. acceleration, amplitude or frequency. In fact, the maximum acceleration, a, is related to the oscillation amplitude, A, and the oscillation frequency, f, or the pulsation value, ω by means of the following relationship:
| (1) |
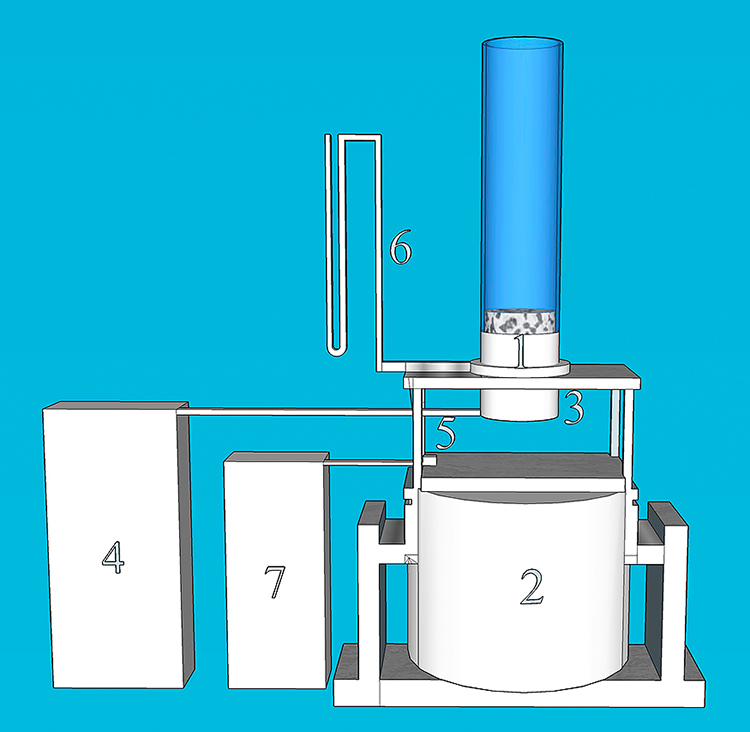
Schematic of a mechanically vibrated bed. Legend: 1. fluidization column; 2. electro-dynamic vibrator; 3. metallic frame; 4. mass flow controller and air feed unit; 5. accelerometer; 6. water manometer; 7. vibration control block.
Two different powders were used in the experiments, a calcium carbonate (CaCO3) powder and a titanium dioxide (TiO2) powder. The properties of these two powders are reported in Table 1. The rheological properties were measured with a Schulze ring shear tester (Schulze D., 1994). The flow functions (unconfined yield strength as a function of the major principal stress) at high consolidation values, namely between 10 kPa and 170 kPa, were measured with a uniaxial testing procedure carried out on an Instron tester (Series 5860) equipped with a 1-kN load cell. The mold was a steel cylinder made of two detachable halves as described by Parrella L. et al. (2008). It allowed the production of cylindrical samples of compacted powder of 50 mm in diameter and about the same height. In order to compensate for wall friction in the consolidation phase, a Janssen (Janssen H.A., 1895) correction was used to determine the vertical consolidation stress during the uniaxial compression tests
| (2) |
| (3) |
| Material | dp μm | ρp kg m−3 | σ1 Pa | fc Pa | ρb kg m−3 | ϕ deg | ϕe deg | ϕw deg | Sc*/da Eqn. (15) |
|---|---|---|---|---|---|---|---|---|---|
| CaCO3 | 4.1 | 2540 | 471 | 410 | 350 | 35 | 50 | 30 | 0.039 |
| TiO2 | 0.2 | 4500 | 345 | 300 | 785 | 40 | 50 | 39 | 0.019 |

Flow functions of calcium carbonate (○) and of titanium dioxide (□) measured with a uniaxial testing procedure.
Beds of cohesive calcium carbonate and titanium dioxide powders were vibrated vertically at frequencies of 25 or 50 Hz and at acceleration levels, a/g, of 6 or 9. A desiccated air flow was used to keep the powder humidity constant during the experiments. The experimental conditions for both materials are reported in Table 2. For calcium carbonate, if we assume test C3 as a reference case, then the other test conditions change for one or maximum two variables. Namely, in Test C1, half of the process time is considered; in Test C2, the frequency is doubled and the processing time is tripled; in test C4, the acceleration is reduced by 1/3. Similarly, for titanium dioxide, we can assume test T2 as a reference case, then in Test T1, half of the bed mass is considered; in Test T3, the processing time is tripled; in tests T4 to T6, the frequency is doubled; double process time is used in T5 and 4 times the process time in T6.
| Test code | Material | Frequency Hz | Acceleration a/g | Displacement mm | Air rate NL h-1 | Bed mass g | Test time min | Description |
|---|---|---|---|---|---|---|---|---|
| C1 | CaCO3 | 25 | 9 | 6.8 | 1200 | 100 | 10 | half time |
| C2 | CaCO3 | 50 | 9 | 1.5 | 1200 | 100 | 30 | double freq., long time |
| C3 | CaCO3 | 25 | 9 | 6.8 | 1200 | 100 | 20 | reference |
| C4 | CaCO3 | 25 | 6 | 4.6 | 1200 | 100 | 20 | reduced accel. |
| T1 | TiO2 | 25 | 9 | 6.8 | 1200 | 100 | 5 | half mass |
| T2 | TiO2 | 25 | 9 | 6.8 | 1200 | 200 | 5 | reference |
| T3 | TiO2 | 25 | 9 | 6.8 | 1200 | 200 | 10 | double time |
| T4 | TiO2 | 50 | 9 | 1.5 | 1200 | 200 | 5 | double freq. |
| T5 | TiO2 | 50 | 9 | 1.5 | 1200 | 200 | 10 | double freq., double time |
| T6 | TiO2 | 50 | 9 | 1.5 | 1200 | 200 | 20 | double freq., long time |
The resulting granules were classified by coarse sieving using a stack of three sieves of 400 μm, 1 mm and 2 mm aperture size, respectively. For some of the test conditions, the portion of granules bigger than 2 mm was collected to measure the granules’ mechanical resistance. For this purpose, a uniaxial compression test was adopted by using an Instron machine (Series 5860) equipped with a 1-N load cell.
Sieve analysis was applied to the processed powders including agglomerates. Significant losses of fines were recorded due to adhesion to the column wall and to elutriation of dust. Fig. 3a shows the 2-mm oversize fraction for calcium carbonate. Besides the weight distribution in the different classes identified by the sieving process in Table 3, Fig. 4 also reports an estimate of the median-mass-weighted agglomerate size and the error bars are the diameter range covering the 80 %-by-weight of the distribution of agglomerate size. This latter size range was estimated by fitting the weight distribution by means of a power law. By comparing results, it is possible to observe a limited effect of the operating parameters. In general, the median agglomerate size is between 0.5 and 1.6 mm and the largest agglomerates are above 3–4 mm. Increasing the frequency from 25 to 50 Hz has negligible effects on the size of the titanium dioxide agglomerates, while it seems to produce smaller agglomerates of calcium carbonate. Increasing the vibration times results in larger titanium dioxide agglomerates.

Examples of agglomerates formed: a) 2-mm oversize fraction for CaCO3; b) CaCO3; c) TiO2.
| Test code | sampled weight fractions in da ranges, % | |||
|---|---|---|---|---|
| < 0.4 mm | 0.4–1 mm | 1−2 mm | > 2 mm | |
| C1 | 11.2 | 22.6 | 27.6 | 38.6 |
| C2 | 43.4 | 24.4 | 9.8 | 22.4 |
| C3 | 13.6 | 27.4 | 21.1 | 37.9 |
| T1 | 35.8 | 19.4 | 10.5 | 34.3 |
| T2 | 26.7 | 24.8 | 19.0 | 29.6 |
| T3 | 21.2 | 25.1 | 18.5 | 35.2 |
| T4 | 31.7 | 23.5 | 15.3 | 29.4 |
| T5 | 29.4 | 37.5 | 25.5 | 35.6 |
| T6 | 26.5 | 22.3 | 22.2 | 29.0 |

Agglomerate size distributions for different test conditions obtained from a fitting regression of a power law distribution on the experimental data of Table 3. Dots are the median values and bars cover the 80 % range of distributions between the 10th and 90th percentiles.
Fig. 5a shows a schematic of the uniaxial compression test carried out on the largest agglomerates with the main geometrical variables of the deformed agglomerate during the test as defined in the following text. An example of the trace of the mechanical response of the agglomerates is reported in Fig. 6. The size of the agglomerates, da can be determined from the first contact position at which the forces ramp, corresponding to the start of agglomerate deformation. The force vs. displacement curve is always well represented by a line segment indicating, as it will be discussed later, a plastic deformation regime of the agglomerate.

Uniaxial compression test for agglomerates and contact deformation parameters: a) plastic deformation; b) breakage conditions.

Force vs displacement curve for agglomerate breakage experiments.
The agglomerate rupture is well identified by the peak force. Within the agglomerate deformation regime, the contact deformation, sc, will be assumed to be half of the agglomerate deformation, sa, that is the distance travelled by the compression piston starting from the first contact position. Given the contact deformation at breakage, scb, and the agglomerate deformation at breakage, sab, it is scb = 1/2sab, and assuming a spherical agglomerate shape, it is possible to estimate the contact area Acb at breakage
| (4) |
| (5) |
The force Fb, the relative deformation of the contact, scb/da, the contact area, Ac, and the pressure pfb measured at breakage in the agglomerate breakage tests are reported as a function of the agglomerate diameter in Fig. 7 and Fig. 8 for both calcium carbonate and titanium dioxide, respectively. Data are separated for each of the examined conditions and, correspondingly, a best-fit linear approximation is drawn to highlight possible trends. These figures indicate a clear dependence of both the breakage force (for calcium carbonate only) and also of the contact area at breakage on the agglomerate diameter. If any, only a slight dependence on the agglomerate diameter is evident for the relative deformation and the contact pressure at breakage. Furthermore, it is not possible to identify a clear trend of the vibrations and other aggregation process parameters on the observed results. Some differences can be observed comparing two different materials, in fact, with respect to calcium carbonate, the population of agglomerate tested for titanium dioxide is a bit smaller and, in any case, tends to show a slightly higher breakage force (averages around 0.2 N for CaCO3 and about 0.3 N for TiO2), a slightly smaller relative deformation at breakage (averages around 0.025 for CaCO3 and less than 0.020 for TiO2), correspondingly a slightly lower contact area at breakage (averages around 0.4 mm2 for CaCO3 and 0.2 mm2 for TiO2) and significantly higher pressures at breakage (averages less than 40 kPa for CaCO3 and around 100 kPa for TiO2).

Force (a), relative deformation of the contact (b), contact area (c) and pressure (d) measured at breakage test for the aggregates as a function of the aggregate diameter for Calcium Carbonate. Test conditions for data points: ●, C1; ■, C2; ▲, C3; ◆, C4. Test conditions for regression lines: ——, C1; — —, C2; – · –, C3; – · · –, C4.

Force (a), relative deformation of the contact (b), contact area (c) and pressure (d) measured at breakage test for the aggregates as a function of the aggregate diameter for Titanium dioxide. Test conditions for data points: ●, T1; ■, T2; ▲, T3; ◆, T4; ○, T5; □, T6. Test conditions for regression lines: ——, T1; — —, T2; – · –, T3; – · · –, T4; . . . . . ., T5; – – –, T6.
According to Antonyuk S. et al. (2006), a spherical agglomerate compressed against a flat surface will deform and a force will set in between the agglomerate and the surface. This force expression will depend upon the regime of deformation which might be elastic, elastic-plastic or completely plastic. In the presence of an elastic component, the agglomerate deformation will follow a Hertzian law of deformation that reveals an upward concavity in the force-displacement curve. Instead, a purely plastic deformation can be hypothesized in the case of a perfectly linear plastic relationship between the contact deformation and the force. In fact, this is the case in almost all our tests, as is shown in the force vs. displacement curve of Fig. 6. The simple Eqn. 6 is used in this case:
| (6) |
| (7) |
According to the theoretical works of Hencky H. (1923) and Ishlinsky A.J. (1944) as reported by Molerus O. (1975), pf can be approximated to three times the material unconfined yield strength. In the present case of agglomerates we have:
| (8) |
We assumed that the agglomerate grows by hitting some powder laying on other agglomerates or on the vibrating column surface. Accordingly, the material will consolidate on the agglomerate with subsequent hits in which the consolidation stress σ1 is equal or smaller than the material strength pf. The resulting consequence of this assumption and Eqn. 8 is that the flow factor at which the material consolidates is:
| (9) |
The agglomerate breakage phenomenon has been widely discussed by Antonyuk S. et al. (2005). In particular, it has been highlighted that the agglomerate under plastic deformation breaks because the plasticized nucleus radially expands to the yield of the equatorial band of the particles. Fig. 3b shows the mechanism. A rough evaluation of the breakage conditions can be carried out as follows. According to Fig. 5b, we assume an inner cylinder of material completely plasticized and characterized by a diameter of 2(dasc)0.5 and a height of da−2sc≈da. The material in this cylinder pushes radially outwards with a pressure Kpf, where K is the material vertical to the horizontal stress ratio. Eqn. 2 is valid within the Mohr-Coulomb assumption. The outward pressure of the inner material is balanced by the strength of the material in the unplasticized external toroid. A force balance allows calculation of the collapse condition of this band that occurs when the tangential stress equals the material’s unconfined yield strength:
| (10) |
| (11) |
| (12) |
| (13) |
| (14) |
That is
| (15) |
It appears that the agglomerate deformation at breakage expressed by Eqn. 14 should be a function only of the material properties. The values predicted for the deformation at breakage for the two materials are reported in Table 2. It can be verified that also the theory predicts a result that is independent of the vibration parameters and of the agglomerate diameter as roughly suggested by Figs. 7b and 8b. Furthermore, in agreement with the experiments, the theory predicts a smaller deformation at breakage for titanium dioxide than for calcium carbonate.
The process of agglomerate formation by means of mechanical vibrations was studied by means of agglomerate size distributions and uniaxial compression tests on agglomerate deformation and resistance. Results indicate the formation of wide agglomerates’ size distributions and hard and compact agglomerates.
Considering the experimental results and the interpretation of data, it is suggested that in order to produce agglomerates with this mechanism, powders should have flow functions close or smaller than a flow factor value of 3. The same analysis suggests that agglomerates’ consolidation pressures and deformation at breakage is almost independent of the agglomerate diameter and of the vibration conditions.
a
acceleration due to vibration (m s−2)
Avibration amplitude (m)
Accontact area (mm2)
Acbcontact area at breakage (mm2)
Atcross-section of the unplasticized toroid (mm2)
Dmold diameter (mm)
daagglomerate diameter (mm)
dpparticle diameter (μm)
foscillation frequency (s−1)
Fbforce measured at breakage (N)
Fplforce measured in the agglomerate plastic deformation range (N)
fcunconfined yield strength (Pa)
FFflow factor (−)
gacceleration due to gravity (m s−2)
IDinternal diameter (mm)
Kvertical to horizontal stress ratio (−)
pbaverage pressure at the contact at agglomerate breakage (kPa)
pfthe material strength at the agglomerate contact point (kPa)
pfbpressure measured at breakage at the agglomerate contact point (kPa)
saagglomerate deformation (mm)
sabagglomerate deformation at breakage (mm)
sccontact deformation (mm)
scbcontact deformation at breakage (mm)
Zfinal sample height after consolidation (mm)
ρbaverage bed density (kg m−3)
ρpparticle density (kg m−3)
σnormal stress (Pa)
σ0applied normal stress on the sample surface in the uniaxial tester (Pa)
σ1major principal stress at consolidation (Pa)
σttensile strength, Pa
ϕangle of internal friction (Deg)
ϕeeffective angle of internal friction (Deg)
ϕwangle of wall friction (Deg)
μwmold wall friction (−)
ωvibration pulsation (s−1)
Hamid Salehi Kahrizsangi
;%0A%09%09%09newWindow.document.open();%0A%09%09%09newWindow.document.write('<img src=%22./Graphics/33_2016011_9.jpg%22>');%0A%09%09%09newWindow.document.close();%0A%09%09)
Hamid Salehi Kahrizsangi is a PhD student at the Department of Industrial Engineering, University of Salerno, Italy. He graduated from Lund University, Lund, Sweden, as a food engineer specialized in powder technology in 2012.
Diego Barletta
;%0A%09%09%09newWindow.document.open();%0A%09%09%09newWindow.document.write('<img src=%22./Graphics/33_2016011_10.jpg%22>');%0A%09%09%09newWindow.document.close();%0A%09%09)
Diego Barletta is assistant professor of chemical engineering at the Faculty of Engineering of the University of Salerno. His research interests include powder flow from storage units, rheology of powders and biomass particulate solids, fluidization of cohesive powders assisted by vibrations and process systems engineering for renewable energy. He is the author of more 30 papers on refereed international journals and books on chemical engineering and of more than 50 papers for international conferences. He reviews papers for international journals and conferences on chemical engineering and powder technology.
Massimo Poletto
;%0A%09%09%09newWindow.document.open();%0A%09%09%09newWindow.document.write('<img src=%22./Graphics/33_2016011_11.jpg%22>');%0A%09%09%09newWindow.document.close();%0A%09%09)
Massimo Poletto is professor of chemical engineering since December 2012 at the Department of Industrial Engineering. Since January 2011, he has served as the chairman of the degree programme board of chemical and food engineering. In the period 2008–2013, he served as the chairman of a working party of the European Federation of Chemical Engineering (EFCE) on “Mechanics of Particulate Solids” that he joined in 2004 as a delegate from the Italian Association of Chemical Engineering (AIDIC). He is a member of the editorial board of Chemical Engineering Research and Design, the official journal of IChemE and of EFCE. (ChERD, www.icheme.org/journals).