Abstract
It has been well known that mineral samples from different locations and origins can exhibit a significant shift in their properties and behavior. The present study of three samples of kaolin from a wide set of origin of deposits, composition, and ceramic properties, provided an important and perhaps a unique opportunity for investigating the interdependence of mineralogy, chemical composition, particle morphology, and surface property with their rheological behavior in ceramic applications such as casting rate. The X-ray diffraction patterns of kaolin samples #2 and #3 suggested low crystallinity with Hinckley Index (HI) ranging between 0.78 and 0.8. On the other hand, kaolin sample #1 was highly ordered with HI of about 1.21, and it had higher quartz content. This free quartz could enhance the permeability and hence increase the casting rate. The abundance of divalent ions (Ca2+ and Mg2+) in samples #2 & #3 could result in the collapse of the electrical double layer and reduction of zeta potential, consequently, coagulation of the particles leading to an increase of viscosity and dispersant demands. The morphology study suggested the platelet particles in samples #2 & #3 would lead to slower dewatering, thus, lower casting rate than that of the blocky (lower aspect ratio and narrower size distribution) particles in sample #1.
1. Introduction
Kaolin has a global market with an estimated value of 5.42 billion USD in 2018 (Kumar S., 2019). The market size is expected to grow continuously due to the increasing demand of ceramic products in a wide variety of applications (Dondi M. et al., 2008), such as whiteware (Sanz A. et al., 2018), paper (Frías M. et al., 2015), construction (Heah C. et al., 2011), paint (Ahmed N.M., 2013), drilling fluid (Au P.-I. and Leong Y.-K., 2013), etc. Furthermore, kaolin has great potential to be tailored for more innovative products including rapid-casting clays, engineered paper with kaolin coating, and nanocomposites (Dondi M. et al., 2003; Murray H.H., 2000). These advanced applications require more in-depth knowledge of the structure-property-behavior relationship of kaolin, which is not fully understood. In fact, it is difficult to comprehend the complexity because kaolin samples exhibit different particle size, size distribution, shape, chemical composition, surface chemistry and charge due to their diverse geological conditions and processing parameters.
The main scope of the present study is to investigate the kaolin properties that impact the rheological behavior. The key characteristics of the kaolin samples include mineralogy, the degree of kaolin crystallinity, chemistry, morphology, particle size, size distribution, shape and shape distribution, surface chemistry, interfacial properties, and the interaction with various deflocculants or dispersants.
2. Materials and methods
2.1 Materials
Three kaolin samples #1, #2, and #3 were carefully selected. Sample #1 was coarse-grained kaolin that had been engineered to achieve improved casting rate. This kaolin is currently commercialized by an American kaolin producer. The original geological source of the primary kaolin was from Georgia (USA). Sample #2 was wet-processed kaolin from Colombia, South America. The raw material for this sample was primary kaolin. Wet processing of this raw material resulted in a kaolin slurry which, in turn, was filter pressed to obtain the kaolin represented by Sample #2. Sample #3 was produced from the mechanical processing of Sample #2.
2.2 Methods
X-ray diffraction (XRD). The phase of each kaolin sample, as well as the crystallinity, was characterized using Panalytical X’Pert Powder with a 1400 W Cu X-ray tube.
Thermal gravimetric analysis (TGA). The weight loss due to dehydroxylation, phase transition, or thermal decomposition of each kaolin sample was measured and analyzed using TGA/SDTA851e.
Scanning electron microscopy (SEM). The texture, particle morphology of the kaolin sample was analyzed using the micrographs obtained by Hitachi S3000 SEM.
The zeta potential of kaolin particles was measured using Zeta Reader Mark 21.
The casting rate was measured following the protocol described by Eygi et al. (Eygi M.S. and Ateşok G., 2008)
3. Results and discussion
3.1 Mineralogical composition
The X-ray diffraction patterns of the three kaolin samples are illustrated in Fig. 1. Samples #2 and #3 were observed to be disordered and poorly crystalline and contained traces of quartz and very sparse mica (illite). Their Hinckley Index (HI)—a measure of crystallinity of kaolin ranged between 0.78 and 0.8. Kaolin was indicated by its characteristic reflection peaks at 7.14 Å (001), and 3.56 Å (002), quartz (SiO2) at 3.33 Å and illite at 10 Å.
Sample #1 was highly ordered with HI of almost 1.21 and characteristic peaks at 7.14 Å (001) and 3.56 Å (002), which suggested higher quartz content compared with samples #2 and #3.
The measurement of HI (degree of crystallinity of kaolin) is shown in Fig. 2 using the range of 2θ 19–22° of kaolin samples. The calculated I (020)/I (1Í0) ratios of studied kaolin samples were 0.63, 1.09 and 1.10 for samples #1, #2, and #3, respectively. The smaller the value, the higher the crystallographic order of kaolin (Qiu X. et al., 2014). The average flake thickness of kaolin along the c-axis was calculated using the Debye-Scherrer equation,

in which L is the crystallite size; K is the Scherrer constant that depends on the shape and size distribution of the crystal; λ is the wavelength of incident X-ray; β is the full width at half maximum (FWHM); θ is the Bragg angle. The estimation of crystal size using FWHM of (001) peak is shown in Fig. 3. Table 1 summarizes the calculated results of kaolin samples from XRD patterns. According to the FWHM (001) data of the three kaolin samples, the average flake thickness along the c-axis of samples #1, #2, and #3 were 517 Å, 160 Å, and 152 Å, respectively (as shown in Table 1). It was evident that sample #1 had thicker flakes than samples #2 and #3, which is supported by the SEM images.
Table 1
Calculated results of kaolin samples.
|
Sample #1 |
Sample #2 |
Sample #3 |
| HI |
1.21 |
0.80 |
0.76 |
| I(020)/I(1Í0) |
0.63 |
1.09 |
1.10 |
| FWHM (001) |
0.151° |
0.334° |
0.32° |
| Crystallite Size |
517 Å |
160 Å |
152 Å |
| Number of Unit Layer |
76 |
28 |
32 |
From the XRD patterns of kaolin samples, it was clear that sample #1 was highly ordered kaolinite with HI of 1.21 and average flake thickness along the c-axis of 517 Å; while kaolin samples #2 and #3 had HI of 0.8–0.76 and an average flake thickness along the c-axis of 152–160 Å, respectively. Moreover, the narrow and sharp (001) diffraction peak with an FWHM of 0.15° was characteristic of sample #1. Whereas the FWHM (001) of samples #2 and #3 was about 0.33°. Poor crystallinity of samples #2 and #3 kaolin resulted in irregular morphology and subsequently in poor rheological behavior.
3.2 Thermal gravimetric analysis (TGA)
3.2.1 Low-temperate endothermic region
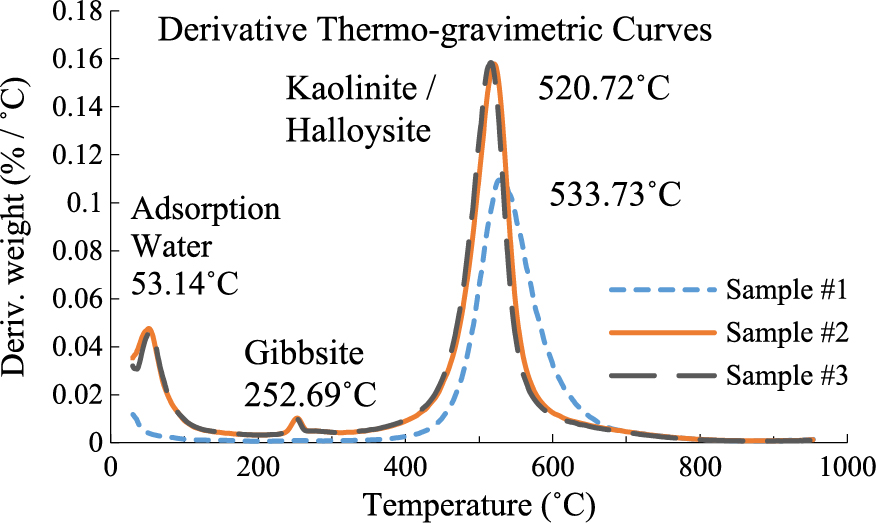
The peak observed in TGA curves of samples #2 and #3 at 53 °C could be due to dehydration of poorly crystallized kaolin (#2 and #3) or due to the loss of adsorbed water (Δm = 2.211%). It could also be due to the trace of hydrated halloysite (its characteristic peak at 10 Å overlapped with illite peak).
However, low-temperature endothermic peak at 252 °C in DTA curves of samples #2 and #3 could be attributed to amorphous materials–goethite FeO(OH) or gibbsite Al(OH)3 (Δm = 0.941%). Samples #2 and #3 seemed to be stained with iron. Also Fe2O3 content of these samples was higher than in sample #1. Generally, highly crystalline goethite is known to produce a maximum at 280 °C. However, low crystalline goethite is known to produce a peak at 250 °C in TGA curves (Fig. 4 and 5).
Additionally, sample #1 had shallow losses below 200 °C (Δm = 0.585%) as compared to samples #2 and # 3. This could be the result of a reasonable degree of crystallinity, in the case of sample #1, whereas the weight losses observed in the other samples could be attributed to the presence of less ordered kaolinite, halloysite and/or amorphous materials.
3.2.2 Medium-temperature–endothermic region
The DTA curve for kaolinite showed an endothermic peak in the range 400–600 °C due to the dehydroxylation of samples #2 and #3. These peaks were associated with a weight loss of 11 % contaminated kaolinite (Fig. 6). In the case of sample #1 kaolin, the dehydroxylation peak temperature ranged between 440–700°C and a 9.6 % weight loss. The dehydroxylation of sample #1 compared with that of samples #2 and #3 could be attributed to the difference in the degree of crystallinity as well as the degree of substitution of Al in the octahedral sheet by Fe in various samples. Low degree of crystallinity and the relatively higher degree of structurally substituted Fe caused a low dehydroxylation temperature of samples #2 and #3. Sample #1 was distinguished mainly by the decrease in peak intensity around 530 °C indicating lower kaolinite content. Also, the peak was broader and more curved to the right for samples #2 and #3. These characteristics could be attributed to the higher thickness of the crystals and/or the higher degree of crystallinity.

The main difference was observed at the exothermic peak around 1000 °C (Fig. 4). This peak was wider and less pronounced in samples #2 and # 3 than that for Sample #1. Besides, it developed at a temperature of 10–15 °C lower than for Sample #1. One possible explanation for this difference in DTA behavior would be a higher degree of crystallinity and, eventually, a larger crystallite thickness for Sample #1 in comparison to samples #2 and #3. The dehydroxylation of kaolinite occurred between 600–700 °C along with the formation of metakaolin. The phase was further transformed into either γ-alumina or aluminum-silicon spinel with the presence of amorphous silica.
The major loss in mass was observed in the temperature range from 400 to 900 °C indicated by an endothermic peak in Fig. 4. The total mass loss observed on the TG curve was 11.035 % for sample #1 (Fig. 6). DTG and DTA curves of sample #1 showed that the temperature at the maximum mass loss was 533 °C. On the other hand, the mass loss of samples #2 and #3 was 12.3455 % that occurred at 520 °C. The mass loss for samples #2 and #3 was higher compared with that of sample #1 and could be correlated to the higher percentage of kaolin in samples #2 and #3 (90.18 %) as compared to 80.5 % for sample #1. The metakaolin was a disordered layer structure with some hydroxyls present (1/8) and probably had the same Al/Si as kaolinite plus the vapor phase which was considered to be pure H2O (Roy R. et al., 1955). Metakaolin eventually becomes amorphous with additional heating (Brindley G. and Nakahira M., 1959).
The conversion of quartz during the calcination of kaolin was masked by the big and very broad dehydroxylation peak of clay minerals generally within the same temperature range. So, the calculation of quartz and illite associated with kaolin of studied samples should be based on XRD patterns.
3.3 Phase and chemical analysis
The chemical analysis of the investigated samples given in Tables 2 & 3 agreed with the mineralogical composition of the samples determined by the X-ray diffraction (Figs. 1–3) and DTA-TG (Figs. 4–6) analysis, as well as confirmed by the SEM micrographs (Figs. 9–11). Based on the normal weight loss at 400–700 °C corresponding to dehydroxylation of kaolinite, the kaolin/halloysite content ranged between 78–80 % for sample #1 as compared with 87–89 % for samples #2 and # 3. The higher quartz and illite content in sample #1 may explain the lower content of kaolin in sample #1.
Table 2
Chemical composition of kaolin samples.
| Component (%) |
Sample #1 |
Sample #2 |
Sample #3 |
| SiO2 |
52.9 |
45.8 |
45.6 |
| Al2O3 |
33.1 |
37.0 |
36.8 |
| Fe2O3 |
1.20 |
2.17 |
2.18 |
| TiO2 |
0.37 |
0.58 |
0.58 |
| CaO |
0.00 |
0.02 |
0.01 |
| MgO |
0.07 |
0.15 |
0.16 |
| Na2O |
N.D |
N.D |
N.D |
| K2O |
0.74 |
0.47 |
0.46 |
| BaO |
0.01 |
<0.01 |
0.01 |
| P2O5 |
0.01 |
0.01 |
0.01 |
| MnO |
0.02 |
0.02 |
0.03 |
| SO3 |
N.D |
N.D |
0.001 |
| PPI de 110 °C a 1000 °C |
11.7 |
13.9 |
14.2 |
Table 3
Mineralogical composition of kaolin samples.
| Minerals |
% (Semi-Quantification) |
| Sample #1 |
Sample #2 |
Sample #3 |
| Quartz (Qz) |
10–12 |
1–3 |
1–3 |
| Mica/Illite |
7–9 |
4–6 |
4–6 |
| Gibbsite (G) |
N.I. |
1–2 |
1–2 |
| Kaolinite/Halloysite |
78–80 |
87–89 |
87–89 |
| Others (Fe, Ti oxides/Fe hydroxides) |
< 1 |
1–2 |
1–2 |
On the other hand, samples #2 and #3 had higher Fe2O3, TiO2, CaO, MgO compared with sample #1. Generally, Fe could be located in two forms: 1) Fe- substitution in octahedral and tetrahedral sheets of kaolin, or 2) as amorphous iron (staining iron). Also, the Fe had a significant influence on the rheological properties of kaolin. High K2O% in sample #1 compared with the other two samples revealed the presence of mica mineral. Illite impurity was indicated in XRD patterns of kaolin.
The presence of divalent ion in terms of Mg followed by Ca in abundance in samples #2 and #3 kaolin could result in the compression of the electrical double layer resulting in the lower zeta potential of these samples. Low zeta potential would result in higher interaction between clay particles and an increase of viscosity and finally, the flocculation of clay particles.
3.4 Zeta potential
The zeta potential of the three kaolin samples was measured at specific pH to obtain the isoelectric point (IEP) as plotted in Fig. 7. The IEP of all three samples were interpolated to be 3~4, which agreed with the literature values (Au P.-I. and Leong Y.-K., 2016). Sample #1 exhibited a slightly higher isoelectric point as compared to samples #2 & #3. This could affect the interaction between clay particles in aqueous suspension, thereby influencing their flocculation properties.
3.5 Physical properties
3.5.1 Particle sizes and size distribution
The particle size distribution of the three samples is summarized in Table 4, which did not reveal any significant differences.
Table 4
Physical properties of kaolin samples.
| Sample |
#1 |
#2 |
#3 |
| SSA (m2/g) |
8.5 |
26.3 |
24 |
| MBI (meq/100g) |
1.6 |
7.1 |
6.7 |
| DV 10 (μm) |
0.37 |
0.35 |
0.35 |
| DV 50 (μm) |
2.3 |
2.21 |
3.57 |
| DV 90 (μm) |
15.67 |
11.34 |
13.06 |
| % Coarse (100–9.21) μm |
18.8 |
15.1 |
20.2 |
| % Medium (9.21–0.96) μm |
50.8 |
48.8 |
55.4 |
| % Fine (0.96) μm |
30.4 |
36.1 |
24.4 |
The higher SSA and CEC (methylene blue index, MBI) of samples #2 and #3 could be attributed to the imperfectly stacked poorly crystallized kaolin with a lot of curly, rough and eroded edges compared to sample #1 (well-crystallized books of kaolin). High CEC of samples #2 and #3 using MBI could be attributed to the exposure of more charged sites for the exchange to occur. The SSA and CEC of kaolin appeared to increase with a lower degree of crystallinity as refer to Table 4.
3.5.3 Morphological Analysis
SEM micrographs (Figs. 8 –10) revealed the morphological characteristic of kaolin samples.
Kaolin sample #1 had revealed more regular pseudo-hexagonal edges smooth surface, thicker flakes, and smaller diameter to thickness ratio (Fig. 8). During the grinding process, these particles tended to become more rounded, resulting in better packing. This blocky morphology could have enhanced the dewatering and casting rate of sample #1.
The morphology of samples #2 and #3 (Figs. 9–10) was different from sample #1. This morphology revealed the poorly crystalline structure of these samples. The platelets had curly, rough, highly eroded edges with high aspect ratios. The eroded edges revealed the partial dissolution of this kaolin and explained the presence of amorphous materials that covered the platelets. These surface defects were strongly associated with the adsorption characteristic of this kaolin. The packing of plate-like particles (samples #2 & #3) could result in a lower casting rate of the samples than that of the sample with blocky particles (lower aspect ratio). The densely-packed platelets of samples #2 and #3 would lie flat in the casting mold, thereby slowing down the dewatering process.
3.6 Slip casting performance
The present investigation offered a good opportunity to study the property-performance relationship of kaolin. It was observed that the slip casting rate of kaolin sample #1 was significantly higher as compared to samples #2 & #3 (Fig. 11) in which the particles were more platy (higher aspect ratio) and exhibited lower crystallinity. The low casting rate of kaolin samples #2 & #3 also could be attributed to the high slip viscosity and the abundant divalent cations. For these reasons, kaolin samples #2 & #3 were less suitable for most of the traditional applications unless they are further treated or modified specifically.
4. Conclusions
Three kaolin samples from different geological origins were characterized and the relationship between their properties and slip casting performance was studied. Overall, it was found that kaolin sample #1 exhibited a significantly higher slip casting rate than the other two samples. Characterization showed that kaolin sample #1 had the highest crystallinity among the three samples studied, and its particles exhibited the most globular shape as compared to the other samples. The globular shape of the particles could be one of the key elements that were beneficial to the dewatering process leading to faster slip casting. The thermal gravimetric analysis confirmed that kaolin sample #1 exhibited less weight loss in low to medium temperature endothermic regions than the other two samples. It could be due to less moisture content of sample #1 and thus less dehydroxylation due to a higher degree of crystallinity. Nevertheless, further investigation is needed to fully understand the complex nature of different kaolins and their rheological behavior.
Acknowledgments
The authors acknowledge the financial support from the Center for Particulate and Surfactant Systems (CPaSS) at the University of Florida, National Science Foundation (NSF Grant No. 1362060) and the industrial partners of CPaSS. Any opinions, findings and conclusions or recommendations expressed in this material are those of the author(s) and do not necessarily reflect the views of the National Science Foundation/Sponsors.
References
- Ahmed N.M., Comparative study on the role of kaolin, calcined kaolin and chemically treated kaolin in alkyd-based paints for protection of steel, Pigment & Resin Technology, 42 (2013) 3–14. DOI: 10.1108/03699421311288715
- Au P.-I., Leong Y.-K., Rheological and zeta potential behavior of kaolin and bentonite composite slurries, Colloids and Surfaces A: Physicochemical and Engineering Aspects, 436 (2013) 530–541. DOI: 10.1016/j.colsurfa.2013.06.039
- Au P.-I., Leong Y.-K., Surface chemistry and rheology of slurries of kaolinite and montmorillonite from different sources, KONA Powder and Particle Journal, 33 (2016) 17–32. DOI: 10.14356/kona.2016007
- Brindley G., Nakahira M., The kaolinite—mullite reaction series: I, a survey of outstanding problems, Journal of the American Ceramic Society, 42 (1959) 311–314. DOI: 10.1111/j.1151-2916.1959.tb14314.x
- Dondi M., Guarini G., Raimondo M., Salucci F., Influence of mineralogy and particle size on the technological properties of ball clays for porcelainized stoneware tiles, Tile and Brick International, 19 (2003) 76–85.
- Dondi M., Iglesias C., Dominguez E., Guarini G., Raimondo M., The effect of kaolin properties on their behaviour in ceramic processing as illustrated by a range of kaolins from the Santa Cruz and Chubut Provinces, Patagonia (Argentina), Applied Clay Science, 40 (2008) 143–158. DOI: 10.1016/j.clay.2007.07.003
- Eygi M.S., Ateşok G., An investigation on utilization of poly-electrolytes as dispersant for kaolin slurry and its slip casting properties, Ceramics International, 34 (2008) 1903–1908. DOI: 10.1016/j.ceramint.2007.07.012
- Frías M., Rodríguez O., De Rojas M.S., Paper sludge, an environmentally sound alternative source of MK-based cementitious materials. A review, Construction and Building Materials, 74 (2015) 37–48. DOI: 10.1016/j.conbuildmat.2014.10.007
- Heah C., Kamarudin H., Al Bakri A.M., Luqman M., Nizar I.K., Liew Y.M., Potential application of kaolin without calcine as greener concrete: A review, Australian Journal of Basic and Applied Sciences, 5 (2011) 1026–1035.
- Kumar S., “Kaolin Market Size, Share & Trends Analysis Report By Application (Ceramics, Plastic, Pharmaceuticals & Medical, Paint & Coatings, Cosmetics, Fiber Glass, Paper, Rubber), by Region, and Segment Forecasts, 2019–2025”, Research and Market, 2019.
- Murray H.H., Traditional and new applications for kaolin, smectite, and palygorskite: A general overview, Applied Clay Science, 17 (2000) 207–221. DOI: 10.1016/S0169-1317(00)00016-8
- Qiu X., Lei X., Alshameri A., Wang H., Yan C., Comparison of the physicochemical properties and mineralogy of Chinese (Beihai) and Brazilian kaolin, Ceramics International, 40 (2014) 5397–5405. DOI: 10.1016/j.ceramint.2013.10.121
- Roy R., Roy D.M., Francis E.E., New data on thermal decomposition of kaolinite and halloysite, Journal of the American Ceramic Society, 38 (1955) 198–205. DOI: 10.1111/j.1151-2916.1955.tb14929.x
- Sanz A., Bastida J., Caballero A., Kojdecki M., X-ray diffraction Warren–Averbach mullite analysis in whiteware porcelains: influence of kaolin raw material, Clay Minerals, 53 (2018) 471–485. DOI: 10.1180/clm.2018.34
Authors’ Short Biographies
Mervat Said Hassan Badr

Dr. Mervat S. Hassan Badr is a retired Professor and Head of Ore Evaluation Laboratory at the Central Metallurgical Research and Development Institute (CMRDI), Cairo, Egypt. Dr. Hassan has expertise in the field of applied mineralogy and rheology, specifically synthesis, modification, and characterization of clay minerals and advanced ceramic materials. She has done extensive work on the clay minerals for environmental and agricultural applications, as well as for advanced paper and drilling industries.
Shuaishuai Yuan

Shuaishuai Yuan is currently a Ph.D. candidate at McGill University, Canada. She received her B.Eng. in Materials Science and Engineering from Jiangsu University, China in 2014, and M.S. degree in Materials Science and Engineering from the University of Florida, USA in 2016. During May 2015–April 2016, she worked under the supervision of Prof. Brij Moudgil and Dr. Parvesh Sharma at the Center for Particulate and Surfactant Systems (CPaSS), UF focusing on engineering functionalized clay particles for value-added products.
Jiaqi Dong

Jiaqi Dong received his B.S. in Materials Science and Engineering from Illinois Institute of Technology in 2013. He then attended University of Florida as a graduate student and received his M.S. in Materials Science and Engineering in 2016. Currently, he is a Ph.D. candidate under the supervision of Dr. Brij Moudgil and Dr. Bahar Basim at the Center for Particulate and Surfactant Systems (CPaSS). His current research focus is metallic nanoparticle synthesis and functionalization using fluidics.
Hassan El-Shall

Dr. Hassan El-Shall was a Professor Emeritus, until his passing away in 2017, at the Department of Materials Science and Engineering, University of Florida. He had been serving as Associate Director for Research at the Particle Engineering Research Center, since 1994. He also served as Associate Director at the Florida Institute of Phosphate Research from 1986–1992. Dr. El-Shall possessed 39 years of diverse experience in research, teaching, management and industry experience in the areas of applied surface and colloid chemistry, mineral processing, chemical and engineering. Dr. El-Shall had published over 165 technical papers in prestigious journals including Powder Technology, Mineral and Metallurgical Processing, and Journal of Mineral Processing.
Yamile A. Bermudez

Yamile A. Bermudez studied chemical engineering at Antioquia University, Colombia and received her M. Sc. in Materials and Processes from the National University of Colombia. She joined Sumicol S.A.S., one of the companies of the Corona Ceramic Group in Colombia in 2006 as a lab technician and was promoted to R&D engineer in 2010. After spending eight years in this position, she was transferred to the sanitary ware division of Corona, where she is currently a process engineer in charge of technical aspects of sanitary ware production.
Diana C. Ortega

Dr. Diana C. Ortega studied geology at EAFIT University, Medellín, Colombia and received her M.Sc. in Minerals Engineering from Camborne School of Mines, UK and her Ph. D. in Materials Science and Engineering from the National University of Colombia. Diana joined Sumicol S.A.S., an industrial minerals producer, in 1993 as a researcher in industrial minerals applications and has been with Sumicol since then. She is currently head of the recently created Minerals Technical Center at Sumicol S.A.S. and director of IDIMAP, Industrial Research Group on Materials Design from Minerals and Processes.
Jorge E. Lopez-Rendon

Jorge E. Lopez-Rendon studied Geology at the Mining Faculty, National University of Colombia. Then he joined Sumicol S.A.S., an industrial minerals producer and spent a ten-year period as an exploration geologist and head of the minerals research lab, after which time he founded the Geology Department of EAFIT University and was there for ten years as Director and researcher. Subsequently, he came back to Sumicol as Manager of the R&D Division and was in charge of several industrial minerals processing and industrial application projects for fifteen years. He currently is a consultant in industrial minerals for Sumicol and other companies.
Brij M. Moudgil

Dr. Brij M. Moudgil is a Distinguished Professor of Materials Science and Engineering at the University of Florida. He received his B.E from the Indian Institute of Science, Bangalore, India and his M.S and Eng.Sc.D degrees from Columbia University, New York. His current research interests are in surfactant and polymer adsorption, dispersion and aggregation of fine particles, adhesion and removal of microbes from surfaces, synthesis of functionalized nanoparticles, antiscaling and surfactant mediated corrosion inhibitors, photocatalytic degradation of hazardous microbes, and nanotoxicity. He has published more than 400 technical papers and has been awarded over 25 patents. He is a member of the U.S National Academy of Engineering.
 https://ror.org/02y3ad647


;%0A%09%09%09newWindow.document.open();%0A%09%09%09newWindow.document.write('<img src=%22./Graphics/38_2021002_12.jpg%22>');%0A%09%09%09newWindow.document.close();%0A%09%09)
;%0A%09%09%09newWindow.document.open();%0A%09%09%09newWindow.document.write('<img src=%22./Graphics/38_2021002_13.jpg%22>');%0A%09%09%09newWindow.document.close();%0A%09%09)
;%0A%09%09%09newWindow.document.open();%0A%09%09%09newWindow.document.write('<img src=%22./Graphics/38_2021002_14.jpg%22>');%0A%09%09%09newWindow.document.close();%0A%09%09)
;%0A%09%09%09newWindow.document.open();%0A%09%09%09newWindow.document.write('<img src=%22./Graphics/38_2021002_15.jpg%22>');%0A%09%09%09newWindow.document.close();%0A%09%09)
;%0A%09%09%09newWindow.document.open();%0A%09%09%09newWindow.document.write('<img src=%22./Graphics/38_2021002_16.jpg%22>');%0A%09%09%09newWindow.document.close();%0A%09%09)
;%0A%09%09%09newWindow.document.open();%0A%09%09%09newWindow.document.write('<img src=%22./Graphics/38_2021002_17.jpg%22>');%0A%09%09%09newWindow.document.close();%0A%09%09)
;%0A%09%09%09newWindow.document.open();%0A%09%09%09newWindow.document.write('<img src=%22./Graphics/38_2021002_18.jpg%22>');%0A%09%09%09newWindow.document.close();%0A%09%09)
;%0A%09%09%09newWindow.document.open();%0A%09%09%09newWindow.document.write('<img src=%22./Graphics/38_2021002_19.jpg%22>');%0A%09%09%09newWindow.document.close();%0A%09%09)