Abstract
Discrete Element Method (DEM) proved to be an essential tool to optimize the industrial auger dosing process for pharmaceutical powders. During the DEM parameter calibration process of a certain powder, several parameter combinations might lead to a similar bulk response, which could also vary for other bulk responses. Therefore, a methodology is needed in order to narrow down the number of combinations and be at once close to reality representation. In this study, a vertical auger dosing setup is used as a standard calibration device to extract three different bulk responses, i.e., angle of repose, bulk density, and mass flow rate. Simulations using LIGGGHTS software package are performed based on Design of Experiments (DoE) by varying four input factors, i.e., auger speed, particle-particle and particle-wall static friction coefficients, and particle-particle rolling friction coefficient. The successful application of multivariate regression analysis (MVRA) results in predicting the bulk behavior within the studied ranges of parameters. In this regard, clustering the different predicted behaviors of the three responses together allows to dramatically reduce the admissible parameter combinations. Consequently, an optimized set of calibrated DEM parameters is chosen, where the simulation results accurately match the experimental reference data. This simple dynamic calibration tool proves to strongly verify and predict the flowability of free-flowing bulk materials.
1. Introduction
Screw conveyors are utilized extensively in process engineering as mechanisms to transport bulk materials (e.g., granular materials). As the screw rotates, bulk materials are dispensed from the container and conveyed along the screw casing. Although the mechanical system is quite simple, understanding and controlling the material behavior towards an optimal process might be challenging (Moysey and Thompson, 2005; Owen and Cleary, 2009; Roberts, 1999). In fact, several problems might be experienced if the machine is not designed properly in connection with the conveyed material’s nature and mechanical behavior (Clearly, 2007; Owen and Cleary, 2009). These problems can be defined, for instance, as surging and unsteady flow rates, inhomogeneity of the product, inaccurate metering and dosing, product degradation, high start-up torques, excessive power consumption, high equipment wear, variable residence time, and segregation.
1.1 Screw feeding and DEM
Particle simulation is a popular approach to model and predict the behavior of bulk materials involved in different systems. These systems may include several applications such as storing, transporting or processing granular materials, for instance, sand, semolina, pigments, pharmaceutical powders, crystallized products such as ammonium sulfate, fertilizers, polyethylene powder, harvest products or other bulk materials in food, chemical, mining or pharmaceutical industries. In this study, the DEM (Cundall and Strack, 1979) is utilized to model granular flow at the particle level. DEM has proven to be an effective and well-established approach to study stress and motion of particulate systems (Börner et al., 2016). In fact, DEM is applied to simulate particle systems in different industrial applications (Zhu et al., 2008) as e.g., in connection with screw feeding process. In particular, DEM is used to model the behavior of particles flowing in screw feeders in several studies leading to a number of valuable findings (Fernandez et al., 2011; Moysey and Thompson, 2005; Owen and Cleary, 2009). Different responses obtained from DEM modeling of screw conveyor process showed a good agreement with analytical and experimental reference results. These responses include mass flow rate, required screw power, and particle transfer velocity (Owen and Cleary, 2009, 2010; Shimizu and Cundall, 2001). Pezo et al., 2015 studied the influences of screw length and different screw design types on the performance of screw conveyor-mixer during material transport. In this, DEM modeling and experimental validation were performed, where it was shown that the modified screw conveyor geometry leads to better mixing quality.
In order to decrease the computation time in DEM, a scaling-up principle based on coarse-graining method is implemented by increasing the size of particles introduced in the system while maintaining the size of the system geometry (Bierwisch, 2009; Ciantia et al., 2016; Sinnott and Cleary, 2016; Wang et al., 2016). This leads in reducing the computational costs of the DEM simulations. In this, the number of particles is decreased dramatically, i.e., by a scaling factor of S3. It is important to notice that the upscaling should not affect the velocity of the moving geometries and the gravitational acceleration.
1.2 Calibration approaches
Notwithstanding the wide range of applicability of DEM, choosing a set of micromechanical parameters sufficient for representing the macroscopic behavior of granular material lacks always a calibration process. Therefore, many research works can be found in the literature and are dedicated to this aim. The conventional calibration approach is the “trial and error”, where in many cases, one factor is changed at a time to reach a certain relation between the inputs and outputs of the system. A comprehensive review that addressed to the angle of repose (AoR), measurements techniques, suitable applications and the role of several parameters are presented by Al-hashemi and Al-amoudi, 2018. As an assessment for the improvement of DEM calibration approaches, Coetzee, 2017 addressed various calibration approaches, which covered over 25 years of related studies. Roessler et al., 2018 developed a standard calibration scheme for the DEM parameters of free-flowing bulk materials using a modified drawdown test to solve the problem of ambiguity. In a sandpile test, Zhou et al., 2002 investigated the impact of particle-particle as well as of particle-wall coefficients of friction, i.e., static and sliding on the angle of repose. They were able to establish a power-law relationship between the extracted AoR and the input parameters and revealed that all friction coefficients followed a positive dependency, whereas particle size followed an opposite one. Aside from the DEM, other methods, for instance, macroscopic porous media mechanics, can be implemented to obtain the behavior of granular materials on larger scales and realize important behaviors such as fracturing and consolidation (Heider et al., 2018; Obaid et al., 2017; Pillai et al., 2018). However, these methods postulate the continuity of the material and don’t explicitly describe the interactions between the particles. For that reason, our underlying study will focus mainly on the DEM approach.
More efficient approaches are being recently following systematic data analysis such as Design of Experiments (DoE). Based on DoE, El Kassem et al., 2018 calibrated the AoR value of a pharmaceutical powder by varying the coefficients of rolling friction and restitution. In an advanced study, El Kassem et al., 2020 developed a systematic numerical approach, using DoE and multivariate regression analysis (MVRA), to efficiently study the influence of different DEM input parameters on various bulk responses. The statistical prediction model of the AoR and porosity, of free-flowing and cohesive powders, accomplished a good quantitative agreement between DEM simulation and experimental data results. In a roller compaction process application, Souihi et al., 2013 utilized an orthogonal partial least squares (PLS) regression to study the outcomes of a reduced central composite face-centered design in DoE. Yan et al., 2015 employed a parametric multi-level sensitivity approach to analyze the influence of DEM input parameters, namely coefficients of friction and restitution, and Young’s modulus (Y), on AoR and particle flow rate in a discharge system from a flat bottom cylindrical container. Principal component analysis (PCA) is used to weight the contributions and sensitivity of each parameter on the bulk responses. The study showed the significant effect of the coefficient of static friction and the insignificant impact of the particle restitution coefficient and Y. The reduction in Y values showed insignificant impact, where this is complied with (Lommen et al., 2014), in such, decreasing the shear modulus’ value (e.g. from 107 and 1011 Pa) has no influence on the DEM results. Relying on experimental measurements, Johnstone, 2010 applied DoE to perform various calibration and validation techniques.
1.3 Scope of this work
The existence of a large number of parameter combinations outputting the same bulk behavior in simulations is considered a bottleneck for many DEM users. In this study, a novel semi-automated DEM calibration approach that focuses on the ambiguity problem is developed. An auger dosing application is used to output three different bulk responses, namely angle of repose, mass flow rate, and bulk density. Unlike most of the studies involving screw conveying machines, a vertical-oriented micro auger is used in this work to represent an auger dosing process of free-flowing pharmaceutical powder. The objective of this research work is first to perform a parametric study and then to calibrate free-flowing powder using DoE and MVRA. A quadratic D-Optimal design model is used to setup an optimized number of combinations to be simulated. A simulation tool is realized by an open-source software LIGGGHTS® (Kloss et al., 2012), where the simulations were carried out in parallel computing toolbox. An analytical mass flow rate test for dynamic powder discharge using an auger is derived and verified by our DEM simulations and experiments. The auger dosing performance is studied in dependence on auger speed, particle-particle coefficients of static and rolling friction and particle-wall static friction coefficient. Although the coefficient of friction between particles and boundaries is a significant affecting parameter, it is not widely included in the literature. This work extended the scope of previous studies by including this factor into the parametric studies. In this study, the level of effectiveness of these coefficients is investigated to check how they impact four studied responses, i.e., mass flow rate, angle of repose, bulk density, and translational kinetic energy. Meanwhile, as it is almost impossible to measure the energy output on the single-particle scale experimentally, the energy dissipation of the particles is only identified through DEM.
In this work, the DEM parameter combinations are reduced efficiently to reach an almost solitary combination of parameters by superimposing three output prediction contour plots. Calibrations are done based on the bulk behaviors obtained from the experiments and thus the regression analysis model is validated. By this, it is well clarified that using multiple calibration tests lead to more accurate and realistic results and thus reduce the ambiguity. As a result, the simple auger dosing machine can be considered as a standard calibration device for advanced industrial applications.
2. Materials and methods
2.1 Sample description and characterization
In this research work, a pharmaceutical crystalline lactose monohydrate powder, called SpheroLac 100, produced by the German company MEGGLE Wasserburg GmbH & Co. KG was used. It is a typical dry non-cohesive (free-flowing) powder used in different applications, such as in capsule filling, blends, premixes, sachets, and trituration. In the following, methods used to characterize the powder with its particle size, shape and density are discussed. These will be used later on in the setup and analysis of the DEM simulations. The characterization tests were repeated three times to ensure repeatability and accuracy of the results.
2.1.1 Particle size and shape description
Dynamic image analysis of particle size and shape by means of Camsizer XT from Retsch Technology GmbH was performed. It measured the volume moment mean (D[4,3]). The D[4,3] identifies around which central point (center of gravity) of the frequency the volume/mass distribution would rotate. Compared to other particle sizes calculation methods, the above-mentioned method is characterized in such a way that it does not demand the number of particles in its estimation. In addition, the Camsizer XT assists in estimating the particle shape, where the particles are outlined in two-dimensional images in terms of the minimum and maximum Feret diameters (Femin, Femax). In this, Femin and Femax are the length of the minor and of the major axis, respectively. Based on ratio of Femin with respect to Femax one computes the aspect ratio (ASR), where values in the range [0, 1] reflects the elongation of a particle and, thus, the deviation from a spherical shape. In particular, small values represent elongated particles and higher values represent spherical particles.
According to Li et al., 2002, the circularity or roundness (Ro) is a further factor that determines to what degree a particle possesses a spherical shape. This factor is estimated based on the projected area (A) of the particle and the total perimeter of the projection (P) as
2.1.2 Density
The particle (material or true) density (ρp) was determined using the Ultrapyc 1200e, Automatic Density Analyzer from Quantachrome Instruments (USA). In this, a pycnometer measures the material density of the powder samples using an inert helium gas. It measures the volume by applying the principle of Archimedes of displacement and the technique of gas expansion according to Boyle’s law.
2.2 Experimental investigation
2.2.1 Bulk density
In order to visualize the height of the powder bed and compare the DEM simulation with the experiment, a simple test using a transparent glass tube of an inner diameter 24 mm and a total height of 94 mm was utilized. Initially, a mass of 6 g of SpheroLac 100 was filled inside the tube where then the volume was recorded and thus the bulk density (BD) was obtained.
2.2.2 Auger dosing
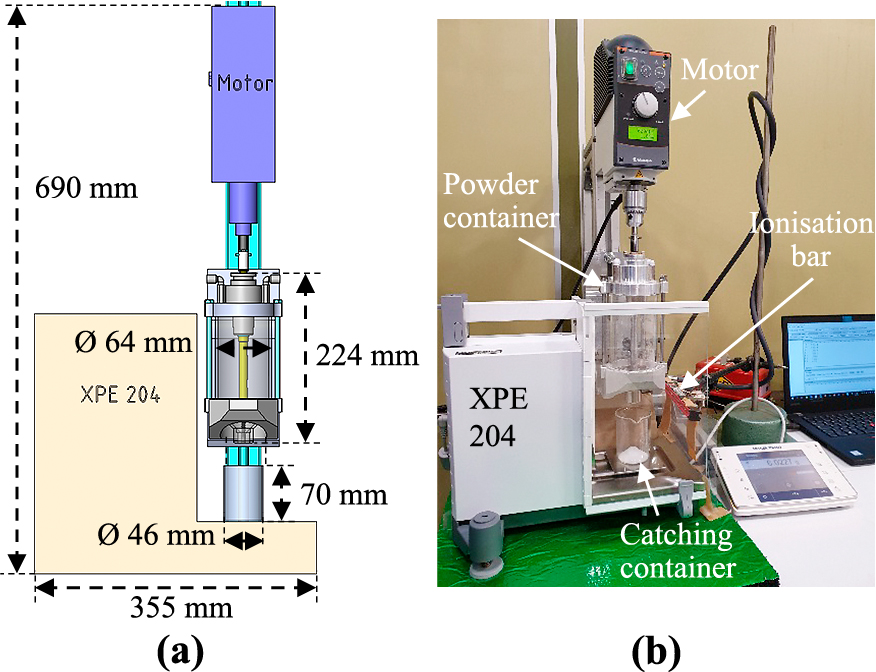
An auger powder container with an inner diameter of 64 mm and a total height of 224 mm was used in running the mass flow rate (m˙) experiments of SpheroLac 100 powder. It consists of a cover, a funnel, an opaque cylindrical glass tube, a shaft connected to a rotational motor, and an auger. The geometry and the dimensions of the auger, including the inner and outer diameters, the pitch and the auger filling volume per 1 revolution, which is used to conduct the experiments, are illustrated in Fig. 1. Theoretically, the auger filling volume represents the maximum volume a material, which could be filled in one complete rotation.

The auger dosing container encloses a stainless-steel funnel (1.4404) with an upper diameter of 63 mm, a lower opening diameter of 6 mm and an inclination angle of 45°. The auger is connected directly to the drive shaft of an overhead stirrer rotating motor RZR 2102 control from Heidolph Instruments (Germany). A laboratory weighing balance XPE 204 from Mettler Toledo (Germany), used as a catch scale, is placed under the outlet of the auger dosing container to record the powder mass flow every 0.2 s. The dosed powders are collected in a container made of borosilicate 3.3 glass (Fig. 2). The XPE 204 is placed on a Regupol sound 17 isolation pad to avoid the transmission of any external vibration into it. The XPE 204 has readability down to 0.1 mg and a capacity up to 220 g. HTerm software is used on a computer to record the values of mass flow over time. In addition, an ionization device Static Line LC is used to neutralize electrostatic charges. The container was placed at a distance of 80 mm from the bottom of the catching container, where, initially, was loosely filled with 6 g of the tested powder.
The volumetric mass flow rate (m˙) is calculated using the difference in mass (Δm) obtained from the XPE 204 divided by the difference in time (Δt) between consecutive weighing balance measurements:
|
m
˙
(
g
/
s
)
=
Δ
m
(
g
)
Δ
t
(
s
)
. | (2) |
To ensure repeatability, the test was repeated three times at three different auger rotational speeds, i.e., 400, 600 and 800 rpm, where an average of the obtained m˙ was considered as an experimental reference value at each speed. After dosing, the formed AoR inside the catching container was measured. The AoR prescribes the slope of a discharged conical heap of loose bulk solid material (Marigo et al., 2014). It represents a cohesiveness characteristic of a powder (Zhou and Qiu, 2010). It is widely a familiar method to characterize powders according to their flowability (Krantz et al., 2009; Lumay et al., 2012). It is frequently applied to calibrate DEM simulation parameters as the angle of the heap formed upon the settlement of the powder depends on the strength of the inter-particulate friction.
2.3 Design of experiment (DoE)
DoE is an efficient optimized tool to design a matrix of experiments (in our case simulations) to be executed and consequently generate a reliable process model. It is mainly used to identify the cause-effect relationship between factors and responses in a studied system or process (Sundararajan, 2018). The DoE methodology was implemented to examine the effects and interactions of DEM input parameters on the output bulk responses. This approach helped in facilitating the DEM calibration procedure. To acquire the maximum quantity of information from the minimal number of simulations, D-Optimal design, based on the least square method (Eriksson et al., 2008), with a quadratic model type, was adopted using Cornerstone 6.1.1.1.
2.4 Multivariate regression analysis (MVRA)
MVRA is a statistical approach used to evaluate the variation of several response variables and hence build a regression model. In the underlying study, this approach was used to examine and interpret the variation and effect of various DEM input parameters on the studied bulk responses. By employing Cornerstone, the collected data values from the experiments are standardized in such a way that the original variables are scaled to have a mean value of of 0 and a variance of 1. The standardization step is initially done since one of the investigated parameters has a different measurement unit than the others. The coefficient of determination (adjusted R2) was used to describe the goodness of fit of the model which in turn represents the proportion of the variability of the data explained by the model. A high level of confidence (±95 %) was considered in the DoE analysis. As a representation of the effect of each input parameter on the studied bulk responses, an adjusted response graph was used. The response values are tuned to average out the effects of the other input parameters. Moreover, a Pareto graph is applied to figure out the relative range of effect of each particular studied DEM input parameters. It shows the orthogonally-scaled effects of the parameter on the studied responses. In particular, applying orthogonal scaling to the values of a parameter αi yields scaled values βi in the range [−1, 1]. This is defined as βi: = (αi − MS)/ RS with MS = (αmax + αmin)/2 and RS = (αmax − αmin)/2, see, e.g., (Triefenbach, 2008). Moreover, a prediction model based on the regression analysis was built, which helped in predicting and figuring out the best-optimized combination between the parameters studied.
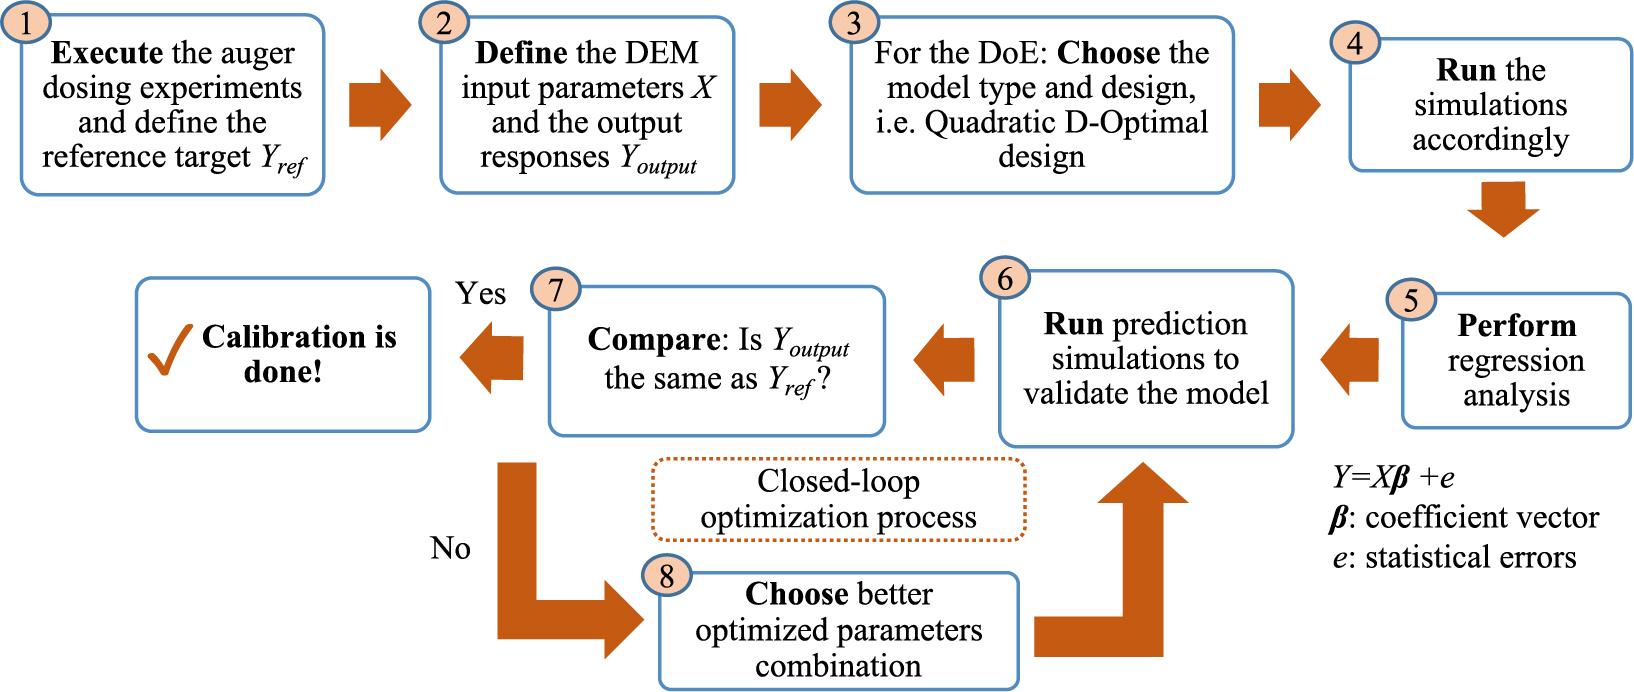
Fig. 3 illustrates the general flowchart followed in the systematic calibration approach. From the auger dosing experiments, the results of the bulk responses to be studied are considered as the reference targets. The DEM input parameters are varied according to DoE design model and studied in the following regression analysis. The prediction model is then used to calibrate the parameters by selecting an optimized parameter combination, where a good fit is obtained between the simulation results and the experimental data.
3. DEM simulations
3.1 Contact models
In our DEM simulations, the particles are considered as rigid bodies, where they have translational and rotational degrees of freedom assigned to their center of mass. In this, particle interactions are modeled using Newton’s equations of motion, contact laws for force and overlap relationships. In this study, the soft-particle approach, originally proposed by Cundall and Strack, 1979 is followed, where the particles are allowed to overlap with each other (small deformation) when coming in contact. Consequently, the elastic and plastic deformations and the frictional forces between the particles can be determined (Zhu et al., 2007). Various interactions, i.e., forces and torques due to gravity, deformations under collisions, and static and rolling frictions might take place as two particles i and j endure contact. In this study, Hertz-Mindlin contact model (Hertz, 1882; Mindlin, 1949) was applied to calculate these resulting forces. Translational and rotational equations of motion of a particle i are expressed by the following equations:
|
m
i
d
v
i
d
t
=
∑
(
F
i
j
n
+
F
i
j
t
)
+
m
i
g
, | (3) |
|
I
i
d
ω
i
d
t
=
∑
(
R
i
×
F
i
j
t
-
τ
i
j
r
)
, | (4) |
where mi, g, Ii, vi and ωi are the mass, gravity vector, moment of inertia, translational velocity and rotational velocity of particle i, respectively. The interplay between two particles i and j at time t results in normal and tangential forces, i.e.
F
i
j
n and
F
i
j
t, respectively. Ri refers to the vector between the particle i center and the contact point, where
F
i
j
t is applied. Moreover,
τ
i
j
r represent the torque resulting from the rolling friction between the two particles.
In this regard, the rolling friction in DEM is utilized as a correction parameter that allows to use spherical particle shapes instead of representing the real shapes of the particles (Iwashita and Oda, 2000; Wensrich and Katterfeld, 2012). To represent the rolling friction in our study, the alternative elastic-plastic spring-dashpot (EPSD2) rolling resistance model was used, which is initially proposed by Ai et al., 2011 and extended by Iwashita and Oda, 2000. The mentioned model is implemented to compute the torque
τ
i
j
,
t
+
Δ
t
r at an incremental time step as
|
∣
τ
i
j
,
t
+
Δ
t
r
∣
≤
μ
r
R
*
∣
F
i
j
n
∣
, | (5) |
where μr is the rolling coefficient and R* is the equivalent radius. In this model, the damping torque is disabled for simplicity.
For the purpose of having a stable integration scheme, the time step (Δt) was set to a value less than 20 % of the critical time step (Rayleigh time, TR). TR is calculated based on the Rayleigh wave propagation, where the elastic wave propagation from one particle to the adjacent contacting particle can be computed according to the following equation (Li et al., 2005).
|
Δ
t
<
T
R
=
π
R
ρ
G
0.1631
v
+
0.8766
. | (6) |
In this, R, ρ, G and ν are the particle’s radius, density, shear modulus and Poisson’s ratio, respectively.
3.2 Simulation procedure and parameters
3.2.1 Simulation setup
The DEM numerical simulations were carried out using LIGGGHTS® -Premium 4.X, which is an open-source software from DCS Computing GmbH (Linz, Austria). They were conducted on an eight-node high-performance cluster that uses 64 CPUs (Intel Xeon 2.60 GHz). The post-processing of the simulations was carried out using the open-access ParaView software, version 5.4.1 64-bit from Kitware Inc. (New York, NY, USA). SolidWorks version Premium 2016 from Dassault Sysèmes (Vélizy-Villacoublay, France) was used to model the 3D CAD parts applied in the DEM simulations. Thereafter, the 3D models were spatially discretized using the open-access Gmsh, version 3.0.6 (Geuzaine and Remacle, 2009).
3.2.2 Simulation conditions and input parameters
The Young’s modulus and Poisson’s ratio values of the funnel and the auger, as they are considered stainless steel, and the catching container (borosilicate 3.3 glass) were selected from the literature (Geuzaine and Remacle, 2009; MakeItFrom, 2019a). Following the recommendations (Govender et al., 2015; Marigo and Stitt, 2015), Young’s modulus for the particle was reduced within a certain permissible limit in order to reduce computational costs. The boundary conditions, like coefficients of restitution and rolling friction between the particle and the walls (stainless steel and glass) were assumed to be constant throughout the simulations. The particle size was scaled-up six times using the coarse-graining method identified by Bierwisch et al., 2009. Table 1 presents the applied DEM input parameters in the auger dosing DEM simulations.
Table 1
The considered DEM input parameters throughout the study.
| Material parameter/contact model |
Symbol |
Unit |
Value |
| Young’s modulus funnel and augera |
YF |
GPa |
200 |
| Young’s modulus catching containerb |
YC |
GPa |
67.8 |
| Young’s modulus particle |
Yp |
GPa |
0.026 |
| Poisson’s ratio funnel and augera |
ν |
|
0.28 |
| Poisson’s ratio catching containerb |
ν |
|
0.21 |
| Poisson’s ratio particle |
ν |
|
0.3 |
| Particle diameter (after coarse-graining) |
dp |
μm |
690 |
| Contact law parameters |
| Coefficient of restitution particle-particle |
epp |
|
0.2 |
| Coefficient of restitution particle-wall |
epw |
|
0.2 |
| Coefficient of rolling friction particle-wall |
μr,pw |
|
0.2 |
| Coefficients of restitution and friction wall-wall |
|
|
0.2 |
| Factory settings |
| Filling mass |
|
g |
6 |
| Number of particles |
|
|
22705 |
| Simulation time step |
|
s |
2.62 × 10⁻⁶ |
| Acceleration due to gravity |
g |
m/s2 |
9.81 |
On the other hand, one process parameter and three-particle properties were varied (Table 2) in the context of the DoE: auger rotational speed (ω), coefficient of static friction (μs,pp) and coefficient of rolling friction (μr,pp) between particle-particle and coefficient of static friction (μs,pw) between particle-wall. Three values were selected for each of the parameter, which include a low, a center, and a high value, see, (Roessler and Katterfeld, 2019; Wilkinson et al., 2017) for reference. Based on the DoE, only 20 simulation runs were required.
Table 2
List of the parameters varied in the DoE simulations related to the auger dosing.
| Parameter |
Symbol |
Unit |
Value |
| Auger rotational speed |
ω |
rpm |
400, 600, 800 |
| Coefficient of static friction (par-par) |
μs,pp |
|
0.3, 0.55, 0.8 |
| Coefficient of static friction (par-wall) |
μs,pw |
|
0.1, 0.25, 0.4 |
| Coefficient of rolling friction (par-par) |
μr,pp |
|
0.1, 0.4, 0.7 |
Four main factor responses were studied in this work, i.e., angle of repose (AoR), bulk density (BD), mass flow rate (m˙), and the overall translational kinetic energy (TKE). The BD was determined inside the funnel after the insertion and settlement of the particles. After opening the funnel, m˙ and the average of TKE were computed and then normalized (NA-TKE) over the total time of dosing (DT) of the particles. The AoR was determined in the catching container after the particles were settled down at the end of the dosing process. Fig. 4 shows a cross-sectional view of the initial state of the funnel filled with 6 g of powder using ParaView software.
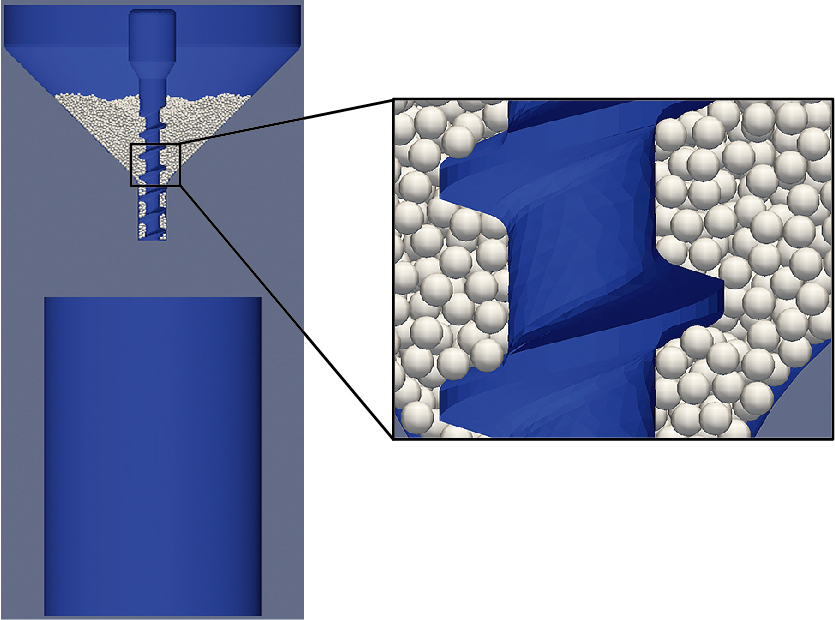
Table 3 presents the DoE matrix followed in performing the parametric and calibration study. The results cover the dosing of 5.2 g, which is the common linear steady state of the particle flow (dosing) for all the simulations. This is because of having big mass flow fluctuations at the end of the dosing due to the very low amount of powder left inside the funnel.
Table 3
DoE matrix and DEM results for the considered 20 simulations.
| Run |
ω (rpm) |
μs,pp |
μs,pw |
μr,pp |
AoR (°) |
BD (g/cm3) |
ṁ (g/s) |
NA-TKE (μJ/s) |
DT (s) |
| 1 |
400 |
0.3 |
0.1 |
0.1 |
29.3 |
0.764 |
0.3995 |
0.0340 |
13.0 |
| 2 |
400 |
0.3 |
0.1 |
0.7 |
35 |
0.761 |
0.3712 |
0.0267 |
14.0 |
| 3 |
400 |
0.3 |
0.4 |
0.1 |
29.3 |
0.767 |
0.2585 |
0.0135 |
20.2 |
| 4 |
400 |
0.3 |
0.4 |
0.7 |
34.5 |
0.753 |
0.2520 |
0.0107 |
20.8 |
| 5 |
400 |
0.55 |
0.25 |
0.4 |
37 |
0.742 |
0.2689 |
0.0112 |
19.2 |
| 6 |
400 |
0.8 |
0.1 |
0.1 |
33.5 |
0.748 |
0.3780 |
0.0283 |
13.8 |
| 7 |
400 |
0.8 |
0.1 |
0.7 |
40.3 |
0.730 |
0.3346 |
0.0265 |
15.6 |
| 8 |
400 |
0.8 |
0.4 |
0.1 |
33.5 |
0.752 |
0.2471 |
0.0139 |
21.2 |
| 9 |
400 |
0.8 |
0.4 |
0.7 |
39.5 |
0.724 |
0.2301 |
0.0138 |
22.8 |
| 10 |
600 |
0.55 |
0.4 |
0.1 |
32.8 |
0.759 |
0.3677 |
0.0362 |
14.2 |
| 11 |
600 |
0.8 |
0.1 |
0.4 |
36.4 |
0.733 |
0.4872 |
0.0594 |
10.6 |
| 12 |
600 |
0.8 |
0.25 |
0.7 |
40 |
0.723 |
0.3796 |
0.0352 |
13.8 |
| 13 |
800 |
0.3 |
0.1 |
0.7 |
38.4 |
0.757 |
0.6674 |
0.0992 |
7.8 |
| 14 |
800 |
0.3 |
0.25 |
0.4 |
36.8 |
0.759 |
0.5538 |
0.0663 |
9.4 |
| 15 |
800 |
0.3 |
0.4 |
0.1 |
30.2 |
0.767 |
0.4946 |
0.0778 |
10.6 |
| 16 |
800 |
0.55 |
0.1 |
0.1 |
32 |
0.753 |
0.6782 |
0.1102 |
7.6 |
| 17 |
800 |
0.55 |
0.4 |
0.7 |
41.5 |
0.734 |
0.4523 |
0.0616 |
11.6 |
| 18 |
800 |
0.8 |
0.1 |
0.7 |
40 |
0.729 |
0.5974 |
0.1095 |
8.8 |
| 19 |
800 |
0.8 |
0.25 |
0.1 |
33.8 |
0.754 |
0.5458 |
0.0694 |
9.6 |
| 20 |
800 |
0.8 |
0.4 |
0.4 |
36.2 |
0.735 |
0.4482 |
0.0689 |
11.6 |
4. Results and discussion
4.1 Material characterization
In this section, the results obtained from the experimental tests are summarized. In particular, Table 4 presents the results of the particle size, shape and density of the SpheroLac 100 powder. The particle shape in LIGGGHTS was set as spherical since the powder has high ASR and Ro values.
Table 4
Particle size, shape and density of SpheroLac 100 powder.
|
D[4,3] (μm) |
ASR |
Ro |
ρp (g/cm3) |
| SpheroLac 100 |
115 |
0.746 |
0.891 |
1.5361 |
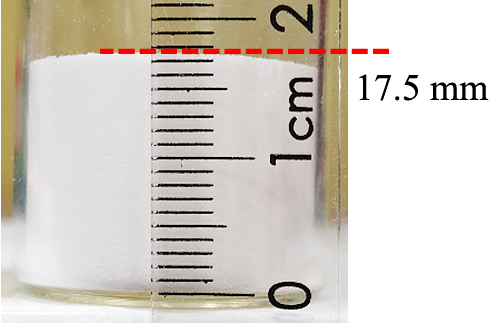
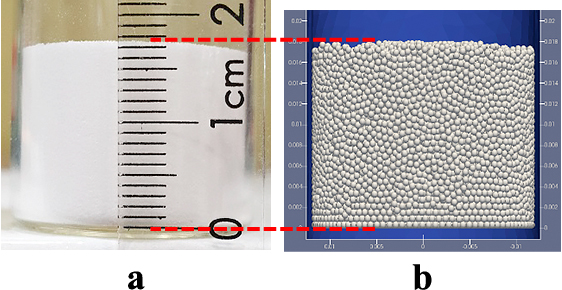
Since the funnel used in the auger dosing experiment is not transparent, the exact height of the powder inside the funnel cannot be determined. Therefore, a transparent glass tube was used instead. After filling 6 g of powder inside the glass tube, the average powder height inside the tube was 17.5 mm (Fig. 5). As a result, the average calculated BD in the experiment is 0.758 g/cm3.
4.2.2 Mass flow rate
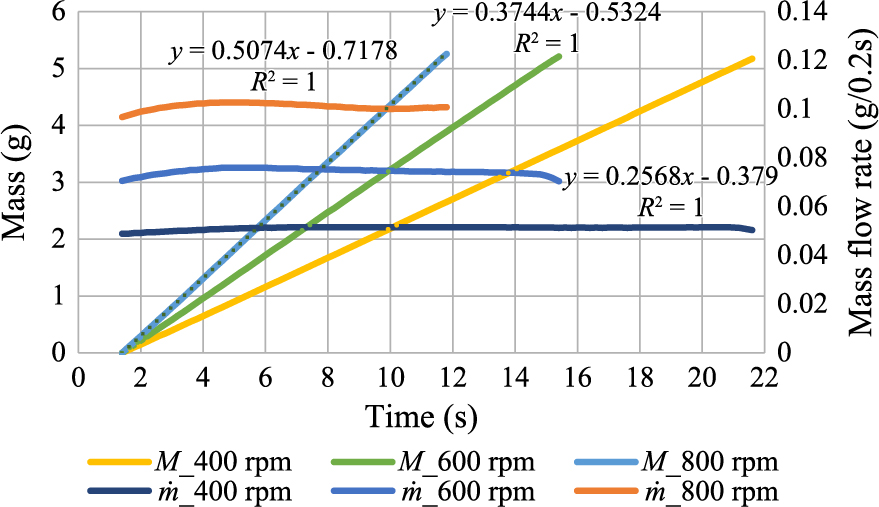
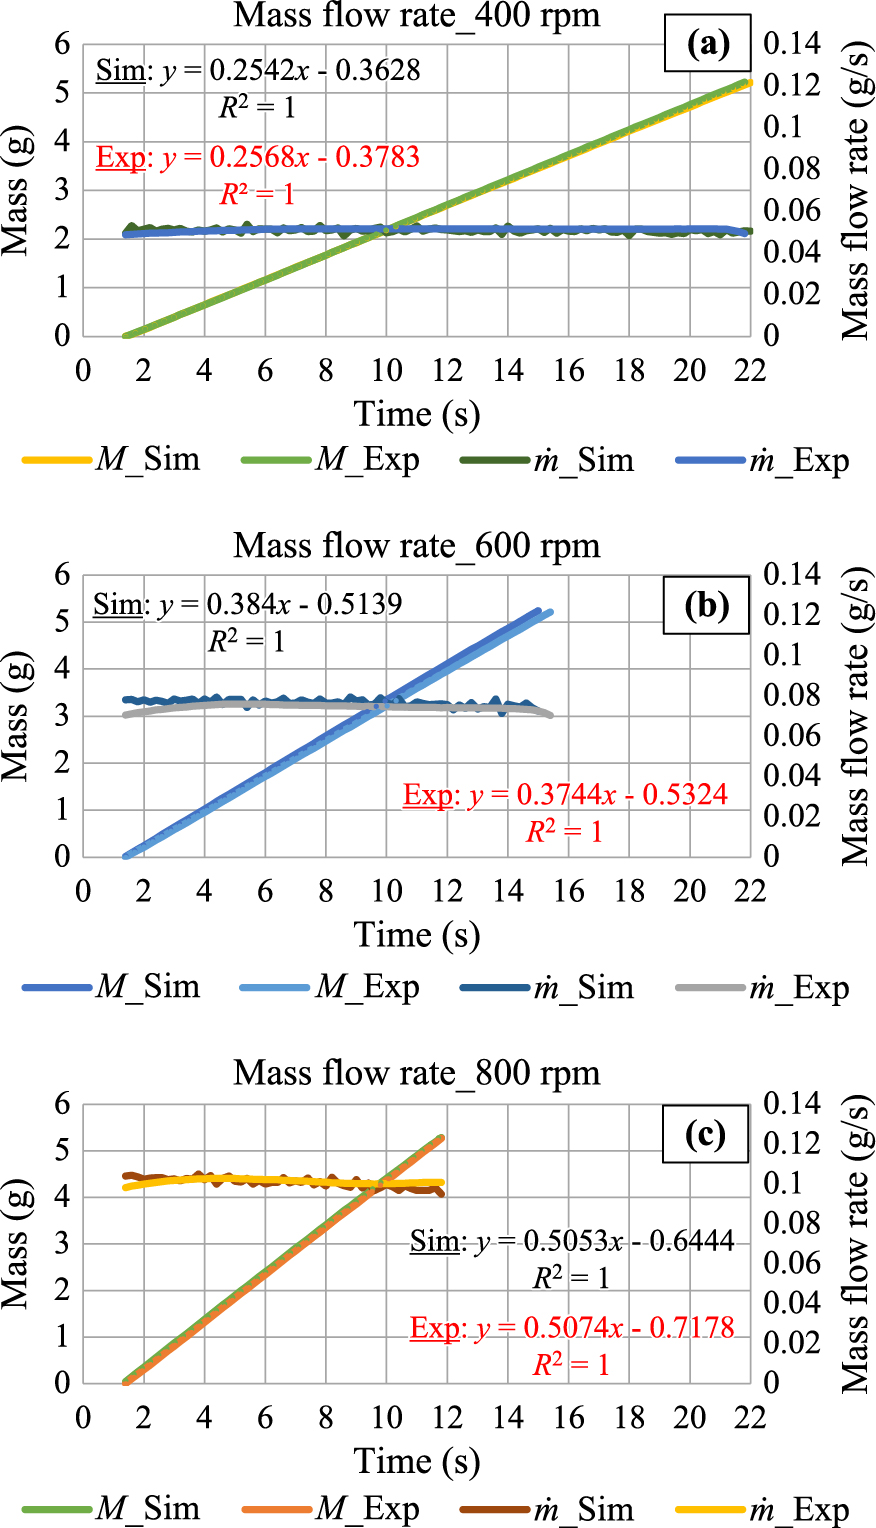
The results of the m˙ tests of SpheroLac 100 at the three rotational speeds are illustrated in Fig. 6. A linear regression of the mass curves (with capital M) was done, where the coefficient of determination (R2) of the linear regression of the mass curves was equal to 1 in all the experiments. The slopes of these linear curves represent m˙, namely 0.2568 g/s, 0.3744 g/s and 0.5074 g/s at speeds of 400, 600 and 800 rpm, respectively. The left graph column represents the mass M (g) and the right graph column represents m˙ (g/s) where both are plotted over time (s).
4.2.3 Angle of repose
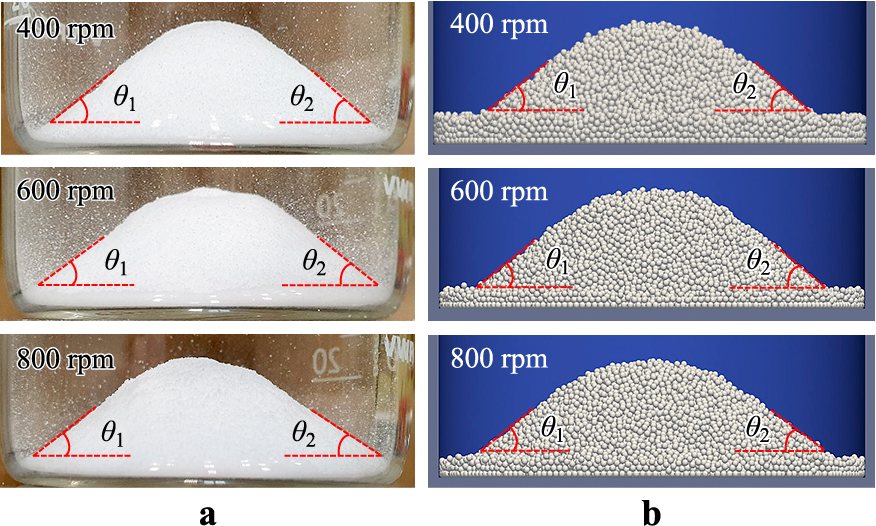
After the dosing was completed, the powder collected in the catching container formed a heap. For each experiment, the AoR was determined by considering the average value between the left and right angles, i.e., θ1 and θ2, respectively.
Table 5 summarizes the results of m˙ and the AoR from the auger dosing experiments. The values of m˙ at the three different speeds and the averaged AoR, besides the BD, are the macroscopic reference values, which were used in the DEM calibration simulations by validating the prediction models (explained in section 4.4). It is also worth mentioning, that it was not possible for us to measure the TKE experimentally. Therefore, TKE will be discussed in the DEM parametric study but it was not considered as a parameter in the calibration process.
Table 5
Summary of the experimental results of the AoR and ṁ.
| ω (rpm) |
AoR (°) |
ṁ (g/s) |
| 400 |
33.2 |
0.2568 |
| 600 |
33.4 |
0.3744 |
| 800 |
33.2 |
0.5074 |
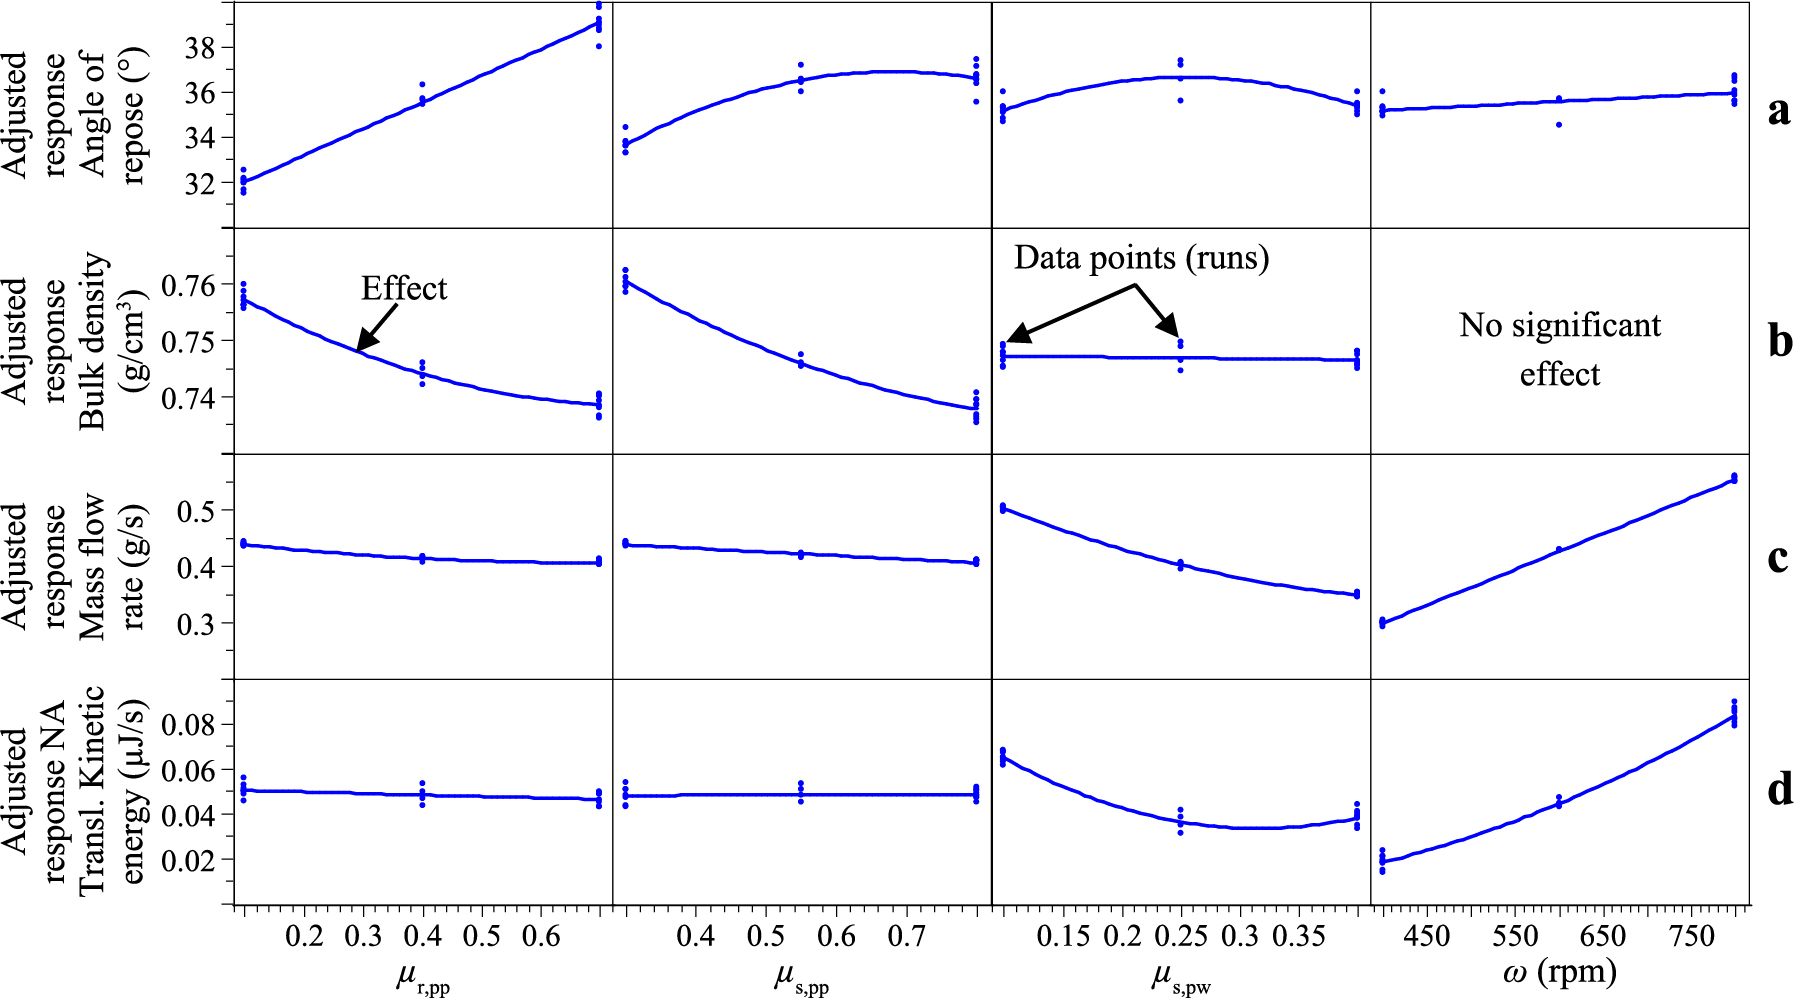
In this section, the effect of the studied parameters on multiple bulk responses will be discussed in terms of manner and extent. Fig. 7 illustrates the effects on the studied responses in an adjusted response graph. Each of the given box plots (row-wise) corresponds to a bulk response, and each of them (column-wise) coincides with a DEM input parameter. The data points shown in Fig. 7 represent the points obtained from the simulations and the effect drawn (curve) from them. These data points are adjusted to average out the effects of the other factors included in the model.
The regression models of the four responses have shown high adjusted R2 values, which indicates very good fits to the determined data points. Table 6 lists the values of the adjusted R2 of the four studied responses.
Table 6
Outline of the adjusted R2 values related to the four responses’ models.
|
AoR |
BD |
ṁ |
NA-TKE |
| Adjusted R2 |
0.975 |
0.983 |
0.998 |
0.986 |
As can be seen from Fig. 7(a), all the studied parameters have a significant effect on the AoR but with varying levels of effectivity. For a more comprehensive illustration of the individual and interactive effects of these parameters, Pareto chart is developed in Fig. 8. It shows the orthogonally-scaled effect of the input parameters on the AoR. The bars being above the 0-axis signify the positive effect (proportional) of the corresponding parameters, and the ones being below it signifies negative effect (anti-proportional). The factors are distributed in descending order according to the level of positive or negative effects from left and right, respectively. Consequently, it can be clearly seen that μr,pp is the most affecting factor on the AoR in our system, where its increase increases the angles of the heap. This is contradictory to most of the literature, where it is stated that the biggest impact on the AoR is the μs,pp. This can be explained by that the introduction of the rotating micro-auger in the system caused more a rotational motion of the particles around their center. The auger speed has a small effect on the AoR. Moreover, it is important to notice the almost negligible effect of μs,pw, which can be neglected from the list of affecting parameters on the AoR.
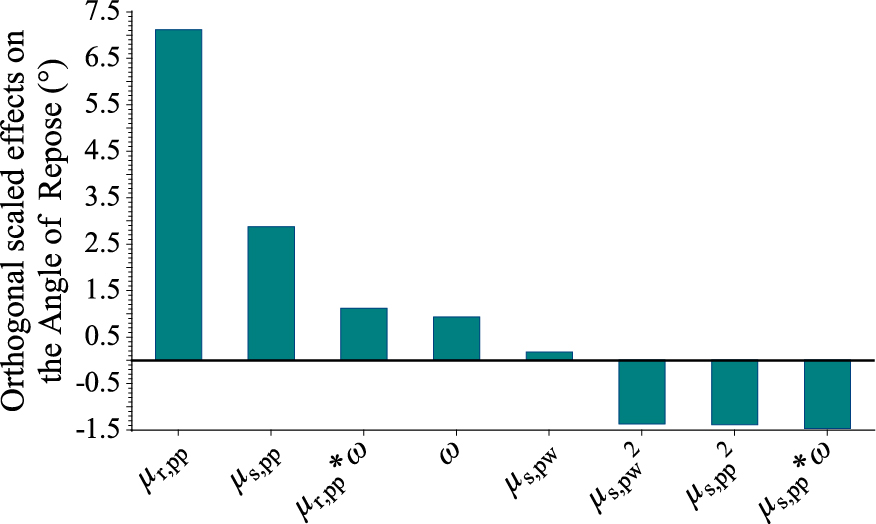
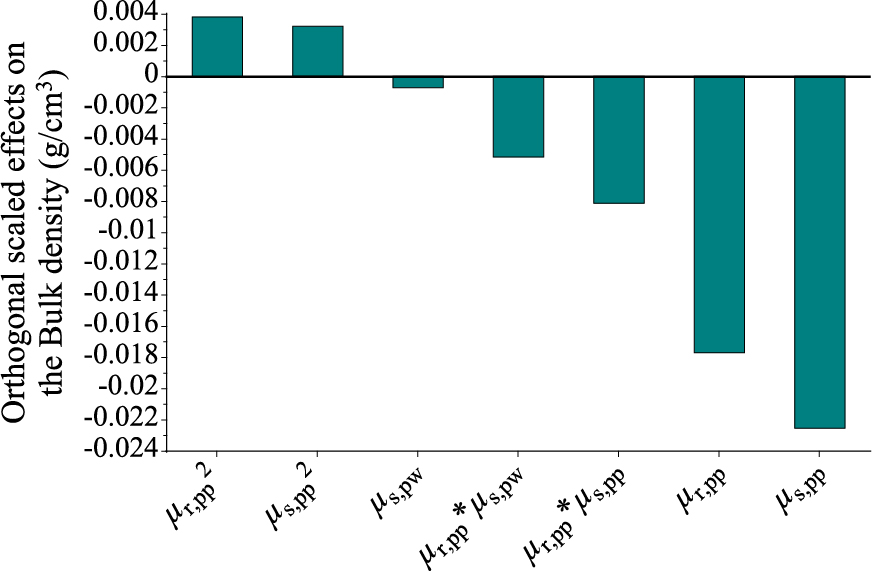
Fig. 9 illustrates the orthogonally-scaled effects on the BD. According to the parametric study, μs,pp and μr,pp can be considered the only effecting parameters on the BD in this study while the μs,pw has an insignificant effect. The interactions between μr,pp and both of μs,pp and μs,pw have a negative impact on the BD, where, as they increase, the BD decreases.
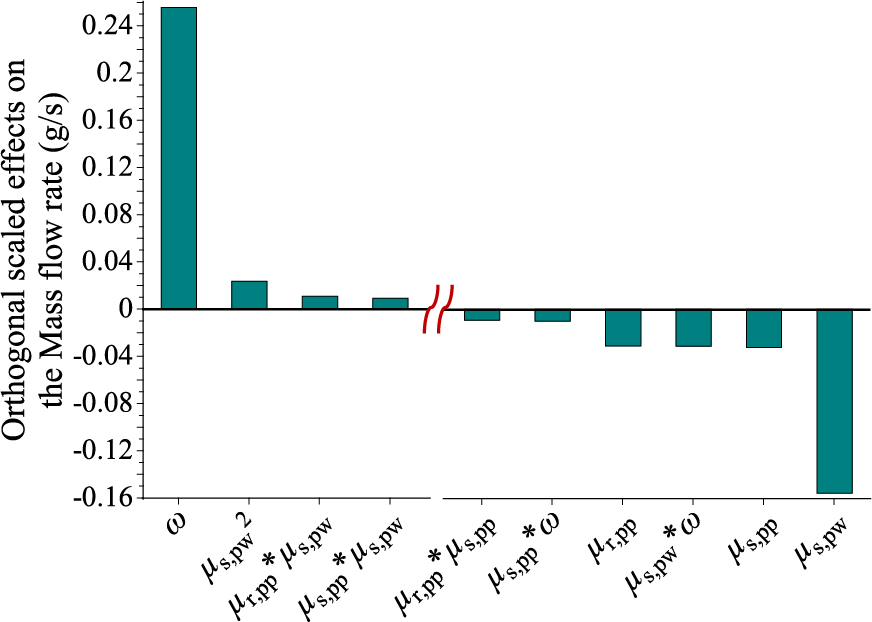
4.3.3 Factors influencing the mass flow rate
Similarly, the orthogonally-scaled effects on the m˙ are shown in Fig. 10. It is evident how the ω has the largest positive significance on m˙, whereas μs,pw has the largest negative impact on it. As the particle-wall friction increases, the tendency of particle flow decreases dramatically leading to low mass output. It is important to notice that although the major effect μs,pw is having on m˙, it has not been considered before as a calibration parameter in many other studies which now reveals its importance to be more widely studied.
4.3.4 Factors influencing the kinetic energy
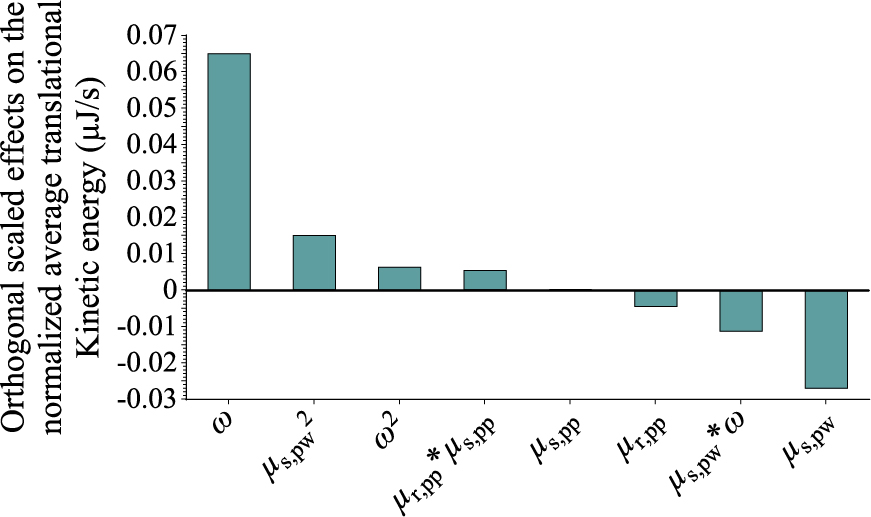
In Fig. 11, the influence of the studied DEM input factors on the NA-TKE, is demonstrated in a Pareto graph of effects. Once more, ω has the highest positive significant effect followed by μs,pw, which has the largest negative impact on the NA-TKE. It is noticeable that the μs,pp is showing a negligible effect on the NA-TKE. The reason for this is that the particles are basically being exposed to a rotary motion by the auger, therefore, the translational contact between the particles was almost not existing. Moreover, the rotation of the auger caused the particles to rotate around themselves, rather than rotating around one common axis. This can be seen by the presence of μr,pp as having some impact. Although the particles are not showing a translational relative motion with respect to each other, the μs,pw is still proven to be a very affecting parameter on the NA-TKE. This means that the particles are sliding on the boundary during dosing. Therefore, it is important to draw attention to the importance of calibrating the roughness of the boundaries in DEM. Moreover, as the NA-TKE basically represents the dynamics of the particles, the AoR was measured when the NA-TKE reached the value of 0. This is because the AoR should be measured when the particles get in rest (Qi et al., 2019).
A prediction model, based on the MVRA results, is built and used to validate the robustness of the model. As μr,pp and μs,pp have the highest significant impact on the AoR and the BD, the contour plots were illustrated based on these two parameters (Fig. 12a and Fig. 12b). Although, as explained in subsection 4.3.3, ω and μs,pw have the highest impact on the ṁ, but due to the aim of finding the optimal parameter combination between the calibrated parameters by superimposing three contour plots together, μr,pp and μs,pp were varied on the predicted contour plot of the m˙ (Fig. 12c) as well. As an illustration example to find out the best optimized DEM parameter combination, the predicted contour plots were generated at ω = 800 rpm and μs,pw = 0.347 (as an optimized value resulting from the optimization algorithms in Cornerstone) as fixed values.
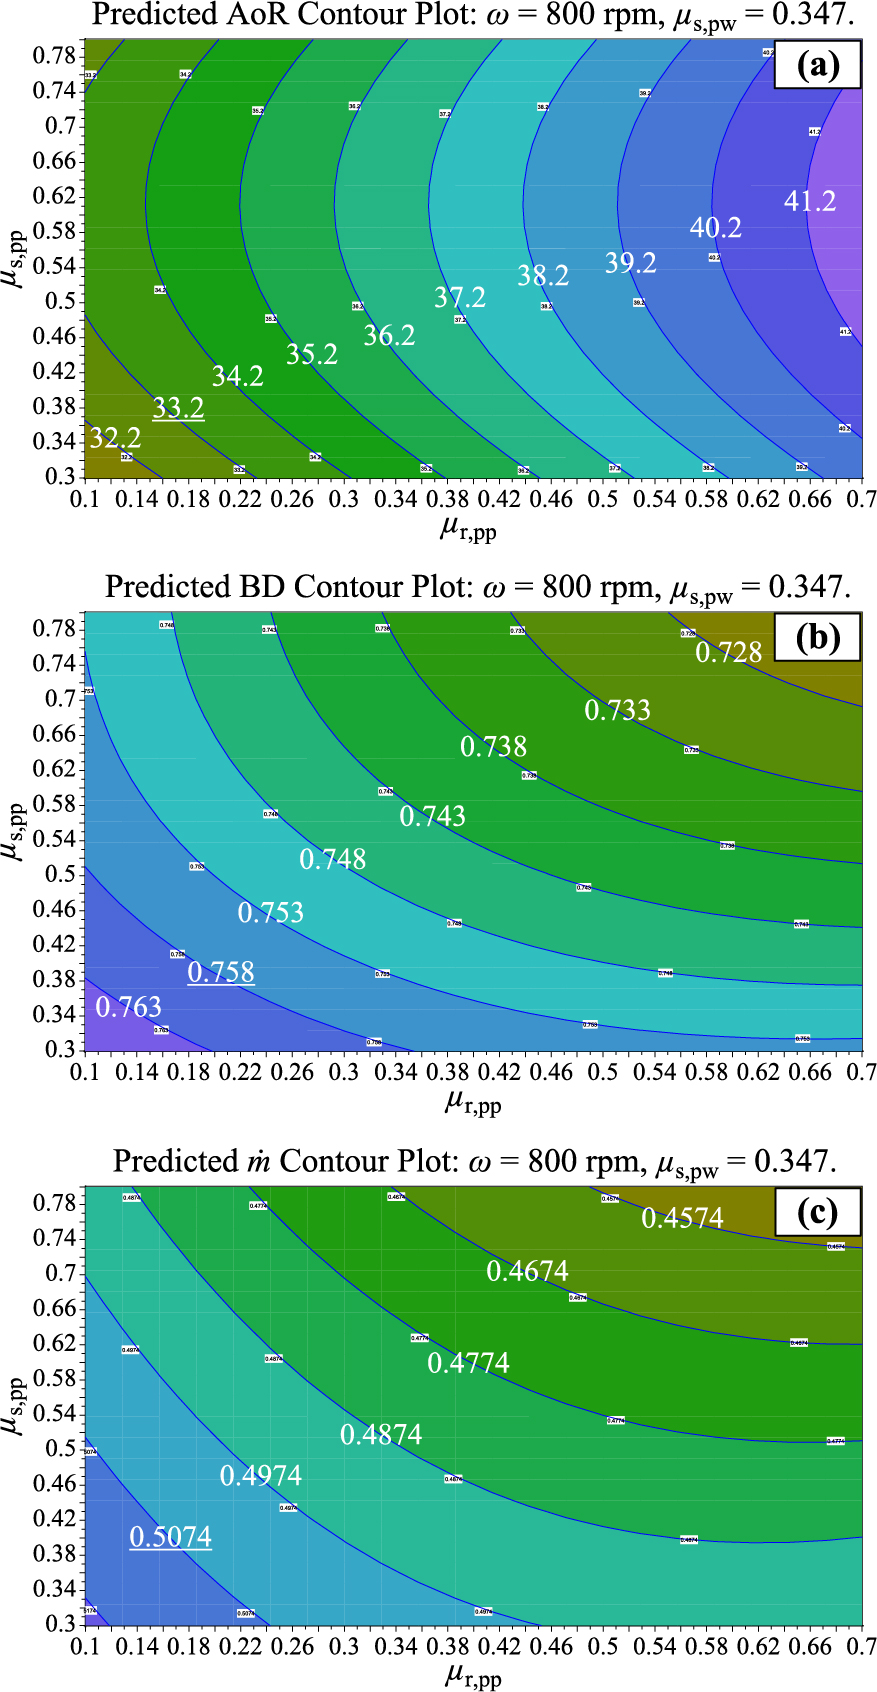
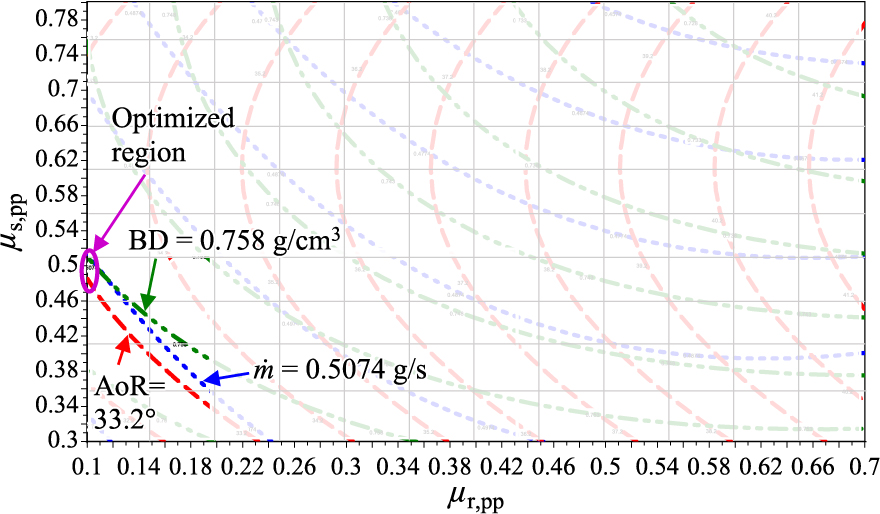
As can be seen from the above figures, wide ranges of combinations between μr,pp and μs,pp in each response lead to delivering the experimental reference values which are the underlined values in the graphs. Therefore, considering a single experimental bulk behavior highlights the problem of ambiguous parameter combinations in the calibration process. Consequently, the three predicted contour plots in Fig. 12 were superimposed. By this, the number of admissible combinations is dramatically minimized, where a very small intersecting region between the reference target values was found (see Fig. 13). Taking into account the minimized area of permissible combinations, the valid range for μr,pp is between 0.1 and 0.2 combined with μs,pp between 0.34 and 0.5. For more clarity, the intersecting contour lines away from our reference target values are blurred in the graph. The contour lines of the BD and the m˙ evidently intersect, whereas the contour line of the AoR (33.2°) is shifted around 0.3° ahead, which is accepted and within the range of the prediction model. In the context of the superimposing approach, one of the problems that may occur is the non-intersection between the contour lines (Derakhshani et al., 2015). Roessler et al., 2018 added that the measurement error needs to be taken into consideration to enable a significant overlap of the test results.
Cornerstone software offers an integrated optimization algorithm to select an optimal unique set of parameters combination that predicts the response values based on the experimental reference target values. Based on the optimization feature algorithm, that aims to match the target values with minimum deviation errors, a simulation at 800 rpm was executed to validate our prediction model (confirmation run). In addition, two more simulations, at speeds 400 rpm and 600 rpm, took place similarly based on their prediction models as well which are not explained here. Table 7 lists the different considered combinations and related bulk responses.
Table 7
DEM parameter combinations of the prediction model and the bulk responses.
| Run |
ω (rpm) |
μs,pp |
μs,pw |
μr,pp |
AoR (°) |
BD (g/cm3) |
m˙ (g/s) |
NA-TKE (μJ/s) |
DT (s) |
| 21 |
400 |
0.523 |
0.375 |
0.1 |
33.1 |
0.757 |
0.2542 |
0.0119 |
20.6 |
| 22 |
600 |
0.313 |
0.36 |
0.32 |
33.8 |
0.758 |
0.384 |
0.0313 |
13.6 |
| 23 |
800 |
0.51 |
0.347 |
0.1 |
33.5 |
0.757 |
0.5053 |
0.0692 |
10.4 |
Fig. 14 compares the experimental AoR and the simulation ones. The results show a very close matching between the simulated heaps and the reference ones.
Using the selected optimized DEM input parameters, a DEM simulation is performed to calibrate the BD with the experiment. Fig. 15 represents the powder height of the BD test in the experiment compared to that of the DEM simulation, where they both show the same height (17.5 mm) and thus the determined BD was matching (0.758 g/cm3).
Fig. 16 represents the m˙ graphs of the three prediction simulations, where the results of the DEM clearly matches with the experimental findings. This enhances as an additional validation to our systematic MVRA using the auger dosing as a standard calibration device. It is shown in the m˙ graphs, especially with speeds 600 rpm and 800 rpm that, at the beginning of the powder flow, there is a small deviation between the experiment and the simulation. In fact, this is due to the acceleration of the motor until the auger filling volume is full with powder.
As it has been pointed out, the regression prediction models qualitatively and quantitatively predicted the results of the three experimental calibration tests. Table 8 summarizes the results from the validation process and compare them with the experimental reference values.
Table 8
Evaluation of the calibrated parameter combinations of the simulation results compared to that of the experiments.
| ω (rpm) |
Bulk behavior |
Experiment |
Simulation |
Deviation (%) |
| 400 |
AoR (°) |
33.2 |
33.1 |
−0.3 |
| BD (g/cm3) |
0.758 |
0.757 |
−0.13 |
| ṁ (g/s) |
0.2568 |
0.2542 |
−1.01 |
| DT (s) |
20.4 |
20.6 |
0.98 |
| 600 |
AoR (°) |
33.4 |
33.8 |
1.2 |
| BD (g/cm3) |
0.758 |
0.758 |
0 |
| ṁ (g/s) |
0.3744 |
0.384 |
2.56 |
| DT (s) |
14 |
13.6 |
−2.86 |
| 800 |
AoR (°) |
33.2 |
33.5 |
0.9 |
| BD (g/cm3) |
0.758 |
0.757 |
−0.13 |
| ṁ (g/s) |
0.5074 |
0.5053 |
−0.41 |
| DT (s) |
10.4 |
10.4 |
0 |
The maximum deviation is 2.86 % (in the case of the DT), where the overall mean deviation of the whole responses (12 results listed in Table 8) is 0.87 %.
Compared to (Roessler et al., 2018), our approach seems to be more efficient and reliable, where we ran only 20 simulations (instead of 384 in their case) to reach the same accuracy of the results. Thus, our systematic approach is an optimized procedure that saves time and money using DoE and MVRA.
5. Conclusions
In this work, a standard calibration method for calibrating non-cohesive powders by tremendously reducing the ambiguity of the DEM parameters selection is established. It is based on an auger dosing principle, which calibrates three bulk material properties at the same time, namely AoR, m˙ and BD in relation to the auger speed, particle-particle beside particle-wall static friction coefficients and particle-particle rolling friction coefficient. The study analysis was done through a highly systematic statistical approach using MVRA. With only 20 simulations, a parametric study of DEM input parameters on the bulk behaviors was performed followed by generating very robust prediction models. This parametric study explained how the aforementioned bulk behaviors depend highly on the particle level interactions and properties. The simulation results used to build a prediction model showed how a high number of different parameter combinations can lead to the same bulk responses. This study proved that using the superimposing principle by combining the prediction contour plots of the bulk responses evidently lead to a very narrow region that matches greatly with the experimental reference values. One optimized solution combination of DEM parameters through the prediction model was selected, where their results agreed significantly with the experimental data. A number of conclusions extracted from this study can be summarized as follows:
-
•Individual calibration tests are not sufficient to calibrate a material in DEM where the ambiguity for the admissible parameter combinations is high.
-
•The auger dosing machine can be used to extract three reference bulk responses, i.e., AoR, BD, m˙.
-
•Using the D-optimal design model, the superimposing principle of three predicted contour plots from the MVRA and the optimization algorithm in Cornerstone proved to be a robust approach to eliminate ambiguity.
-
•μr,pp was shown to have an overwhelmed effect over μs,pp.
-
•Using the presented auger dosing machine, a unique optimized parameter combination was identified and experimentally validated.
For the future work, process optimization should be carried out by studying and validating more material properties and bulk behaviors. In addition, the study should be extended to cover cohesive powders.
Acknowledgements
This research did not receive any specific grant from funding agencies in the public, commercial, or not-for-profit sectors.
References
- Ai J., Chen J.F., Rotter J.M., Ooi J.Y., Assessment of rolling resistance models in discrete element simulations, Powder Technology, 206 (2011) 269–282. DOI: 10.1016/j.powtec.2010.09.030
- Al-hashemi H.M.B., Al-amoudi O.S.B., A review on the angle of repose of granular materials, Powder Technology, 330 (2018) 397–417. DOI: 10.1016/j.powtec.2018.02.003
- Bierwisch C., Kraft T., Riedel H., Moseler M., Three-dimensional discrete element models for the granular statics and dynamics of powders in cavity filling, Journal of the Mechanics and Physics of Solids, 57 (2009) 10–31. DOI: 10.1016/j.jmps.2008.10.006
- Bierwisch C.S., Numerical Simulations of Granular Flow and Filling, Shaker Verlag GmbH, Germany, 2009, ISBN: 3832283382.
- Börner M., Michaelis M., Siegmann E., Radeke C., Schmidt U., Impact of impeller design on high-shear wet granulation, Powder Technology, 295 (2016) 261–271. DOI: 10.1016/j.powtec.2016.03.023
- Ciantia M.O., Arroyo M., Butlanska J., Gens A., DEM modelling of cone penetration tests in a double-porosity crushable granular material, Computers and Geotechnics, 73 (2016) 109–127. DOI: 10.1016/j.compgeo.2015.12.001
- Clearly P.W., DEM modelling of particulate flow in a screw feeder Model description, Progress in Computational Fluid Dynamics, An International Journal, 7 (2007). DOI: 10.1504/PCFD.2007.013005
- Coetzee C.J., Review: Calibration of the discrete element method, Powder Technology, 310 (2017) 104–142. DOI: 10.1016/j.powtec.2017.01.015
- Cundall P.A., Strack O.D.L., A discrete numerical model for granular assemblies, Géotechnique, 29 (1979) 47–65. DOI: 10.1192/bjp.115.526.1065
- Derakhshani S.M., Schott D.L., Lodewijks G., Micro – macro properties of quartz sand : Experimental investigation and DEM simulation, Powder Technology, 269 (2015) 127–138. DOI: 10.1016/j.powtec.2014.08.072
- El Kassem B., Brinz T., Heider Y., Markert B., Experimental study and discrete element simulation of auger dosing of different pharmaceutical powders, Proceedings in Applied Mathematics and Mechanics PAMM, 18 (2018). DOI: 10.1002/pamm.201800261
- El Kassem B., Salloum N., Brinz T., Heider Y., Markert B., A Multivariate regression parametric study on DEM input parameters of free-flowing and cohesive powders with experimental data-based validation, Computational Particle Mechanics, (2020). DOI: 10.1007/s40571-020-00315-8
- Eriksson L., Johansson E., Kettaneh-Wold N., WikstrÄom C., Wold S., Design of Experiments: Principles and Applications, third edition, Umetrics AB, 2008, ISBN: 9197373044.
- Fernandez J.W., Cleary P.W., McBride W., Effect of screw design on hopper drawdown of spherical particles in a horizontal screw feeder, Chemical Engineering Science, 66 (2011) 5585–5601. DOI: 10.1016/j.ces.2011.07.043
- Geuzaine C., Remacle J.-F., Gmsh: A 3-D finite element mesh generator with built-in pre- and post-processing facilities, International Journal for Numerical Methods in Engineering, 79 (2009) 1309–1331. DOI: 10.1002/nme.2579
- Govender N., Pizette P., Wilke D.N., Abriak N.-E., Validation of the GPU based blaze-DEM framework for hopper discharge, Proceedings of the 4th International Conference on Particle-Based Methods — Fundamentals and Applications, PARTICLES 2015, (2015).
- Heider Y., Reiche S., Siebert P., Markert B., Modeling of hydraulic fracturing using a porous-media phase-field approach with reference to experimental data, Engineering Fracture Mechanics, (2018) 116–134. DOI: 10.1016/j.engfracmech.2018.09.010.
- Hertz H., Ueber die Berührung fester elastischer Körper (“On the contact of elastic bodies”), Journal für die reine und angewandte Mathematik, 92 (1882) 156–171. DOI: 10.1515/crll.1882.92.156
- Iwashita K., Oda M., Micro-deformation mechanism of shear banding process based on modified distinct element method, Powder Technology, 109 (2000) 192–205. DOI: 10.1016/S0032-5910(99)00236-3
- Johnstone M.W., Calibration of DEM models for granular materials using bulk physical tests, Doctoral Thesis, The University of Edinburgh, Philosophy (2010).
- Kloss C., Goniva C., Hager A., Amberger S., Pirker S., Models, algorithms and validation for opensource DEM and CFD-DEM, Progress in Computational Fluid Dynamics, International Journal, 12 (2012) 140. DOI: 10.1504/PCFD.2012.047457
- Krantz M., Zhang H., Zhu J., Characterization of powder flow: Static and dynamic testing, Powder Technology, 194 (2009) 239–245. DOI: 10.1016/j.powtec.2009.05.001
- Li Y., Xu Y., Thornton C., A comparison of discrete element simulations and experiments for “sandpiles” composed of spherical particles, Powder Technology, 160 (2005) 219–228. DOI: 10.1016/j.powtec.2005.09.002
- Li Z., Yang J., Xu X., Xu X., Yu W., Yue X., Sun C., Particle shape characterization of fluidized catalytic cracking catalyst powders using the mean value and distribution of shape factors, Advanced Powder Technology, 13 (2002) 249–263. DOI: 10.1163/156855202320252435
- Lommen S., Schott D., Lodewijks G., DEM speedup: Stiffness effects on behavior of bulk material, Particuology, 12 (2014) 107–112. DOI: 10.1016/j.partic.2013.03.006
- Lumay G., Boschini F., Traina K., Bontempi S., Remy J.C., Cloots R., Vandewalle N., Measuring the flowing properties of powders and grains, Powder Technology, 224 (2012) 19–27. DOI: 10.1016/j.powtec.2012.02.015
- MakeItFrom, 2019a, EN 1.4404 (X2CrNiMo17-12-2) Stainless Steel <www.makeitfrom.com/material-properties/EN-1.4404-X2CrNiMo17-12-2-Stainless-Steel> accessed 19.01.2019.
- MakeItFrom, 2019b, Borosilicate Glass <www.makeitfrom.com/material-properties/Borosilicate-Glass> accessed 19.01.2019.
- Marigo M., Cairns D.L., Bowen J., Ingram A., Stitt E.H., Relationship between single and bulk mechanical properties for zeolite ZSM5 spray-dried particles, Particuology, 14 (2014) 130–138. DOI: 10.1016/j.partic.2013.05.006
- Marigo M., Stitt E.H., Discrete element method (DEM) for industrial applications: Comments on calibration and validation for the modelling of cylindrical pellets, KONA Powder and Particle Journal, 32 (2015) 236–252. DOI: 10.14356/kona.2015016
- Mindlin R.D., Compliance of elastic bodies in contact, Journal of Applied Mechanics, 16 (1949) 259–268.
- Moysey P.A., Thompson M.R., Modelling the solids inflow and solids conveying of single-screw extruders using the discrete element method, Powder Technology, 153 (2005) 95–107. DOI: 10.1016/j.powtec.2005.03.001
- Obaid A., Turek S., Heider Y., Markert B., A new monolithic Newton-multigrid-based FEM solution scheme for large strain dynamic poroelasticity problems, International Journal for Numerical Methods in Engineering, 109 (2017) 1103–1129. DOI: 10.1002/nme.5315
- Owen P.J., Cleary P.W., Prediction of screw conveyor performance using the Discrete Element Method (DEM), Powder Technology, 193 (2009) 274–288. DOI: 10.1016/j.powtec.2009.03.012
- Owen P.J., Cleary P.W., Screw conveyor performance: comparison of discrete element modelling with laboratory experiments, Progress in Computational Fluid Dynamics, An International Journal, 10 (2010) 327–333. DOI: 10.1504/PCFD.2010.035366
- Pezo L., Jovanović A., Pezo M., Čolović R., Lonćar B., Modified screw conveyor-mixers – Discrete element modeling approach, Advanced Powder Technology, 26 (2015) 1391–1399. DOI: https://doi.org/10.1016/j.apt.2015.07.016.
- Pillai U., Heider Y., Markert B., A diffusive dynamic brittle fracture model for heterogeneous solids and porous materials with implementation using a user-element subroutine, Computational Materials Science, 153 (2018) 36–47. DOI: 10.1016/j.commatsci.2018.06.024
- Qi L., Chen Y., Sadek M., Simulations of soil flow properties using the discrete element method (DEM), Computers and Electronics in Agriculture, 157 (2019) 254–260. DOI: 10.1016/j.compag.2018.12.052
- Roberts A.W., The influence of granular vortex motion on the volumetric performance of enclosed screw conveyors, Powder Technology, 104 (1999) 56–67. DOI: 10.1016/S0032-5910(99)00039-X
- Roessler T., Katterfeld A., DEM parameter calibration of cohesive bulk materials using a simple angle of repose test, Particuology, 45 (2019) 105–115. DOI: 10.1016/j.partic.2018.08.005
- Roessler T., Richter C., Katterfeld A., Will F., Development of a standard calibration procedure for the DEM parameters of cohesionless bulk materials – part I: Solving the problem of ambiguous parameter combinations, Powder Technology, 343 (2018) 803–812. DOI: 10.1016/j.powtec.2018.11.034
- Shimizu Y., Cundall P., Three-dimensional DEM simulations of bulk handling by screw conveyors, Journal of Engineering Mechanics, 127 (2001) 864–872. DOI: 10.1061/(ASCE)0733-9399(2001)127:9(864)
- Sinnott M.D., Cleary P.W., The effect of particle shape on mixing in a high shear mixer, Computational Particle Mechanics, 3 (2016) 477–504. DOI: 10.1007/s40571-015-0065-4
- Souihi N., Josefson M., Tajarobi P., Gururajan B., Trygg J., Design space estimation of the roller compaction process, Industrial & Engineering Chemistry Research, 52 (2013) 12408–12419. DOI: 10.1021/ie303580y
- Sundararajan K., 2018, Design of Experiments- A Primer <www.isixsigma.com/tools-templates/design-of-experiments-doe/design-experiments-␓-primer/> accessed 22.04.2020.
- Triefenbach F., Design of experiments: The D-optimal approach and its implementation as a computer algorithm, Bachelor’s Thesis, Umea University and South Westphalia University of Applied Sciences, 2008.
- Wang Z., Jacobs F., Ziegler M., Experimental and DEM investigation of geogrid-soil interaction under pullout loads, Geotextiles and Geomembranes, 44 (2016) 230–246. DOI: 10.1016/j.geotexmem.2015.11.001
- Wensrich C.M., Katterfeld A., Rolling friction as a technique for modelling particle shape in DEM, Powder Technology, 217 (2012) 409–417. DOI: 10.1016/j.powtec.2011.10.057
- Wilkinson S.K., Turnbull S.A., Yan Z., Stitt E.H., Marigo M., A parametric evaluation of powder flowability using a Freeman rheometer through statistical and sensitivity analysis: A discrete element method (DEM) study, Computers and Chemical Engineering, 97 (2017) 161–174. DOI: 10.1016/j.compchemeng.2016.11.034
- Yan Z., Wilkinson S.K., Stitt E.H., Marigo M., Discrete element modelling (DEM) input parameters: Understanding their impact on model predictions using statistical analysis, Computational Particle Mechanics, 2 (2015) 283–299. DOI: 10.1007/s40571-015-0056-5
- Zhou D., Qiu Y., Understanding material properties in pharmaceutical product development and manufacturing: Powder flow and mechanical properties, Journal of Validation technology, 73 (2010) 65–77. DOI: 10.6061/clinics/2018/e264
- Zhou Y.C., Xu B.H., Yu B., Zulli P., An experimental and numerical study of the angle of repose of coarse spheres, Powder Technology, 125 (2002) 45–54. DOI: 10.1109/MACE.2011.5986910
- Zhu H.P., Zhou Z.Y., Yang R.Y., Yu A.B., Discrete particle simulation of particulate systems: Theoretical developments, Chemical Engineering Science, 62 (2007) 3378–3396. DOI: 10.1016/j.ces.2006.12.089
- Zhu H.P., Zhou Z.Y., Yang R.Y., Yu A.B., Discrete particle simulation of particulate systems: A review of major applications and findings, Chemical Engineering Science, 63 (2008) 5728–5770. DOI: 10.1016/j.ces.2008.08.006
Authors’ Short Biographies
Bilal El Kassem

Bilal El Kassem, M.Sc., is a PhD candidate at Robert Bosch Packaging Technology GmbH, in Stuttgart, Germany, under the supervision of Prof. Bernd Markert from RWTH Aachen University. He received his B.Sc. degree in Mechatronics Engineering from Rafic Hariri University, Lebanon in 2012, and received his M.Sc. degree in Computer Aided Production in Mechanical Engineering from RWTH Aachen University, Germany, in 2016. His current research focuses on optimizing auger dosing process using discrete element methods and analyzing the experimental powder flow behavior using regression analysis.
Nizar Salloum

Nizar Salloum, M.Sc., is a PhD candidate at Robert Bosch Packaging Technology GmbH, in Stuttgart, Germany, under the supervision of Prof. Stefan Heinrich from Hamburg University of Technology. He received his B.Sc. degree in Mechanical Engineering from Lebanese International University in 2016, and received his M.Sc. degree in Computational Mechanics of Materials and Structures from University of Stuttgart, in 2019. His current research focuses on optimizing mixing and filling processes of pharmaceutical powders using discrete element methods.
Thomas Brinz

Dr. Thomas Brinz is a department leader at Robert Bosch Packaging Technology GmbH, in Stuttgart. He received his Diploma degree in Chemistry from University of Ulm, in 1999, and received his PhD degree in Chemistry at the same university, in 2003. His has 16 years of industrial expertise in lab automation solutions and high throughput technologies in pharmaceutical applications.
Yousef Heider

Dr. Yousef Heider is working since May 2014 as Lecturer at RWTH Aachen University in Germany. He was between Oct. 2018 and Sept. 2019 a visiting Associate Research Scientist at Columbia University, USA, and worked between July 2011 and April 2014 in the field of renewable energies (R&D) at the company Ed. Zueblin AG in Germany. He received his Ph.D. degree in Computational Porous Media Dynamics from the University of Stuttgart, Germany, in 2012 under the supervision of Prof. Wolfgang Ehlers. He holds his Master’s degree (2007) in Computational Mechanics of Materials and Structures from the University of Stuttgart.
Bernd Markert

Prof. Bernd Markert is full professor at RWTH Aachen University and director of the Institute of General Mechanics since 2013. He received his diploma degree in Civil Engineering from the University of Stuttgart in 1998 and finished his PhD degree also there under the supervision of Prof. Wolfgang Ehlers in 2005. He completed his habilitation (venia legendi and facultas docendi) for Mechanics in 2011. His current research focuses on the broad field of Digital Engineering involving advanced modeling and simulation methods as well as computational intelligence.
 https://ror.org/04xfq0f34

;%0A%09%09%09newWindow.document.open();%0A%09%09%09newWindow.document.write('<img src=%22./Graphics/38_2021010_17.jpg%22>');%0A%09%09%09newWindow.document.close();%0A%09%09)
;%0A%09%09%09newWindow.document.open();%0A%09%09%09newWindow.document.write('<img src=%22./Graphics/38_2021010_18.jpg%22>');%0A%09%09%09newWindow.document.close();%0A%09%09)
;%0A%09%09%09newWindow.document.open();%0A%09%09%09newWindow.document.write('<img src=%22./Graphics/38_2021010_19.jpg%22>');%0A%09%09%09newWindow.document.close();%0A%09%09)
;%0A%09%09%09newWindow.document.open();%0A%09%09%09newWindow.document.write('<img src=%22./Graphics/38_2021010_20.jpg%22>');%0A%09%09%09newWindow.document.close();%0A%09%09)
;%0A%09%09%09newWindow.document.open();%0A%09%09%09newWindow.document.write('<img src=%22./Graphics/38_2021010_21.jpg%22>');%0A%09%09%09newWindow.document.close();%0A%09%09)