Abstract
Particle shape plays a critical role in governing the properties and behavior of granular materials. Despite advances in capturing and analyzing 3D particle shapes, these remain more demanding than 2D shape analysis due to the high computational costs and time-consuming nature of 3D imaging processes. Consequently, there is a growing interest in exploring potential correlations between 3D and 2D shapes, as this approach could potentially enable a reasonable estimation of a 3D shape from a 2D particle image, or at most, a couple of images. In response to this research interest, this study provides a thorough review of previous studies that have attempted to establish a correlation between 3D and 2D shape measures. A key finding from the extensive review is the high correlation between 2D perimeter circularity (cp) and Wadell’s true sphericity (S) defined in 3D, suggesting that a 3D shape can be estimated from the cp value in terms of S. To further substantiate the correlation between cp and S, this study analyzes approximately 400 mineral particle geometries available from an open-access data repository in both 3D and 2D. The analysis reveals a strong linear relationship between S and cp compared with other 2D shape descriptors broadly used in the research community. Furthermore, the limited variance in cp values indicates that cp is insensitive to changes in viewpoint, which indicates that fewer 2D images are needed. This finding offers a promising avenue for cost-effective and reliable 3D shape estimation using 2D particle images.
1. Introduction
Particle shape significantly influences the macroscopic properties and behavior of granular materials (Cho et al., 2006; Cook et al., 2017; Lee et al., 2017; Payan et al., 2016; Shin and Santamarina, 2013; Stark et al., 2014). For example, track ballast, which is a granular material essential for railroad infrastructure, plays a vital role in facilitating drainage around the tracks and distributing the load from the train traffic, thereby stabilizing the railway track system. The geometry of the ballast particle is a key parameter that affects drainage and significantly affects track performance, including strength, track modulus, and permanent deformation. In the granular materials research community, the influence of particle shape has been studied experimentally (Cho et al., 2006; Lee et al., 2019) and numerically (e.g., using the Discrete Element Method (DEM)) by explicitly modeling particle geometries (Lee, 2014; Lee et al., 2010, 2012, 2021; Lee and Hashash, 2015; Qian et al., 2013; Tutumluer et al., 2018). More recently, 3D-printed synthetic particles have been employed for the investigations. These particles were first digitally represented and then 3D printed for experimental studies to investigate the effect of particle shape (Hanaor et al., 2016; Landauer et al., 2020; Su et al., 2017, 2020b).
Particle shape characterization has been conducted through either 3D or 2D analysis, each with its own distinct methodologies and inherent trade-offs. In 3D analysis, geometric attributes such as the three principal dimensions (such as length, width, and thickness), volume, and surface area are measured using advanced imaging tools, including 3D laser scanning and X-ray microcomputed tomography (μCT). The obtained geometric information is then used to describe the shape, e.g., elongation, flatness, and sphericity. These methods enable us to capture the 3D geometry of particles with greater accuracy, making them increasingly popular in the granular materials research community. Nevertheless, 3D analysis is generally time-consuming, computationally expensive, and labor-intensive. It requires significant effort in the pre- and post-processing of data, as well as in scanning particles whether individually or collectively. In contrast, 2D analysis evaluates planar geometric attributes such as the projected area and perimeter, which are derived from projected 2D particle images. This method, being more traditional with a longer history than 3D analysis methods, offers simplicity and speed, making it suitable for rapid assessment of particle shapes. However, it fails to provide a comprehensive understanding of 3D particle geometry. In addition, 2D analysis can be sensitive to changes in viewpoint, which can skew the analysis results.
Given the distinct strengths and limitations of 3D and 2D analysis methods, there is increasing interest in bridging the gap between these two approaches, aiming to ultimately estimate 3D shape properties from a 2D particle image or images. Many review papers have examined various 3D and 2D shape descriptors (Anusree and Latha, 2023; Blott and Pye, 2007; Jia and Garboczi, 2016; Rodriguez et al., 2012). However, there appears to be a lack of comprehensive reviews specifically focusing on the correlation between 3D and 2D shape measures with the goal of estimating 3D shape from 2D particle images.
This review paper aims to examine existing research to identify effective correlations between 3D and 2D shape measures. This review is particularly timely given the recent advances in 3D imaging techniques that facilitate the creation of digitally representable 3D particles and enable more accurate correlations across the different spatial dimensions. The comparative study of 3D and 2D shapes has relevance across disciplines, including applications for general objects in computer graphics fields (Petre et al., 2010). However, this review narrows the focus to mineral particles, ensuring that the findings are relevant and applicable to the field of granular materials research.
We begin by reviewing various 3D and 2D shape analysis methods that have been adopted by the research community, highlighting their benefits and drawbacks. These are discussed in Sections 2 and 3. The salient conclusion from the comprehensive reviews (as described in Section 4) is that there is a good correlation between Wadell’s 3D true sphericity (S) and 2D perimeter circularity (cp), which is attributable to the inherent relevance of their definitions. To further substantiate the findings, this paper includes a study using a dataset of 3D digital particles from the NSF DesignSafe-CI, an open-access data repository (Tripathi et al., 2023). The study analyzes 382 granite and limestone particle geometries in the dataset. The analysis compares the five broadly used 2D circularities, including cp, with the 3D true sphericity (S), which is elaborated in Section 5. For clarity, the upper-case symbols denote 3D geometric properties, while the lower-case symbols are used to indicate 2D properties throughout this paper. For example, A indicates a particle’s surface area in 3D, while a represents the projection area of a particle in 2D.
2. 3D shape analysis
2.1 3D shape descriptors
Particle shape has been traditionally characterized on three different scales: (i) form, (ii) roundness, and (iii) surface texture, as shown in Fig. 1. Form identifies the shape on the scale of particle diameter D. Three principal dimensions are commonly used to describe the form of a particle contained in a hypothetical tight box: length (D1), width (D2), and thickness (D3). These dimensions are perpendicular to each other and represent the long, intermediate, and short dimensions, respectively. Ratios derived from these three dimensions are used as form factors to quantify the shape. For example, the D2/D1 ratio has been traditionally used to indicate elongation, and the D3/D1 ratio has been adopted for flatness. Various form classification diagrams have been developed based on this approach, most notably by Zingg (1935), Krumbein (1941), and Sneed and Folk (1958). The lineage of efforts to define the particle form based on three principal dimensions also includes contributions from Wentworth (1923), Corey (1949), Aschenbrenner (1956), Janke (1966), Dobkins and Folk (1970), among others. Interested readers can refer to Blott and Pye (2007), which provides a comprehensive summary of the various form factors. Roundness is defined at an intermediate scale, describing the sharpness of local corners and edges, which is one order of magnitude smaller than the particle diameter scale, i.e., D/10 (Cho et al., 2006; Jerves et al., 2016). The diameters of the curvature at the corners are commonly used as major parameters to quantify roundness. Surface texture, which relates to surface roughness at the micro-to-nano scale, requires high-resolution optical characterization (Alshibli et al., 2015). Unlike form and roundness that are characterized optically, surface texture has frequently been characterized mechanically, e.g., through measurements of the interparticle friction angle (Lee and Seed, 1967; Rowe, 1962; Terzaghi et al., 1996). This mechanical characterization is also driven by the fact that intrinsic mineralogy primarily determines surface texture (Terzaghi et al., 1996).

Sphericity is another aspect of 3D particle shape and is a measure of how closely the shape of a particle resembles that of a sphere. Wadell (1932) developed the concept of true sphericity (S) to quantify sphericity. This measure compares the particle’s surface area A to the surface area of a sphere with the same volume as the particle As, as defined in Eqn. (1). He added that sphericity was best measured by the true sphericity (Wadell, 1933).
Later, Wadell (1934) introduced an alternative measure of sphericity, denoted as Ψ, as defined in Eqn. (2), because of the challenges in measuring surface area. In this definition, V is the volume of a particle, and Vcs is the volume of the smallest circumscribed sphere.
|
Ψ
=
(
V
/
V
cs
)
1
/
3 | (2) |
Krumbein (1941) showed that Ψ can be effectively represented by Eqn. (3), where D′, D″, and D‴ are the three principal diameters of an ellipsoid. These diameters, ordered such that D′ > D″ > D‴, define an ellipsoid with the same volume as the particle. He termed this measure intercept sphericity. This approach uses the same definition as the alternative sphericity in Eqn. (2) while simplifying the measurement to three principal dimensions.
|
Ψ
=
(
D
″
×
D
‴
/
D
′
2
)
1
/
3 | (3) |
There has been some confusion within the granular materials research community regarding whether sphericity is a form factor or a fourth aspect of shape. Sphericity has often been considered a form factor because it can be measured using three principal dimensions, as shown in Eqn. (3). However, many studies have suggested that sphericity is a distinct aspect that is separate from particle form. This view is supported by the fact that Wadell’s true sphericity (S) is influenced by both form and roundness, highlighting the need to treat sphericity as a distinct characteristic (Barrett, 1980; Blott and Pye, 2007; Zhu and Zhao, 2021). Particle form is defined by particle’s three principal dimensions; thus, it is independent of local shape features, such as roundness. However, true sphericity quantifies a comprehensive aspect of shape by measuring equidimensionality in all directions; thus, it is not completely independent of roundness. For example, a cube and a regular dodecahedron are considered ‘equant’ across the three principal dimensions; thus, they are evaluated as having the same form. However, the regular dodecahedron, which is close to the shape of a perfect sphere, exhibits higher true sphericity. A form described as ‘equant’ needs only be equidimensional in three directions, whereas a true sphere is equidimensional in all directions; thus, equant shapes are not equally spherical from the perspective of true sphericity. For this reason, it is appropriate to discuss ‘sphericity measures’ such as Ψ as a form factor, while treating ‘true sphericity’ S as a distinct fourth aspect of shape, even though S was originally proposed as a shape descriptor to measure sphericity.
Larger-scale properties such as particle form and true sphericity are more critical for understanding 3D shape characteristics than local scale properties like roundness and surface texture. Specifically, the 3D form is defined by three principal dimensions, and true sphericity is measured based on the 3D surface area of the particle. Therefore, these measurements are inherently limited when estimated from 2D projection images. However, since roundness and surface texture are defined at a more localized level, 2D analysis may not result in significant loss of information compared with 3D analysis. This perspective aligns with Wadell’s observation: “while sphericity is essentially a three-dimensional conception, roundness is obtained by measurements in one plane only” (Wadell, 1932). The minimal emphasis on roundness analysis in 3D may explain why Wadell never proposed a concept of 3D roundness despite his extensive studies on 3D sphericity. Given that surface texture operates at an even smaller scale, the importance of understanding the 3D surface texture may not be as significant. Therefore, the correlation between 3D and 2D shape analyses may provide a more practical value for characterizing form and true sphericity. Therefore, this paper focuses on larger-scale shape properties rather than roundness and surface texture.
2.2 Advances and challenges in 3D shape analysis
When the concept of 3D shape description was first conceptualized in the 1920s and later, 3D shape analysis relied on measuring three principal dimensions to quantify form and sphericity. Today, 3D shape analysis is primarily conducted using 3D digital imaging techniques. These methods enable the capture of full particle geometries with unprecedented accuracy, including particle volume and surface area, and facilitate measurements such as true sphericity. The 3D digital imaging techniques adopted within the granular materials research community can be broadly categorized into four approaches: (i) using a set of projection images, (ii) employing general-purpose handheld or desktop 3D scanners that utilize laser or structured light, (iii) applying X-ray micro-computed tomography (μCT), and (iv) utilizing other methods, including various microscopes. Zhang et al. (2019) similarly classified modern 3D shape analysis methods as involving charge-coupled device image processing, laser scanning, or μCT.
(i) 3D shape analysis based on a set of projection images:
Early approaches to image-based 3D shape analysis attempted to reconstruct a particle’s geometry by combining multiple 2D images from different viewpoints, commonly using three orthogonal projection images. The early efforts include Kuo et al. (1996), Lee et al. (2005), and Cavarretta et al. (2009). Later, researchers at the University of Illinois developed the Enhanced University of Illinois Aggregate Image Analyzer (E-UIAIA), a 3D shape analysis system specifically developed for coarse aggregates, as shown in Fig. 2. The proposed system creates a polyhedral digital representation of a 3D particle by combining three orthogonal particle images (Huang and Tutumluer, 2014; Moaveni et al., 2013; Qian et al., 2013). However, using only three projections limits its ability to accurately represent detailed particle shapes, such as surface concavities, as depicted in Fig. 2(d). More recent methodologies, such as 3D Dynamic Image Analysis (DIA), extract features from a greater number of projections of a particle, ranging from 8 to 12 (Li Linzhu et al., 2023; Li and Iskander, 2021). Structure-from-motion (SfM) photogrammetry, which is extensively used in the computer vision field, has also been adopted by the granular materials research community. This method facilitates digital representation of 3D particle geometry from multiple photographs taken at random viewpoints with standard or cellphone cameras (Ozturk and Rashidzade, 2020; Paixão et al., 2018; Tunwal and Lim, 2023; Zhang et al., 2016; Zhao et al., 2021). Fig. 3 shows an example of SfM-based imaging applied to mineral particles. Although this approach enables a more accurate representation of particle shape, capturing detailed geometries requires extensive photographic efforts.

This approach employs laser or structured light (SL), differentiating it from the above-described photo-based approach. A study by Lee et al. (2005) can be considered an early attempt in this category. Their system captured one side of a particle on a conveyor belt, employing a customized setup that combined two cameras and a uniform line laser. While the effect of scanning resolution needs to be further studied, the approach to capture 3D particle geometries employing laser or SL is becoming increasingly popular in the granular materials research community because many commercial tools are available (Bhattacharya et al., 2020; Hu et al., 2023; Latham et al., 2008; Lee C.H. et al., 2022; Lee S.J. et al., 2022; Li et al., 2021; Sun et al., 2014; Tripathi et al., 2023, 2024; Xiao et al., 2020; Yang et al., 2023). Fig. 4 shows the setup of a 3D SL scanning system applied to mineral particles. Fig. 5 shows a digitally represented particle obtained by SL scanning.

This technique utilizes an X-ray beam to generate cross-sectional images of a specimen, which are then combined to reconstruct its 3D digital representation. Unlike the other methods that use the selective ‘projection’ images, this μCT approach employs ‘slice’ images which are compiled into a 3D digital image. This non-destructive technique allows for detailed visualization of the intricate particle contacts that compose the internal structure of a specimen, such as soil fabric. The μCT imaging system is often integrated with conventional laboratory experiments, such as triaxial compression, for in situ tomography. Therefore, this setup facilitates the simultaneous loading and scanning of specimen inside a triaxial cell, allowing the observation of changes in the internal structure. Consequently, many studies have adopted μCT to capture changes in soil fabric along with the evolution of particle geometries within soil samples (Al-Raoush, 2007; Alshibli et al., 2015; Bagheri et al., 2015; Bloom et al., 2010; Druckrey et al., 2016; Erdogan et al., 2006; Fei et al., 2019; Fonseca et al., 2012; Fu et al., 2006; Kutay et al., 2010; Li Linzhu et al., 2023; Maroof et al., 2020; Masad et al., 2005; Nie et al., 2020; Su and Yan, 2018a; Vlahinić et al., 2014; Wu et al., 2018; Yang et al., 2017; Zhou et al., 2015; Zhou and Wang, 2017). Fig. 6 presents a schematic and experimental setup for in situ tomography using μCT. In general, 3D particle geometry characterization using μCT can be categorized into three approaches (Zhao and Wang, 2016): (a) voxel assembly in images (Alshibli et al., 2015; Fonseca et al., 2012; Lin and Miller, 2005; Ueda, 2020; Yang et al., 2017), (b) reconstructed surface mesh (Lin and Miller, 2005), and (c) calculations based on surfaces formed through 3D spherical harmonic (SH) analysis (Cepuritis et al., 2017; Erdogan et al., 2006; Kutay et al., 2011; Masad et al., 2005; Nie et al., 2020; Su and Yan, 2018a; Wei et al., 2022; Zhou et al., 2015; Zhou and Wang, 2017).

These approaches include, but are not limited to, the following: using digital microscopes (Fang et al., 2022), optical tomography systems composed of an inverted microscope and a digital camera (Bloom et al., 2010), confocal microscopes (McCormick and Gee, 2005), and optoelectronic analysis (Krawczykowski et al., 2022). An approach worth mentioning is the study by Yeong and Torquato (1998), which involved probabilistic reconstruction of mesoscale 3D particulate media from a 2D slice image. This technique has gained interest owing to its ability to extrapolate three-dimensional structures from two-dimensional data, particularly due to the limited access to μCT and computing resources available at the time. Subsequent research has applied this technique to reproduce mesoscale 3D heterogeneous rocks from 2D cross-section images for discrete element simulation (Wei et al., 2023). However, it remains uncertain whether these probabilistically generated 3D particles accurately reflect actual 3D shapes. Additionally, high-fidelity 3D reconstruction is computationally expensive. In their article, it was highlighted that using the exhaustive method to calculate the two-point probability function requires enumerating hundreds of millions of particle pairs, which can easily exceed the memory capacity of a standard personal computer, necessitating the use of Monte Carlo simulations. Consequently, further research is required to determine whether the reconstructed 3D medium truly represents the actual geometries of the particles.
Recent approaches have also adopted Artificial Intelligence and Machine Learning (AI/ML) technologies. Wang et al. (2023) utilized a deep learning-based approach to capture 2D randomly projected images from a vibration screen machine. Zubić and Liò (2021) demonstrated an application within the computer graphics domain to reconstruct 3D models from a 2D image of general objects such as cars and birds. Xiao et al. (2020) introduced an AI/ML-based method for statistically reconstructing 3D particle geometries using trained datasets. There have been attempts to use SfM for field analysis of particles, such as stockpiles, by creating a 3D point cloud directly from images taken on site and then segmenting the point cloud into individual particles. A major challenge arises from the occlusion problem, where only a few particles are fully visible on the surface. To address this issue, Huang et al. (2022) adopted an AI/ML approach to reconstruct the occluded sides of partially visible particles.
A 3D shape analysis is generally considered time-consuming, labor-intensive, and computationally costly. When particles are individually scanned for 3D shape analysis, such as with a desktop 3D scanner: (a) each particle requires multiple scans for full 3D geometry characterization, necessitating the use of a rotating table and flipping particles upside down to capture all sides (Bhattacharya et al., 2020); and (b) a significant number of particles need to be scanned to ensure statistical significance for representing the shapes of the bulk. While scanning a few particles using a handheld or desktop scanner is feasible, scaling up to hundreds or thousands of particles is practically challenging, which limits statistical significance in the analysis. On the other hand, X-ray μCT allows the simultaneous capture of 3D geometries of all particles within a sample, eliminating the need to scan each particle individually (Wu et al., 2018). However, this method is also time-consuming and computationally expensive due to the processes required for sample preparation, operation, and data post-processing (Anusree and Latha, 2023; Bloom et al., 2010; Guida et al., 2020; Roslin et al., 2022). Moreover, μCT equipment is less accessible due to its high initial costs and setup requirements. Radiation safety is another concern with its use. Lastly, irrespective of whether the particles are scanned individually or collectively, the process of creating 3D digital representations of particles for shape analysis typically results in large computer files to preserve detail, sometimes exceeding hundreds of megabytes or even gigabytes per particle. For example, the 382 publicly available 3D particle files in the NSF DesignSafe-CI repository comprise 188 gigabytes, with an average of approximately 500 megabytes per file (Tripathi et al., 2023).
A 3D shape analysis is also costly due to the algorithmic complexities involved in quantifying a shape stemming from the intricacies of 3D analysis (Hu et al., 2023; Lee et al., 2005). Digitally captured 3D particle geometries have been modeled in various ways, including as sphere clumps (Zhao et al., 2021), polyhedrons (Chen et al., 2018; Huang and Tutumluer, 2014), and 3D spherical harmonic (SH) representations (Jia and Garboczi, 2016; Su and Yan, 2018a; Zhou et al., 2015), among others. These methods necessitate additional mathematical operations compared with their 2D counterparts, such as circle clumps, polygons, and 2D Fourier-based models. For a state-of-the-art review of these modeling strategies, please refer to the discussions by Augarde et al. (2021) and Zhao et al. (2023).
3. 2D shape analysis
3.1 2D shape descriptors
The history of 2D shape analysis based on projected particle images dates back nearly a century to pioneering work by Wentworth (1923), Cox (1927), Tickell (1931), Wadell (1932, 1935), and others. Tickell (1931) introduced a shape descriptor known as area circularity (ca), which compares two areas, as detailed in Eqn. (4). Wadell (1933) introduced a measure, then termed degree of circularity (cp), which is now commonly referred to as perimeter circularity (to distinguish it from various circularities introduced since then in the research community), which compares two perimeters, as shown in Eqn. (5). Wadell (1933, 1935) introduced another descriptor (cd), referred to as diameter circularity, which is defined based on two diameters, as shown in Eqn. (6). While cd is computed based on diameter, it requires calculating the area of the projected particle to determine the diameter of a circle with the same area. Therefore, the adoption of these methods was limited due to the need to manually determine the area and perimeter of the projected particle. Although these measurements could be performed using tools such as a planimeter or an opisometer, their widespread use was hindered by the time-consuming nature of the measurement process. Inspired by cd, Riley (1941) proposed the inscribed circle circularity (cc), as shown in Eqn. (7). Unlike ca, cp, or cd, the shape descriptor cc does not require measurement of the area or perimeter, eliminating the need for a planimeter or opisometer; thus, it has been favored in practice due to its simplicity of measurement and ability to deliver results similar to those of cd (Blott and Pye, 2007). Another traditional circularity is cwl in Eqn. (8), known as width-to-length ratio circularity, which quantifies a particle shape by comparing two principal dimensions. A schematic of the 2D shape analysis is shown in Fig. 7, where the raw projection image is binarized to capture the outline and geometric parameters are then applied to evaluate the circularity. It is worth noting that in the original publications, some of these metrics are referred to as sphericities, not circularities. However, to emphasize their 2D nature and avoid confusion with 3D sphericities, we refer to them as circularity in this review.
|
c
c
=
(
d
ci
/
d
cc
)
1
/
2 | (7) |
In Eqns. (4) to (8), the variables are defined as follows:
-
a is the projection area of a particle.
-
acc is the area of the smallest circle circumscribing a particle.
-
pc is the perimeter of a circle with the same area as the projected particle.
-
p is the perimeter of the projected particle.
-
dc is the diameter of a circle with the same area as the projected particle.
-
dcc is the diameter of the smallest circumscribing circle.
-
dci is the diameter of the largest inscribed circle.
-
d1 is the largest dimension of the particle.
-
d2 is the width of a particle, orthogonal to d1.

The cwl is evaluated based on two principal dimensions; thus, it can be perceived as a measure of 2D form. Pye and Pye (1943) analytically derived that cd is essentially the square root of cwl, indicating that cd is also a 2D form factor. They showed that dc can be expressed as the square root of the product of two principal dimensions of an ellipse with the same area, i.e., dc = (d′d″)1/2, where d′ > d″. Subsequently, by substituting a = π(dc/2)2 and acc = π(d′/2)2 into Eqn. (4), it becomes evident that ca essentially acts as a 2D form factor. Given the equivalence between cd and cc, as discussed by Riley (1941), cc can be considered a measure of the 2D form. Therefore, except for cp, the other circularities essentially serve as 2D form factors.
There are variations indicating circularity. For instance, many studies, including Bagheri et al. (2015), introduced Cox circularity (ccox) after Cox (1927). However, note that ccox is essentially the same as cp. The definition of ccox is provided in Eqn. (9), where a and p follow the definitions given in Eqns. (4) and (5). Given that a = π(dc/2)2, it follows that 4πa = pc2. Therefore, ccox is the square of cp. Kuo and Freeman (2000) also discussed this equivalency. Additionally, some articles introduced a different version of cc. Originally presented in the square root format as shown in Eqn. (7), the version without the square root is also used and is referred to as circle ratio sphericity (Zheng and Hryciw, 2015).
|
c
cox
=
4
π
a
/
p
2
=
c
p
2 | (9) |
The five circularities from Eqns. (4) to (8) are the most commonly used circularities in the granular materials research community for measuring 2D shapes (Mitchell and Soga, 2005; Zheng and Hryciw, 2015). An additional series of 2D shape descriptors has been developed in the research community, expanding on traditional descriptors. These include shape measures using radial segments (Sukumaran and Ashmawy, 2001), Fourier descriptors (Bowman et al., 2001; Chen et al., 2022; Su and Yan, 2018b; Wang et al., 2005), and fractal analysis (Bouzeboudja et al., 2022; Guida et al., 2020). A comprehensive review of broadly used 2D circularities and form factors is provided in other review papers, including those by Blott and Pye (2007) and Rodriguez et al. (2012).
3.2 Advances and challenges in 2D shape analysis
Modern digital imaging technology has enabled rapid analysis of shape and size based on 2D particle images (Hryciw et al., 2014). Early initiatives, such as those by Kwan et al. (1999), used digital particle image processing to analyze the shape characteristics of coarse aggregates. Notably, WipFrag, a commercial image-based particle geometry analyzer, has been available since the 1990s, primarily for size analysis (Maerz et al., 1996; WipWare, 2023). Subsequent developments include the Aggregate Image Measurement System (AIMS) (Chandan et al., 2004; Masad et al., 2005; Masad, 2005) and its successor, AIMS2 (Gates et al., 2011), which were specifically designed to characterize aggregate geometries. Bloom et al. (2010) employed an optical microscopic system consisting of a Nikon TS100 microscope and a Coolpix950 2-megapixel digital camera for 2D particle geometry characterization. With the advent of scanning electron microscopy (SEM) techniques, capturing the 2D shapes of fine particles has become more straightforward (Kodicherla, 2023).
Recently, dynamic image analysis (DIA) systems have gained popularity in the research community. These systems allow particles to fall through a vertical chute, where high-resolution, high-speed cameras optically capture them for further geometric analysis. Several commercial products such as QICPIC (Sympatec GmbH, 2022) have been used in research (Cavarretta et al., 2009; Krawczykowski et al., 2022; Li and Iskander, 2020; Zhou and Wang, 2017). Although this method provides rapid characterization, researchers have noted issues associated with its somewhat limited resolution. Cepuritis et al. (2017) highlighted the limitation of accurately characterizing particles smaller than approximately 40 μm due to the relatively large pixel size of the DIA system. Li and Iskander (2021) also noted similar resolution limitations in their discussion of 2D DIA measurements.
Attempts have also been made to estimate the 3D geometry of particle shapes from a single image by augmenting 2D imaging. Montenegro Ríos et al. (2013) employed a light source alongside a digital camera system to estimate the third dimension based on projected shadows. Additionally, Zheng and Hryciw (2017) introduced a stereophotography approach for estimating the third dimension of particles.
An advantage of 2D analysis includes its potential to conveniently analyze shapes from field photographs, such as those taken from stockpiles, making it useful for field inspections and on-site geometry quantification (Moaveni et al., 2013; Tutumluer et al., 2017). The process involves an image segmentation phase to identify individual particles in the photo, followed by 2D shape analysis to quantify the geometry. Various image segmentation algorithms and software are available, including the watershed segmentation algorithm (Vincent and Soille, 1991), which effectively isolates individual particles in an image. With recent advances in AI/ML techniques, image segmentation has become more convenient, as demonstrated by tools such as Meta AI’s Segment Anything (Meta, 2023). Fig. 8 shows an example in which different colors indicate the segmented particles. Nevertheless, perfecting this process for analyzing particle geometry in the field is ongoing, with limited success. Challenges such as inaccuracies caused by shadows and occlusion, where particles are partially obscured by nearer particles in the images, require further investigation in future. Consequently, 2D shape analysis is still predominantly conducted in a laboratory environment.

The major disadvantage of 2D shape analysis is its susceptibility to changes in viewpoint and sensitivity, resulting in analysis outcomes that depend on how a particle is projected (Alshibli et al., 2015; C.H. Lee et al., 2022; Li Lianghui et al., 2023; Zheng et al., 2021). This limitation can be addressed by capturing a sufficient number of 2D images for each particle and repeating this process for a large number of particles to achieve statistical significance (Cepuritis et al., 2017); however, this approach compromises the primary advantages of 2D analysis—speed, simplicity, and convenience. Given the uncertainties regarding the required number of 2D samples per particle, researchers have made different and often contradicting suggestions. Xie et al. (2020) suggested using three orthogonal projections, although they acknowledged the practical difficulties in field applications and therefore recommended using three maximum-area and three minimum-area projections as alternatives. Li Linzhu et al. (2023) employed Digital Image Analysis (DIA) with 8 to 12 projections per particle, but they argued that this number may not sufficiently capture the 3D geometry of particles. Zhao et al. (2021) reported that even 50 2D projection images may not faithfully represent 3D particle geometry. Attempts have also been made to optimize the number of particle projections required for effective and efficient 2D characterization (Křupka and Říha, 2015). In general, 2D shape analysis compromises accuracy and a comprehensive understanding of 3D particle geometry, in favor of speed and convenience.
4. Correlation between 3D and 2D shape measures
4.1 Approaches and challenges in estimating 3D shape from 2D images
There has been a growing interest within the research community in bridging the gap between 3D and 2D shape analyses due to their distinct strengths and limitations. This interest stems from the vision to leverage the speed and simplicity of 2D analysis while obtaining the accuracy of 3D analysis. Efforts to achieve this integration include the development of a 2D-to-3D conversion database via particle sampling. This process begins by conducting 3D imaging to digitally represent the 3D particle geometry, followed by creating a series of 2D projections to generate a set of 2D digital images. These images were then analyzed to develop a conversion database that could later be used to estimate 3D geometry from 2D images (Ueda, 2020; Ueda et al., 2019; Wang et al., 2019). However, opinions vary regarding the efficacy of this approach. Studies investigating this relationship have reported a range of conclusions, from limited effectiveness to highly promising results, indicating a complex and evolving understanding of the potential for integrating 2D and 3D shape analyses.
Many studies have concluded that using 2D shape parameters, obtained from projected particle images, to estimate 3D shape properties is inherently limited, as capturing the full complexity of a 3D shape by a 2D particle image, or even a set of 2D images, cannot adequately represent all dimensions (Alshibli et al., 2015; Bouzeboudja et al., 2022; Fonseca et al., 2012; Hu et al., 2023; Jia and Garboczi, 2016; C.H. Lee et al., 2022; Li Lianghui et al., 2023; Li Linzhu et al., 2023; Li and Iskander, 2021; Maroof et al., 2020; Su et al., 2019; Sun et al., 2014; Zheng et al., 2021). The 2D shape analysis captures only the planar geometry attributes of a particle, thereby missing critical information about its 3D geometry. Additionally, 2D descriptions are dependent on viewpoint, which can compromise the reliability of shape characterization.
Nevertheless, many other studies have demonstrated the significant potential of using 2D particle images to estimate 3D shapes, often reporting a strong correlation between 3D and 2D shape analysis results. This suggests that the relationship between 3D and 2D geometry measures could be leveraged in a 2D-to-3D approach, indicating a viable pathway for reasonably deriving 3D shape properties from 2D data (Cavarretta et al., 2009; Cepuritis et al., 2017; Han et al., 2023; Kaviani-Hamedani et al., 2024; Krawczykowski et al., 2022; Kutay et al., 2011; Lu et al., 2022; Masad et al., 2005; Ozturk and Rashidzade, 2020; Sandeep et al., 2023; Suh et al., 2017; Xie et al., 2020; Zhao et al., 2021; Zheng et al., 2019).
The granular materials research community has developed a diverse array of shape descriptors (Alshibli et al., 2015; Chandan et al., 2004; Fang et al., 2022; Hu et al., 2023; Kong and Fonseca, 2018; S.J. Lee et al., 2022; Su et al., 2020a; Sun et al., 2014; Xiao et al., 2020). The large number of currently available descriptors can be overwhelming and can even lead to confusion (Cavarretta et al., 2009; Maroof et al., 2020). As a result, the correlation between 3D and 2D shape measures, whether strong or weak, often hinges on the specific shape descriptors selected from the available array. For instance, Ozturk and Rashidzade (2020) noted a good correlation between 3D sphericity and 2D circularity measures they selected for their study. However, they found no significant correlation with the form factors, demonstrating that the effectiveness of using 2D data to estimate 3D shapes varies depending on the descriptor employed.
For a successful 2D-to-3D approach, the ‘mean’ value of 2D shape measures obtained from a set of 2D images should have a strong relationship with the 3D shape measure. For example, by capturing ten 2D projection images of a particle from various viewpoints and evaluating the 2D shape using a circularity descriptor, one should find that the mean value of these circularity measurements strongly correlates with the 3D shape measurement across all sample particles. This indicates a robust correlation between 2D circularity and 3D shape measure, fulfilling a necessary condition for the 2D-to-3D approach. At the same time, it is equally important that the 2D shape measures exhibit a low ‘variance’ and remain insensitive to changes in viewpoints. Even if 2D shape measures show a strong mean relationship with 3D measures, high variance caused by differing viewpoints requires capturing many 2D images to estimate a 3D shape accurately and reliably. Such requirement could limit the practicality and efficiency of the 2D-to-3D approach because the need for more images complicates the process and reduces its overall feasibility. For instance, Zheng et al. (2021) reported that the variation in the data obtained from random-projection tests was too substantial to reliably infer 3D particle shapes. This problem is inherently an ill-posed problem because the variance arises solely from 2D images despite the corresponding 3D descriptor exhibiting zero variance. Consequently, this variability has led some researchers to view the 2D-to-3D approach skeptically due to significant data scatter, despite the strong correlation between the mean values of 2D and 3D shape measures.
Therefore, to establish a reliable 2D-to-3D relationship for 3D shape estimation from a 2D particle image, or at most a couple of images, it is essential to identify a set of 2D and 3D shape descriptors that address both criteria regarding ‘mean’ and ‘variance’. Specifically: (i) when multiple 2D projection images are available, the mean value of the 2D shape measures should exhibit a strong relationship with the measures from the 3D shape descriptor, and (ii) the 2D shape measures must be minimally sensitive to variations in viewpoint to ensure consistent results, although determination of the satisfactory tolerance may depend on the cases. The achievement of a relatively low variance in 2D shape measures is critical for minimizing discrepancies in quantifying a shape, thereby enhancing the reliability of 3D shape estimation. If such a set of 2D and 3D shape descriptors can be identified, it will be possible to confidently use a smaller number of 2D particle images, ideally even a single random 2D image, for accurate 3D shape estimation.
4.2 Correlation between 3D true sphericity and 2D perimeter circularity
As discussed in Section 3.1, ca, cd, cc, and cwl function as 2D form factors. According to our comprehensive review, no meaningful correlation has been identified between these circularities and a 3D form factor. The 3D form is characterized using three principal dimensions to measure equidimensionality in three directions, whereas the 2D form relies on only two principal dimensions from the projected particle image. Thus, this inherent limitation restricts the accuracy of estimating 3D form from 2D form measurements.
On the other hand, a number of studies have observed a modest-to-good correlation between 2D perimeter circularity (cp) and 3D true sphericity (S), commonly showing that the mean values of cp correlate well with S (Cavarretta et al., 2009; Han et al., 2023; Rorato et al., 2019; Sandeep et al., 2023; Su and Yan, 2020; Xie et al., 2020; Zheng et al., 2019). For example, Sandeep et al. (2023) demonstrated that S was more closely related to cp than to other circularities. The higher correlation likely stems from the equivalence of their definitions across the different spatial dimensions. In 2D space, the projected area captures the object’s footprint, and the perimeter defines its boundary. In parallel, in 3D space, the volume captures the full extent of an object, and the surface area defines its boundary. Accordingly, the definition of cp, as presented in Eqn. (5) serves as the 2D counterpart of S in Eqn. (1). Wadell (1933) indeed introduced both 3D true sphericity (S) and 2D perimeter circularity (cp) using similar notations, implying that cp was developed as a 2D version of S (see pages 317 and 321 to compare the definitions in the article). Rorato et al. (2019) also noted that perimeter circularity is the 2D descriptor that best correlates with true sphericity, reflecting the equivalence of their definitions in 2D and 3D. Therefore, among the traditional circularities discussed in Section 3.1, cp is unique in that it serves as a 2D version of true sphericity.
If the mean of cp demonstrates good correlation with S, then it is essential to assess how sensitive cp is to random projections. A recent study by Lee et al. (2022) reported that cp showed the smallest variance compared with other classical 2D shape descriptors, indicating its relatively low sensitivity to how a particle is projected. This indicates that cp can be reliably used to estimate 3D shape from 2D images, highlighting its potential for robust 3D shape analysis based on random 2D projections. Bagheri et al. (2015) is another study that confirmed a strong correlation between the mean values of cp and S, while emphasizing that the standard deviation of cp data is notably low. (They analyzed ccox, which is the square of cp.) The study suggested that if cp is employed, the use of a minimum number of projection images—specifically two projections, including minimum and maximum projections, or three perpendicular projections—can achieve an optimal balance between efficiency and accuracy. This approach was found to limit the maximum error to less than 10 %, even when compared to scenarios utilizing up to 1000 projections, demonstrating that cp maintains a relatively invariant nature regardless of how a particle is projected. This consistency implies that a limited number of 2D projection images can effectively estimate a 3D shape using cp due to its low variance and strong correlation with S.
Wadell originally developed 2D circularities, cp and cd, to address the practical challenges associated with measuring 3D surface areas for quantifying particle shapes as defined by true sphericity S (Hayakawa and Oguchi, 2005; Howarth, 2017). With 3D imaging tools, it is now possible to evaluate 3D particle geometry in terms of S with high accuracy. These techniques present an opportunity to re-examine the correlation between 2D circularity and 3D sphericity, particularly between cp and S, given their definitional equivalency. Establishing a strong correlation between these shape measures will significantly enhance the accuracy of estimating 3D shape from random projection 2D particle images.
5. Demonstration
To further substantiate the findings from the literature review, a series of shape analyses is conducted to determine (i) whether there is a strong correlation between 3D true sphericity (S) and the mean of 2D perimeter circularity (cp), among others, and (ii) whether the variance of cp is minimal compared to those of other 2D shape measures, thereby making it a more reliable predictor of 3D shape from any 2D projection image.
5.1 3D and 2D shape analyses
This study analyzes an extensive dataset of 382 mineral particles sourced from Florida and Virginia. All particles from Florida in this dataset are limestone, while all particles from Virginia are freshly crushed granite sourced from a quarry in Richmond, Virginia. The Florida limestone (FL) particles are composed of three groups: FL-A, FL-B, and FL-C. The FL-A group consists of 100 limestone particles selected from a batch provided by the Florida Department of Transportation (FDOT) from District Four and Six regions in South Florida. The FL-B and FL-C groups, supplied by Titan America LLC, each comprises 50 particles sourced from the same limestone quarry and processed using different crushers. The Virginia granite (VG) particles, also provided by Titan America LLC, are composed of two groups: VG-A and VG-B. The VG-A group includes 100 randomly selected granite particles, while group VG-B consists of 82 particles containing crushed particles from the same granite batch. Therefore, the dataset comprises five distinct groups of 382 particles.
5.1.1 3D shape analysis procedure
Each particle is individually scanned to digitally represent the 3D geometry using a Polyga C504 structured light (SL) 3D scanner. This scanner is capable of scanning objects ranging from 5 to 30 mm in size with high resolution and accuracy, down to 6 microns (Polyga, 2021). The scanning setup is shown in Fig. 9. Each particle is placed on a small clump of putty to scan one side of its surface at a time (Fig. 9a). The particle is rotated while the 3D scanner, which is positioned directly above, captures its geometry from all corners to ensure comprehensive coverage (Fig. 9b). The particle is turned upside down, and scanning continues to ensure that all sides are captured thoroughly. Approximately 15 to 20 scans are performed per particle to complete the process. The scanned partial geometries are merged to create a 3D digital particle that realistically represents the original particle (Fig. 9c), for which the companion software FlexScan3D is employed. The 3D digital particle is created in the Wavefront .obj file format. The 3D particle geometry attributes, including surface area (A) and volume (V), are measured using the 3D print toolbox in Blender (2022), an open-source 3D computer graphics software. An advantage of SL scanning is that it performs 3D scanning at a 1-to-1 scale, which means that the captured 3D digital particle is the exact size of the original particle (Lansdown, 2019). As a result, the particle surface area and volume can be directly obtained from 3D digital particles without the need for re-scaling. These values are then used to compute the true sphericity (S) per Eqn. (1). Listing the 3D geometry information obtained for all 382 particles is extensive, but readers can directly refer to the dataset, which is publicly available in the NSF DesignSafe-CI data repository (Tripathi et al., 2023).

Ten 2D projection images are captured from random viewpoints for each particle using ParaView (Kitware Inc., 2022), as illustrated in the first row of Fig. 10. A custom Python script is developed to automate this random projection process in batch mode. Subsequently, each 2D image is converted into a binary format with the background in white and the foreground (particle) in black to capture the outline geometry, as depicted in the second row of Fig. 10. OpenCV (2023) is used for this binary conversion. This process generates 3820 2D projection images. These 2D binary images are then used to analyze the 2D shape in terms of five commonly used circularities, ca, cp, cd, cc, and cwl, as shown in Eqns. (4) to (8). The 2D analysis uses MATLAB code developed by Zheng and Hryciw (2016), originally developed as a companion code to their earlier work (Zheng and Hryciw, 2015). The circularity measure cc computed by this code differs from the original definition by Riley (1941) as per Eqn. (7). Therefore, the code is modified to align with Riley’s original formulation. The mean and standard deviation of the circularity measures are then computed for each particle.

The analysis results for the five particle groups, FL-A, FL-B, FL-C, VG-A, and VG-B, are presented in Figs. 11–15. Each data point in the figures represents the shape analysis result for a particle. Fig. 16 aggregates the data for all five particle groups. In the figures, the x-coordinate of the data point represents the mean (μ) of circularities evaluated from ten 2D projection images of each particle. These are assessed using five circularity measures: ca, cp, cd, cc, and cwl, as shown in the figures. In the first-row figures, the y-coordinate represents the evaluated true sphericity (S), comparing the mean circularity values with S. The blue line in the figure indicates the regression line for the data points, and the coefficient of determination (R2) indicates the data’s coherence with the regression line. In the second-row figures, the y-coordinate represents the standard deviation (σ) of circularities, evaluated from the ten 2D projection images of each particle. This comparison highlights how standard deviations relate to mean values.


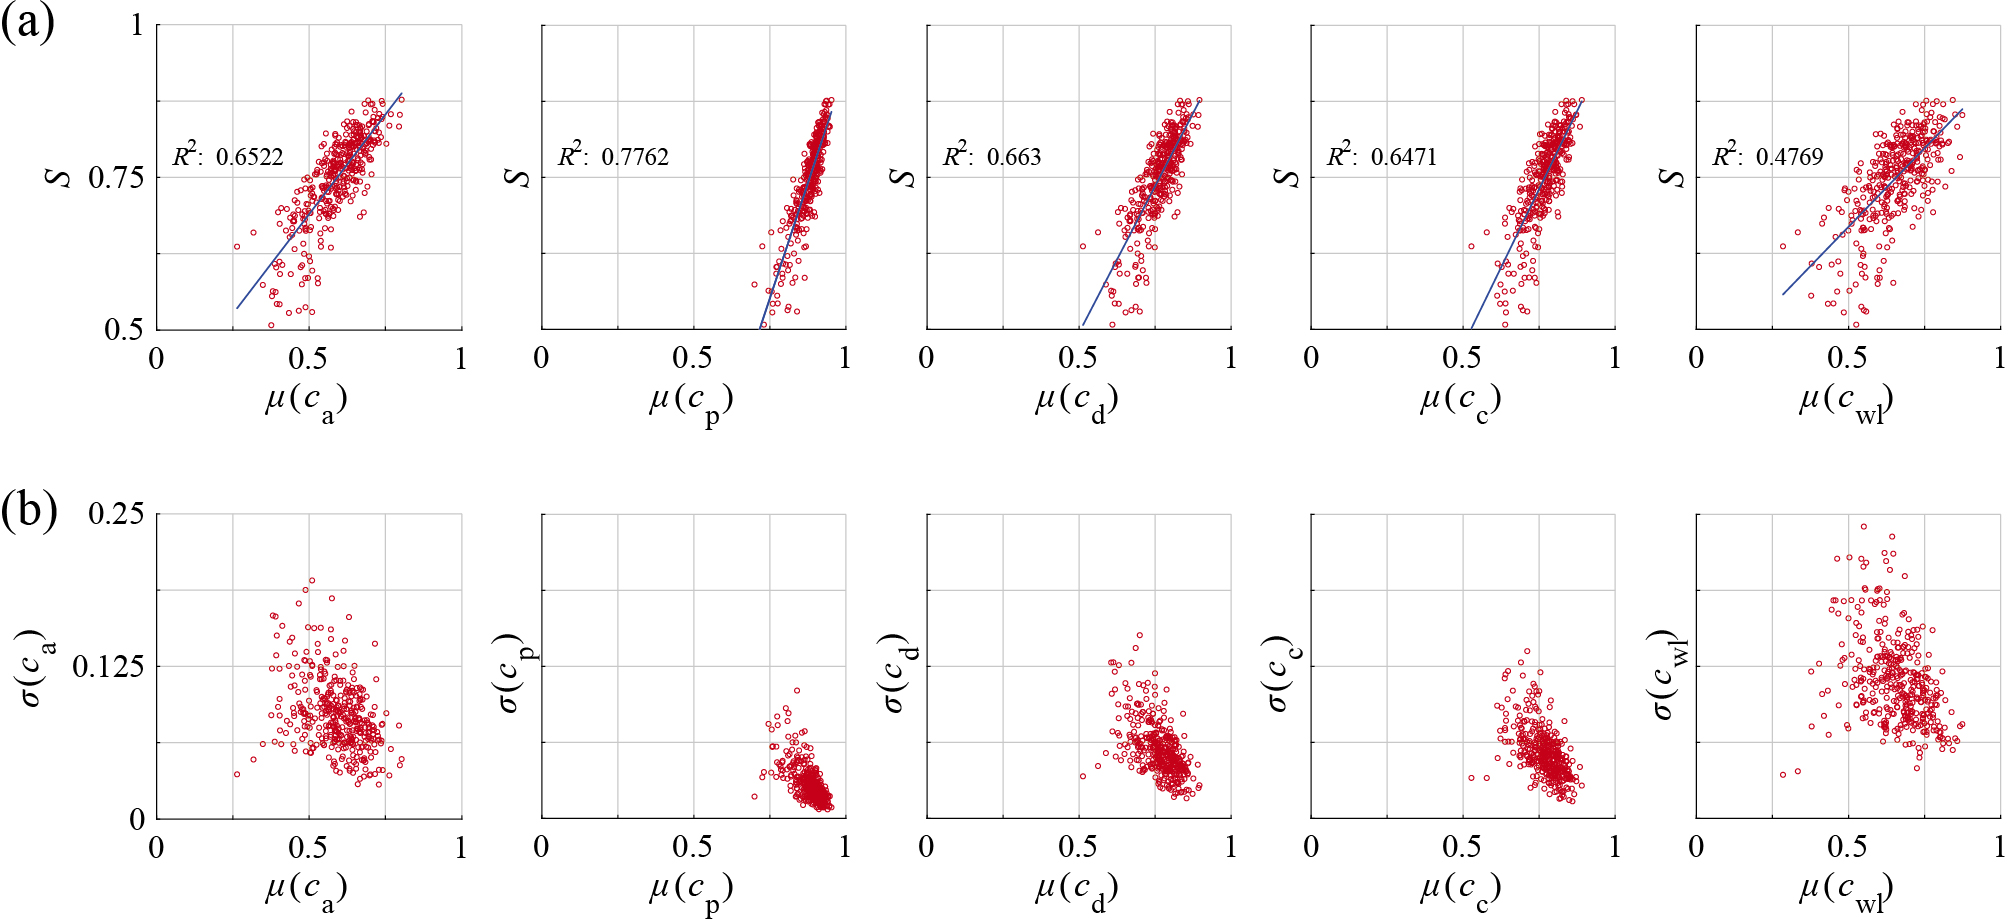
From all first-row figures in Figs. 11–16, it is apparent that the mean of cp values, μ(cp), demonstrates a relatively strong linear relationship with S, with the data points clustered coherently along the regression line. Compared with the other circularity measures, cp consistently exhibits the highest R2 value across all five particle groups. This indicates the reliability of using cp as a predictive measure, as evidenced by prior studies. Furthermore, from all second-row figures, it is evident that the distributed values of the standard deviation of cp, σ(cp), are significantly lower than those of other circularity measures. This indicates that a random 2D projection image yields a comparable cp value, demonstrating its insensitivity to viewpoint changes around a particle. However, the other circularities, ca, cd, cc, and cwl, do not exhibit a strong linear relationship with S as compared with cp, as indicated by the low R2 values and high data scatter. This lack of correlation may be explained by the fact that ca, cd, cc, and cwl function as 2D form factors, whereas cp acts as the 2D analog of true sphericity, supporting why cp correlates well with S. The standard deviations of ca, cd, cc, and cwl are also significantly higher than σ(cp), because these measures rely on two principal dimensions from the projected particle image, leading to high variability depending on the viewpoint.
In summary, the low σ(cp) indicates that a small number of 2D projection images can effectively estimate cp that closely approximates μ(cp) for each particle, thus eliminating the need to evaluate many 2D projection images to get μ(cp). The strong linear relationship between μ(cp) and S, accompanied by limited data scatter along the regression line, supports the feasibility of high-fidelity estimation of S from cp. For example, the regression line for FL-A in Fig. 11(a) can be expressed as S = 1.48 × μ(cp) − 0.56. Given the low σ(cp), this can be approximated as S ~ 1.48 × cp − 0.56. This approach provides a fast and reliable method for estimating a 3D shape in terms of S from the 2D perimeter circularity, cp, obtained from a 2D particle image.
6. Concluding remarks
Particle shape significantly influences the behavior and properties of granular materials, highlighting the importance of shape characterization. This characterization has been conducted through either 3D or 2D analysis, each offering distinct methodologies and associated trade-offs. Although 3D analysis provides greater accuracy by capturing the complete geometry of particles, it is more time-consuming and computationally expensive. In contrast, 2D analysis is simpler and faster, suitable for rapid assessment but less effective for providing a comprehensive understanding of 3D geometry. These distinct strengths and limitations have ignited interest within the granular materials research community to explore the correlation between 3D and 2D shapes, potentially enabling more efficient estimation of 3D shape from a 2D particle image or images. In response to this research interest, this paper comprehensively reviews previous studies to identify a set of 3D and 2D shape measures that best correlate with each other, aiming to bridge the gap between these two approaches.
Particle shapes are commonly characterized by large-scale properties such as form and true sphericity and local scale properties such as roundness and surface texture. This review focuses on larger scale shape properties, as they are more critical for understanding 3D shape characteristics. The literature review reveals a lack of meaningful correlation between 3D and 2D form factors, primarily because the 2D form is measured using only two principal dimensions from the projected particle image, while the 3D form is defined using aspect ratios based on three principal dimensions. This limitation restricts the accuracy of estimating 3D form from 2D random projection images. On the other hand, true sphericity measures how closely a particle’s shape approximates that of a perfect sphere. From the comprehensive literature review, this study finds that previous research has reported a good correlation between true sphericity (S) and perimeter circularity (cp). This correlation exists because cp acts as the 2D analog of S; true sphericity (S) is calculated based on the particle’s surface area, whereas cp is derived using a similar definition, employing the perimeter of the projected particle to mirror the role of surface area in S. Therefore, these definitions create a natural equivalence across the different spatial dimensions. Furthermore, S quantifies a comprehensive aspect of shape by measuring equidimensionality in all directions, unlike form measurements that are limited to only three directions. The 2D image retains geometric characteristics that facilitate partial evaluation of equidimensionality in all directions, which supports the strong correlation between true sphericity and perimeter circularity.
It is also worth noting that true sphericity (S) should be distinguished from other sphericity measures such as intercept sphericity (Ψ), even though S was originally proposed as a shape descriptor to measure sphericity. Conventional sphericity measures are often considered form factors because they can be calculated using the three principal dimensions, independent of local shape features such as roundness. However, true sphericity is influenced by both form and roundness because it evaluates a more comprehensive aspect of shape by measuring equidimensionality in all directions. This highlights the need to treat true sphericity as a distinct fourth aspect of shape. This differentiation extends to 2D circularities: commonly used circularities such as ca, cd, cc, and cwl function as 2D form factors because they can be defined using two principal dimensions from a projected particle image. In contrast, cp and ccox (essentially cp squared) serve as 2D analogs of true sphericity.
This study further validates the correlation between S and cp by analyzing approximately 400 mineral particles. A robust linear relationship is evident between the mean of cp values and S, which is characterized by high R2 values and limited data scatter. In addition, the standard deviations of cp are significantly lower than those of other circularities, indicating its insensitivity to viewpoint changes around a particle. This finding underscores the potential of using some 2D particle images to effectively and efficiently estimate 3D particle shape based on the 2D-to-3D relationship between cp and S. This approach combines the speed and simplicity of 2D analysis with the accuracy of 3D analysis. We encourage the granular materials research community to further investigate the implications of the findings presented in this paper.
Data Availability Statement
The complete dataset of the digital particles analyzed in this study is available in the NSF DesignSafe-CI repository (Tripathi et al., 2023) at the following link: https://doi.org/10.17603/ds2-p634-pg95. The dataset is available under the Open Data Commons Attribution License.
Acknowledgments
This work was supported in part by the US National Science Foundation (NSF) under the awards CMMI #1938431 and #1938285. The authors extend their appreciation to the Florida Department of Transportation (FDOT) District Four & Six Materials Office and Titan America LLC for providing the particles analyzed in this study. The authors greatly appreciate these supports. The authors extend their appreciation to the anonymous reviewers for their valuable comments, which enhanced the paper. The opinions, findings, conclusions, or recommendations expressed in this article are solely those of the authors and do not necessarily reflect the views of the sponsors.
Conflicts of Interest
The authors declare no conflicts of interest.
References
- Al-Raoush R., Microstructure characterization of granular materials, Physica A: Statistical Mechanics and its Applications, 377 (2007) 545–558. https://doi.org/10.1016/j.physa.2006.11.090
- Alshibli K.A., Druckrey A.M., Al-Raoush R.I., Weiskittel T., Lavrik N.V, Quantifying morphology of sands using 3D imaging, Journal of Materials in Civil Engineering, 27 (2015) 04014275. https://doi.org/10.1061/(ASCE)MT.1943-5533.0001246
- Anusree K., Latha G.M., Characterization of sand particle morphology: state-of-the-art, Bulletin of Engineering Geology and the Environment, 82 (2023) 269. https://doi.org/10.1007/s10064-023-03309-x
- Aschenbrenner B.C., A new method of expressing particle sphericity, Journal of Sedimentary Research, 26 (1956) 15–31. https://doi.org/10.1306/74D704A7-2B21-11D7-8648000102C1865D
- Augarde C.E., Lee S.J., Loukidis D., Numerical modelling of large deformation problems in geotechnical engineering: a state-of-the-art review, Soils and Foundations, 61 (2021) 1718–1735. https://doi.org/10.1016/j.sandf.2021.08.007
- Bagheri G.H., Bonadonna C., Manzella I., Vonlanthen P., On the characterization of size and shape of irregular particles, Powder Technology, 270 (2015) 141–153. https://doi.org/10.1016/j.powtec.2014.10.015
- Barrett P.J., The shape of rock particles, a critical review, Sedimentology, 27 (1980) 291–303. https://doi.org/10.1111/j.1365-3091.1980.tb01179.x
- Bésuelle P., Viggiani G., Lenoir N., Desrues J., Bornert M., X-ray micro CT for studying strain localization in clay rocks under triaxial compression, in: Jacques Desrues, Gioacchino Viggiani, Pierre Bésuelle (Eds.), Advances in X-ray Tomography for Geomaterials, Wiley, 2006, pp. 35–53. https://doi.org/10.1002/9780470612187.ch2
- Bhattacharya S., Subedi S., Lee S.J., Pradhananga N., Estimation of 3D sphericity by volume measurement – application to coarse aggregates, Transportation Geotechnics, 23 (2020) 100344. https://doi.org/10.1016/j.trgeo.2020.100344
- Blender, Blender Foundation, 2022 <https://www.blender.org/> accessed 25072024.
- Bloom M., Corriveau J., Giordano P., Lecakes G.D., Mandayam S., Sukumaran B., Imaging systems and algorithms for the numerical characterization of three-dimensional shapes of granular particles, IEEE Transactions on Instrumentation and Measurement, 59 (2010) 2365–2375. https://doi.org/10.1109/TIM.2009.2034579
- Blott S.J., Pye K., Particle shape: a review and new methods of characterization and classification, Sedimentology, 55 (2007) 31–63. https://doi.org/10.1111/j.1365-3091.2007.00892.x
- Bouzeboudja H., Melbouci B., Bouzeboudja A., Experimental study of crushed granular materials by the notion of fractal dimension in 2D and 3D, Geotechnical and Geological Engineering, 40 (2022) 2009–2031. https://doi.org/10.1007/s10706-021-02007-3
- Bowman E.T., Soga K., Drummond W., Particle shape characterisation using Fourier descriptor analysis, Géotechnique, 51 (2001) 545–554. https://doi.org/10.1680/geot.2001.51.6.545
- Cavarretta I., O’Sullivan C., Coop M.R., Applying 2D shape analysis techniques to granular materials with 3D particle geometries, in: AIP Conference Proceedings, AIP, 2009, pp. 833–836. https://doi.org/10.1063/1.3180057
- Cepuritis R., Garboczi E.J., Jacobsen S., Snyder K.A., Comparison of 2-D and 3-D shape analysis of concrete aggregate fines from VSI crushing, Powder Technology, 309 (2017) 110–125. https://doi.org/10.1016/j.powtec.2016.12.037
- Chandan C., Sivakumar K., Masad E., Fletcher T., Application of imaging techniques to geometry analysis of aggregate particles, Journal of Computing in Civil Engineering, 18 (2004) 75–82. https://doi.org/10.1061/(ASCE)0887-3801(2004)18:1(75)
- Chen J., Li R., Mo P.-Q., Zhou G., Cai S., Chen D., A modified method for morphology quantification and generation of 2D granular particles, Granular Matter, 24 (2022) 16. https://doi.org/10.1007/s10035-021-01149-8
- Chen J., Wang H., Dan H., Xie Y., Random modeling of three-dimensional heterogeneous microstructure of asphalt concrete for mechanical analysis, Journal of Engineering Mechanics, 144 (2018) 04018083. https://doi.org/10.1061/(ASCE)EM.1943-7889.0001505
- Cho G.-C., Dodds J., Santamarina J.C., Particle shape effects on packing density, stiffness, and strength: natural and crushed sands, Journal of Geotechnical and Geoenvironmental Engineering, 132 (2006) 591–602. https://doi.org/10.1061/(ASCE)1090-0241(2006)132:5(591)
- Cook C.S., Tanyu B.F., Yavuz A.B., Effect of particle shape on durability and performance of unbound aggregate base, Journal of Materials in Civil Engineering, 29 (2017) 04016221. https://doi.org/10.1061/(ASCE)MT.1943-5533.0001752
- Corey A.T., Influence of shape on the fall velocity of sand grains, master’s thesis, Colorado A & M College, 1949.
- Cox E.P., A method of assigning numerical and percentage values to the degree of roundness of sand grains, Journal of Paleontology, 1 (1927) 179–183. <https://www.jstor.org/stable/1298056> accessed 18 July 2024.
- DepositPhotos, Stone wall with randomtiled pattern, <https://depositphotos.com/photo>, 2014.
- Dobkins J.E., Folk R.L., Shape development on Tahiti-Nui, SEPM Journal of Sedimentary Research, 40 (1970) 1167–1203. https://doi.org/10.1306/74D72162-2B21-11D7-8648000102C1865D
- Druckrey A.M., Alshibli K.A., Al-Raoush R.I., 3D characterization of sand particle-to-particle contact and morphology, Computers and Geotechnics, 74 (2016) 26–35. https://doi.org/10.1016/j.compgeo.2015.12.014
- Erdogan S.T., Quiroga P.N., Fowler D.W., Saleh H.A., Livingston R.A., Garboczi E.J., Ketcham P.M., Hagedorn J.G., Satterfield S.G., Three-dimensional shape analysis of coarse aggregates: new techniques for and preliminary results on several different coarse aggregates and reference rocks, Cement and Concrete Research, 36 (2006) 1619–1627. https://doi.org/10.1016/j.cemconres.2006.04.003
- Fang H., Zhu H., Yang J., Huang X., Hu X., Three-dimensional angularity characterization of coarse aggregates based on experimental comparison of selected methods, Particulate Science and Technology, 40 (2022) 1–9. https://doi.org/10.1080/02726351.2021.1879979
- Fei W., Narsilio G.A., Disfani M.M., Impact of three-dimensional sphericity and roundness on heat transfer in granular materials, Powder Technology, 355 (2019) 770–781. https://doi.org/10.1016/j.powtec.2019.07.094
- Fonseca J., O’Sullivan C., Coop M.R., Lee P.D., Non-invasive characterization of particle morphology of natural sands, Soils and Foundations, 52 (2012) 712–722. https://doi.org/10.1016/j.sandf.2012.07.011
- Fu X., Elliott J.A., Bentham A.C., Hancock B.C., Cameron R.E., Application of X-ray microtomography and image processing to the investigation of a compacted granular system, Particle & Particle Systems Characterization, 23 (2006) 229–236. https://doi.org/10.1002/ppsc.200601054
- Gates L., Masad E., Pyle R., Bushee D., Aggregate image measurement system 2 (AIMS2): final report, 2011. <https://rosap.ntl.bts.gov/view/dot/54171> accessed 18072024.
- Guida G., Viggiani G.M.B., Casini F., Multi-scale morphological descriptors from the fractal analysis of particle contour, Acta Geotechnica, 15 (2020) 1067–1080. https://doi.org/10.1007/s11440-019-00772-3
- Han S., Wang C., Liu X., Li B., Gao R., Li S., A random algorithm for 3D modeling of solid particles considering elongation, flatness, sphericity, and convexity, Computational Particle Mechanics, 10 (2023) 19–44. https://doi.org/10.1007/s40571-022-00475-9
- Hanaor D.A.H., Gan Y., Revay M., Airey D.W., Einav I., 3D printable geomaterials, Géotechnique, 66 (2016) 323–332. https://doi.org/10.1680/jgeot.15.P.034
- Hayakawa Y., Oguchi T., Evaluation of gravel sphericity and roundness based on surface-area measurement with a laser scanner, Computers & Geosciences, 31 (2005) 735–741. https://doi.org/10.1016/j.cageo.2005.01.004
- Howarth R.J.W., in: Dictionary of Mathematical Geosciences, Springer International Publishing, Cham, 2017, pp. 653–665, ISBN:978-3-319-57314-4. https://doi.org/10.1007/978-3-319-57315-1_23
- Hryciw R.D., Zheng J., Ohm H.-S., Li J., Innovations in optical geocharacterization, in: Geo-Congress 2014 Keynote Lectures: Geo-Characterization and Modeling for Sustainability, 2014, pp. 97–116. https://doi.org/10.1061/9780784413289.005
- Hu Q., Gao R., Chen J., Yuan Z., Ballast deterioration inspection and quantification with 3D form method based on particle inscribed ellipsoid, Granular Matter, 25 (2023) 54. https://doi.org/10.1007/s10035-023-01348-5
- Huang H., Tutumluer E., Image-aided element shape generation method in discrete-element modeling for railroad ballast, Journal of Materials in Civil Engineering, 26 (2014) 527–535. https://doi.org/10.1061/(ASCE)MT.1943-5533.0000839
- Huang H., Tutumluer E., Luo J., Ding K., Qamhia I., Hart J., 3D image analysis using deep learning for size and shape characterization of stockpile riprap aggregates—phase 2, Rantoul, 2022. https://doi.org/10.36501/0197-9191/22-017
- Janke N.C., Effect of shape upon the settling vellocity of regular convex geometric particles, Journal of Sedimentary Research, 36 (1966) 370–376. https://doi.org/10.1306/74D714C4-2B21-11D7-8648000102C1865D
- Jerves A.X., Kawamoto R.Y., Andrade J.E., Effects of grain morphology on critical state: a computational analysis, Acta Geotechnica, 11 (2016) 493–503. https://doi.org/10.1007/s11440-015-0422-8
- Jia X., Garboczi E.J., Advances in shape measurement in the digital world, Particuology, 26 (2016) 19–31. https://doi.org/10.1016/j.partic.2015.12.005
- Kaviani-Hamedani F., Esmailzade M., Adineh K., Shafiei M., Shirkavand D., Quantifying three-dimensional sphericity indices of irregular fine particles from 2D images through sequential sieving tests, Granular Matter, 26 (2024) 13. https://doi.org/10.1007/s10035-023-01376-1
- Kitware Inc., Paraview, <https://www.paraview.org/>.
- Kodicherla S.P.K., Discrete element modelling of granular materials incorporating realistic particle shapes, International Journal of Geo-Engineering, 14 (2023) 15. https://doi.org/10.1186/s40703-023-00193-y
- Kong D., Fonseca J., Quantification of the morphology of shelly carbonate sands using 3D images, Géotechnique, 68 (2018) 249–261. https://doi.org/10.1680/jgeot.16.P.278
- Krawczykowski D., Krawczykowska A., Gawenda T., Comparison of geometric properties of regular and irregular mineral grains by dynamic image analysis (2D) and optoelectronic analysis (3D) methods, Minerals, 12 (2022) 540. https://doi.org/10.3390/min12050540
- Krumbein W.C., Measurement and geological significance of shape and roundness of sedimentary particles, Journal of Sedimentary Petrology, 11 (1941) 64–72.
- Křupka A., Říha K., Minimal prerequisites for measuring two-dimensional contour roundness in a particle classification context, Powder Technology, 284 (2015) 486–495. https://doi.org/10.1016/j.powtec.2015.07.018
- Kuo C.-Y., Freeman R.B., Imaging indices for quantification of shape, angularity, and surface texture of aggregates, Transportation Research Record: Journal of the Transportation Research Board, 1721 (2000) 57–65. https://doi.org/10.3141/1721-07
- Kuo C.-Y., Frost J.D., Lai J.S., Wang L.B., Three-dimensional image analysis of aggregate particles from orthogonal projections, Transportation Research Record: Journal of the Transportation Research Board, 1526 (1996) 98–103. https://doi.org/10.1177/0361198196152600112
- Kutay M.E., Arambula E., Gibson N., Youtcheff J., Three-dimensional image processing methods to identify and characterise aggregates in compacted asphalt mixtures, International Journal of Pavement Engineering, 11 (2010) 511–528. https://doi.org/10.1080/10298431003749725
- Kutay M.E., Ozturk H.I., Abbas A.R., Hu C., Comparison of 2D and 3D image-based aggregate morphological indices, International Journal of Pavement Engineering, 12 (2011) 421–431. https://doi.org/10.1080/10298436.2011.575137
- Kwan A.K., Mora C., Chan H., Particle shape analysis of coarse aggregate using digital image processing, Cement and Concrete Research, 29 (1999) 1403–1410. https://doi.org/10.1016/S0008-8846(99)00105-2
- Landauer J., Kuhn M., Nasato D.S., Foerst P., Briesen H., Particle shape matters – using 3D printed particles to investigate fundamental particle and packing properties, Powder Technology, 361 (2020) 711–718. https://doi.org/10.1016/j.powtec.2019.11.051
- Lansdown H., Digital Modelmaking: Laser Cutting, 3D Printing and Reverse Engineering, Crowood Press, 2019, ISBN: 9781785005862.
- Latham J.-P., Munjiza A., Garcia X., Xiang J., Guises R., Three-dimensional particle shape acquisition and use of shape library for DEM and FEM/DEM simulation, Minerals Engineering, 21 (2008) 797–805. https://doi.org/10.1016/j.mineng.2008.05.015
- Lee C., Suh H.S., Yoon B., Yun T.S., Particle shape effect on thermal conductivity and shear wave velocity in sands, Acta Geotechnica, (2017) 1–11. https://doi.org/10.1007/s11440-017-0524-6
- Lee C.H., Lee S.J., Shin M., Characterization of variability in 2-dimensional particle geometry via 3D structured light scanning, Transportation Geotechnics, 34 (2022) 100760. https://doi.org/10.1016/j.trgeo.2022.100760
- Lee J.R.J., Smith M.L., Smith L.N., Midha P.S., A mathematical morphology approach to image based 3D particle shape analysis, Machine Vision and Applications, 16 (2005) 282–288. https://doi.org/10.1007/s00138-005-0181-x
- Lee K.L., Seed H.B., Drained strength characteristics of sands, Journal of the Soil Mechanics and Foundations Division, 93 (1967) 117–141. https://doi.org/10.1061/JSFEAQ.0001048
- Lee S.J., Developments in large scale discrete element simulations with polyhedral particles, University of Illinois at Urbana-Champaign, Urbana, 2014. https://hdl.handle.net/2142/50542
- Lee S.J., Hashash Y.M.A., iDEM: An impulse-based discrete element method for fast granular dynamics, International Journal for Numerical Methods in Engineering, 104 (2015) 79–103. https://doi.org/10.1002/nme.4923
- Lee S.J., Hashash Y.M.A., Nezami E.G., Simulation of triaxial compression tests with polyhedral discrete elements, Computers and Geotechnics, 43 (2012) 92–100. https://doi.org/10.1016/j.compgeo.2012.02.011
- Lee S.J., Hashash Y.M.A., Wilkinson R.A., Agui J.H., Simulation of experimental tests on the JSC-1A lunar soil simulant with polyhedral discrete elements, in: Earth and Space 2010, American Society of Civil Engineers, Reston, VA, 2010, pp. 208–216. https://doi.org/10.1061/41096(366)22
- Lee S.J., Lee C.H., Shin M., Bhattacharya S., Su Y.F., Influence of coarse aggregate angularity on the mechanical performance of cement-based materials, Construction and Building Materials, 204 (2019) 184–192. https://doi.org/10.1016/j.conbuildmat.2019.01.135
- Lee S.J., Lee C.H., Shin M., Tripathi P., The “signature” of particle geometry - DEM modelling perspective, 7th edition of the International Conference on Particle-based Methods, (2021) 7. https://doi.org/10.23967/particles.2021.033
- Lee S.J., Shin M., Lee C.H., Tripathi P., Phenotypic trait of particle geometries, Granular Matter, 24 (2022) 79. https://doi.org/10.1007/s10035-022-01240-8
- Li L., Iskander M., Evaluation of dynamic image analysis for characterizing granular soils, Geotechnical Testing Journal, 43 (2020) 1149–1173. https://doi.org/10.1520/GTJ20190137
- Li L., Iskander M., Comparison of 2D and 3D dynamic image analysis for characterization of natural sands, Engineering Geology, 290 (2021) 106052. https://doi.org/10.1016/j.enggeo.2021.106052
- Li Linzhu, Sun Q., Iskander M., Efficacy of 3D dynamic image analysis for characterising the morphology of natural sands, Géotechnique, 73 (2023) 586–599. https://doi.org/10.1680/jgeot.21.00128
- Li Lianghui, Wang J., Yang S., Klein B., Wang Z., Liu F., Estimate of three-dimensional Wadell roundness of irregular particles using image processing and topographic analysis, Construction and Building Materials, 396 (2023) 132273. https://doi.org/10.1016/j.conbuildmat.2023.132273
- Li R., Lu W., Chen M., Wang G., Xia W., Yan P., Quantitative analysis of shapes and specific surface area of blasted fragments using image analysis and three-dimensional laser scanning, International Journal of Rock Mechanics and Mining Sciences, 141 (2021) 104710. https://doi.org/10.1016/j.ijrmms.2021.104710
- Lin C.L., Miller J.D., 3D characterization and analysis of particle shape using X-ray microtomography (XMT), Powder Technology, 154 (2005) 61–69. https://doi.org/10.1016/j.powtec.2005.04.031
- Lu R., Luo Q., Wang T., Zhao C., Comparison of clumps and rigid blocks in three-dimensional DEM simulations: curvature-based shape characterization, Computers and Geotechnics, 151 (2022) 104991. https://doi.org/10.1016/j.compgeo.2022.104991
- Maerz N.H., Palangio T.C., Franklin Ja, WipFrag image based granulometry system, in: In B. Mohanty (Ed.), 5th International Symposium on Rock Fragmentation by Blasting, Workshop on Measurement of Blast Fragmentation, 1996, pp. 91–99.
- Maroof M.A., Mahboubi A., Noorzad A., Safi Y., A new approach to particle shape classification of granular materials, Transportation Geotechnics, 22 (2020) 100296. https://doi.org/10.1016/j.trgeo.2019.100296
- Masad E., Saadeh S., Al-Rousan T., Garboczi E., Little D., Computations of particle surface characteristics using optical and X-ray CT images, Computational Materials Science, 34 (2005) 406–424. https://doi.org/10.1016/j.commatsci.2005.01.010
- Masad E.A., Aggregate imaging system (AIMS): basics and applications, National Technical Reports Library, PB2006107471, 2005. <https://static.tti.tamu.edu/tti.tamu.edu/documents/5-1707-01-1.pdf> accessed 2507024.
- McCormick N.J., Gee M.G., The measurement of the shape of abrasive particles with confocal optical microscopy, National Physical Laboratory Report, DEPC MPE 010, 2005. <https://eprintspublications.npl.co.uk/3162/1/DEPC_MPE10.pdf> accessed 2507024.
- Meta AI (Facebook Research), Segment Anything, 2023. <https://segment-anything.com/> accessed 2507024.
- Mitchell J.K., Soga K., Fundamentals of Soil Behavior, John Wiley & Sons, 3rd edition, 2005, ISBN: 978-0471463023.
- Moaveni M., Wang S., Hart J.M., Tutumluer E., Ahuja N., Evaluation of aggregate size and shape by means of segmentation techniques and aggregate image processing algorithms, Transportation Research Record: Journal of the Transportation Research Board, 2335 (2013) 50–59. https://doi.org/10.3141/2335-06
- Montenegro Ríos A., Sarocchi D., Nahmad-Molinari Y., Borselli L., Form from projected shadow (FFPS): an algorithm for 3D shape analysis of sedimentary particles, Computers & Geosciences, 60 (2013) 98–108. https://doi.org/10.1016/j.cageo.2013.07.008
- Riley N.A., Projection sphericity, Journal of Sedimentary Research, 11 (1941) 94–95. https://doi.org/10.1306/d426910c-2b26-11d7-8648000102c1865d
- Nie J.-Y., Li D.-Q., Cao Z.-J., Zhou B., Zhang A.-J., Probabilistic characterization and simulation of realistic particle shape based on sphere harmonic representation and Nataf transformation, Powder Technology, 360 (2020) 209–220. https://doi.org/10.1016/j.powtec.2019.10.007
- OpenCV, Open Source Computer Vision Library, 2023. <https://opencv.org/> accessed 25072024.
- Ozturk H.I., Rashidzade I., A photogrammetry based method for determination of 3D morphological indices of coarse aggregates, Construction and Building Materials, 262 (2020) 120794. https://doi.org/10.1016/j.conbuildmat.2020.120794
- Paixão A., Resende R., Fortunato E., Photogrammetry for digital reconstruction of railway ballast particles – A cost-efficient method, Construction and Building Materials, 191 (2018) 963–976. https://doi.org/10.1016/j.conbuildmat.2018.10.048
- Payan M., Senetakis K., Khoshghalb A., Khalili N., Effect of gradation and particle shape on small-strain Young’s modulus and Poisson’s ratio of sands, International Journal of Geomechanics, 17 (2016) 04016120. https://doi.org/10.1061/(ASCE)GM.1943-5622.0000811
- Petre R.-D., Zaharia T., Prêteux F., An overview of view-based 2D/3D indexing methods, in: Proceedings Volume 7799, Mathematics of Data/Image Coding, Compression, and Encryption with Applications XII, Society of Photo-Optical Instrumentation Engineers (SPIE), San Diego, CA, USA, 2010, p. 779904. https://doi.org/10.1117/12.861542
- Polyga, Polyga Compact C504, <polyga.com> 2021.
- Pye W.D., Pye M.H., Sphericity determinations of pebbles and sand grains, Journal of Sedimentary Research, 13 (1943) 28–34. https://doi.org/10.1306/D4269184-2B26-11D7-8648000102C1865D
- Qian Y., Lee S.J., Tutumluer E., Hashash Y.M.A., Mishra D., Ghaboussi J., Simulating ballast shear strength from large-scale triaxial tests, Transportation Research Record: Journal of the Transportation Research Board, 2374 (2013) 126–135. https://doi.org/10.3141/2374-15
- Rodriguez J., Johansson J., Edeskär T., Particle shape determination by two-dimensional image analysis in geotechnical engineering, in: Proceedings Of Nordic Conference On Soil Mechanics And Geotechnical NGM, Danish Geotechnical Society, Copenhagen, Denmark, 2012, pp. 207–218. <https://www.diva-portal.org/smash/get/diva2:1008311/FULLTEXT01.pdf> accessed 25072024.
- Rorato R., Arroyo M., Andò E., Gens A., Sphericity measures of sand grains, Engineering Geology, 254 (2019) 43–53. https://doi.org/10.1016/j.enggeo.2019.04.006
- Roslin A., Marsh M., Piché N., Provencher B., Mitchell T.R., Onederra I.A., Leonardi C.R., Processing of micro-CT images of granodiorite rock samples using convolutional neural networks (CNN), Part I: Super-resolution enhancement using a 3D CNN, Minerals Engineering, 188 (2022) 107748. https://doi.org/10.1016/j.mineng.2022.107748
- Rowe P.W., The stress-dilatancy relation for static equilibrium of an assembly of particles in contact, Proceedings of the Royal Society A: Mathematical, Physical and Engineering Sciences, 269 (1962) 500–527. https://doi.org/10.1098/rspa.1962.0193
- Sandeep C.S., Hernandez A., Stangeland K., Evans T.M., Shape characteristics of granular materials through realistic particle avatars, Computers and Geotechnics, 157 (2023) 105352. https://doi.org/10.1016/j.compgeo.2023.105352
- Shin H., Santamarina J.C., Role of particle angularity on the mechanical behavior of granular mixtures, Journal of Geotechnical and Geoenvironmental Engineering, 139 (2013) 353–355. https://doi.org/10.1061/(ASCE)GT.1943-5606.0000768
- Sneed E.D., Folk R.L., Pebbles in the lower Colorado River, Texas a study in particle morphogenesis, The Journal of Geology, 66 (1958) 114–150. https://doi.org/10.1086/626490
- Stark N., Hay A.E., Cheel R., Lake C.B., The impact of particle shape on the angle of internal friction and the implications for sediment dynamics at a steep, mixed sand–gravel beach, Earth Surface Dynamics, 2 (2014) 469–480. https://doi.org/10.5194/esurf-2-469-2014
- Su D., Wang X., Yang H.-W., Hong C., Roughness analysis of general-shape particles, from 2D closed outlines to 3D closed surfaces, Powder Technology, 356 (2019) 423–438. https://doi.org/10.1016/j.powtec.2019.08.042
- Su D., Yan W.M., 3D characterization of general-shape sand particles using microfocus X-ray computed tomography and spherical harmonic functions, and particle regeneration using multivariate random vector, Powder Technology, 323 (2018a) 8–23. https://doi.org/10.1016/j.powtec.2017.09.030
- Su D., Yan W.M., Quantification of angularity of general-shape particles by using Fourier series and a gradient-based approach, Construction and Building Materials, 161 (2018b) 547–554. https://doi.org/10.1016/j.conbuildmat.2017.12.004
- Su D., Yan W.M., Prediction of 3D size and shape descriptors of irregular granular particles from projected 2D images, Acta Geotechnica, 15 (2020) 1533–1555. https://doi.org/10.1007/s11440-019-00845-3
- Su Y.-F., Zhang B., Lee S.J., Sukumaran B., Parametric sensitivity study of particle shape effect through 3D printing, in: Li X., Feng Y., Mustoe G. (Eds.), DEM 2016: Proceedings of the 7th International Conference on Discrete Element Methods, Springer, 2017, pp. 593–600. https://doi.org/10.1007/978-981-10-1926-5_61
- Su Y.F., Bhattacharya S., Lee S.J., Lee C.H., Shin M., A new interpretation of three-dimensional particle geometry: M-A-V-L, Transportation Geotechnics, 23 (2020a) 100328. https://doi.org/10.1016/j.trgeo.2020.100328
- Su Y.F., Lee S.J., Sukumaran B., Influence of particle morphology simplification on the simulation of granular material behavior, Granular Matter, 22 (2020b) 19. https://doi.org/10.1007/s10035-019-0987-2
- Suh H.S., Kim K.Y., Lee J., Yun T.S., Quantification of bulk form and angularity of particle with correlation of shear strength and packing density in sands, Engineering Geology, 220 (2017) 256–265. https://doi.org/10.1016/j.enggeo.2017.02.015
- Sukumaran B., Ashmawy A.K., Quantitative characterisation of the geometry of discrete particles, Géotechnique, 51 (2001) 619–627. https://doi.org/10.1680/geot.2001.51.7.619
- Sun Y., Indraratna B., Nimbalkar S., Three-dimensional characterisation of particle size and shape for ballast, Géotechnique Letters, 4 (2014) 197–202. https://doi.org/10.1680/geolett.14.00036
- Sympatec GmbH, QICPIC.<https://www.sympatec.com/en/particle-measurement/sensors/dynamic-image-analysis/qicpic/> accessed 25072024.
- Terzaghi K., Peck R.B., Mesri G., Soil Mechanics in Engineering Practice, 3rd edition, Wiley, 1996, ISBN: 978-0471086581.
- Tickell F.G., The Examination of Fragmental Rocks, Stanford University Press, Stanford, CA, 1931.
- Tripathi P., Lee S.J., Shin M., Lee C.H., Replication data: 3D geometry characterization of Florida and Virginia mineral particles, US National Science Foundation (NSF) Designsafe-CI, (2023). https://doi.org/10.17603/Ds2-P634-Pg95
- Tripathi P., Lee S.J., Shin M., Lee C.H., A new paradigm integrating the concepts of particle abrasion and breakage, in: Geo-Congress 2024, American Society of Civil Engineers, Reston, VA, 2024, pp. 272–281. https://doi.org/10.1061/9780784485309.028
- Tunwal M., Lim A., A low-cost, repeatable method for 3D particle analysis with SfM photogrammetry, Geosciences, 13 (2023) 190. https://doi.org/10.3390/geosciences13070190
- Tutumluer E., Ahuja N., Hart J.M., Moaveni M., Huang H., Zhao Z., Shah S., Field evaluation of ballast fouling conditions using machine vision, Transportation Research Board, 2017. <https://www.trb.org/Main/Blurbs/176825.aspx> accessed 25072024.
- Tutumluer E., Hashash Y.M.A., Ghaboussi J., Qian Y., Lee S.J., Huang H., Discrete element modeling of railroad ballast behavior, Federal Railroad Administration, 2018. <https://railroads.dot.gov/elibrary/discrete-element-modeling-railroad-ballast-behavior> accessed.
- Ueda T., Experimental validation of a 2D–3D conversion method for estimation of multiple 3D characteristics of discrete elements, Microscopy, 69 (2020) 37–43. https://doi.org/10.1093/jmicro/dfz112
- Ueda T., Oki T., Koyanaka S., 2D–3D conversion method for assessment of multiple characteristics of particle shape and size, Powder Technology, 343 (2019) 287–295. https://doi.org/10.1016/j.powtec.2018.11.019
- Vincent L., Soille P., Watersheds in digital spaces: an efficient algorithm based on immersion simulations, IEEE Transactions on Pattern Analysis and Machine Intelligence, 13 (1991) 583–598. https://doi.org/10.1109/34.87344
- Vlahinić I., Andò E., Viggiani G., Andrade J.E., Towards a more accurate characterization of granular media: extracting quantitative descriptors from tomographic images, Granular Matter, 16 (2014) 9–21. https://doi.org/10.1007/s10035-013-0460-6
- Wadell H., Volume, shape, and roundness of rock particles, The Journal of Geology, 40 (1932) 443–451. https://doi.org/10.1086/623964
- Wadell H., Sphericity and roundness of rock particles, The Journal of Geology, 41 (1933) 310–331. https://doi.org/10.1086/624040
- Wadell H., Shape determinations of large sedimental rock fragments, Pan-American Geologist, 61 (1934) 187–220.
- Wadell H., Volume, shape, and roundness of quartz particles, The Journal of Geology, 43 (1935) 250–280. https://doi.org/10.1086/624298
- Wang L., Wang X., Mohammad L., Abadie C., Unified method to quantify aggregate shape angularity and texture using Fourier analysis, Journal of Materials in Civil Engineering, 17 (2005) 498–504. https://doi.org/10.1061/(ASCE)0899-1561(2005)17:5(498)
- Wang X., Tian K., Su D., Zhao J., Superellipsoid-based study on reproducing 3D particle geometry from 2D projections, Computers and Geotechnics, 114 (2019) 103131. https://doi.org/10.1016/j.compgeo.2019.103131
- Wang X., Zhang H., Yin Z.-Y., Su D., Liu Z., Deep-learning-enhanced model reconstruction of realistic 3D rock particles by intelligent video tracking of 2D random particle projections, Acta Geotechnica, 18 (2023) 1407–1430. https://doi.org/10.1007/s11440-022-01616-3
- Wei D., Zhao B., Gan Y., Surface reconstruction with spherical harmonics and its application for single particle crushing simulations, Journal of Rock Mechanics and Geotechnical Engineering, 14 (2022) 232–239. https://doi.org/10.1016/j.jrmge.2021.07.016
- Wei X., Deng Z., Li Q., Huang Y., Zhao G., A 3D grain-based reconstruction method from a 2D surface image for the Distinct Lattice Spring Model, International Journal for Numerical and Analytical Methods in Geomechanics, 47 (2023) 2027–2048. https://doi.org/10.1002/nag.3549
- Wentworth C.K., The shapes of beach pebbles, USGS Publications Warehouse, 1923. https://doi.org/10.3133/pp131C
- WipWare, WipFrag iOS with GIS capabilities, 2023. <https://wipware.com/> accessed 25072024.
- Wu J., Wang L., Hou Y., Xiong H., Lu Y., Zhang L., A digital image analysis of gravel aggregate using CT scanning technique, International Journal of Pavement Research and Technology, 11 (2018) 160–167. https://doi.org/10.1016/j.ijprt.2017.08.002
- Xiao J., Zhang X., Zhang D., Xue L., Sun S., Stránský J., Wang Y., Morphological reconstruction method of irregular shaped ballast particles and application in numerical simulation of ballasted track, Transportation Geotechnics, 24 (2020) 100374. https://doi.org/10.1016/j.trgeo.2020.100374
- Xie W.-Q., Zhang X.-P., Yang X.-M., Liu Q.-S., Tang S.-H., Tu X.-B., 3D size and shape characterization of natural sand particles using 2D image analysis, Engineering Geology, 279 (2020) 105915. https://doi.org/10.1016/j.enggeo.2020.105915
- Yang D., Tang J., Hu N., Xia Y., Yu Y., Huang Q., The shape parameters of coal and gangue particles derived from 3D scanning, Scientific Data, 10 (2023) 107. https://doi.org/10.1038/s41597-023-02019-z
- Yang X., Chen S., You Z., 3D voxel-based approach to quantify aggregate angularity and surface texture, Journal of Materials in Civil Engineering, 29 (2017). https://doi.org/10.1061/(ASCE)MT.1943-5533.0001872
- Yeong C.L.Y., Torquato S., Reconstructing random media. II. Three-dimensional media from two-dimensional cuts, Physical Review E, 58 (1998) 224–233. https://doi.org/10.1103/PhysRevE.58.224
- Zhang B., Lee S.J., Qian Y., Tutumluer E., Bhattacharya S., A smartphone-based image analysis technique for ballast aggregates, in: International Conference on Transportation and Development 2016, American Society of Civil Engineers, 2016, pp. 623–630. https://doi.org/10.1061/9780784479926.057
- Zhang S., Li R., Pei J., Evaluation methods and indexes of morphological characteristics of coarse aggregates for road materials: a comprehensive review, Journal of Traffic and Transportation Engineering (English Edition), 6 (2019) 256–272. https://doi.org/10.1016/j.jtte.2019.01.003
- Zhao B., Wang J., 3D quantitative shape analysis on form, roundness, and compactness with μCT, Powder Technology, 291 (2016) 262–275. https://doi.org/10.1016/j.powtec.2015.12.029
- Zhao J., Zhao S., Luding S., The role of particle shape in computational modelling of granular matter, Nature Reviews Physics, 5 (2023) 505–525. https://doi.org/10.1038/s42254-023-00617-9
- Zhao L., Zhang S., Deng M., Wang X., Statistical analysis and comparative study of multi-scale 2D and 3D shape features for unbound granular geomaterials, Transportation Geotechnics, 26 (2021) 100377. https://doi.org/10.1016/j.trgeo.2020.100377
- Zheng J., He H., Alimohammadi H., Three-dimensional Wadell roundness for particle angularity characterization of granular soils, Acta Geotechnica, 16 (2021) 133–149. https://doi.org/10.1007/s11440-020-01004-9
- Zheng J., Hryciw R.D., Traditional soil particle sphericity, roundness and surface roughness by computational geometry, Géotechnique, 65 (2015) 494–506. https://doi.org/10.1680/geot.14.P.192
- Zheng J., Hryciw R.D., Soil particle size and shape distributions by stereophotography and image analysis, Geotechnical Testing Journal, 40 (2017) 317–328. https://doi.org/10.1520/GTJ20160165
- Zheng J., Hryciw R.D., Particle Roundness and Sphericity Computation Code, 2016. <https://www.mathworks.com/matlabcentral/fileexchange/60651-particle-roundness-and-sphericitycomputation> accessed 25072024.
- Zheng W., Hu X., Tannant D.D., Zhang K., Xu C., Characterization of two- and three-dimensional morphological properties of fragmented sand grains, Engineering Geology, 263 (2019) 105358. https://doi.org/10.1016/j.enggeo.2019.105358
- Zhou B., Wang J., Generation of a realistic 3D sand assembly using X-ray micro-computed tomography and spherical harmonic-based principal component analysis, International Journal for Numerical and Analytical Methods in Geomechanics, 41 (2017) 93–109. https://doi.org/10.1002/nag.2548
- Zhou B., Wang J., Zhao B., Micromorphology characterization and reconstruction of sand particles using micro X-ray tomography and spherical harmonics, Engineering Geology, 184 (2015) 126–137. https://doi.org/10.1016/j.enggeo.2014.11.009
- Zhu F., Zhao J., Interplays between particle shape and particle breakage in confined continuous crushing of granular media, Powder Technology, 378 (2021) 455–467. https://doi.org/10.1016/j.powtec.2020.10.020
- Zingg T., Beitrag zur Schotteranalyse, Doctoral dissertation, ETH Zurich, 1935. https://doi.org/10.3929/ethz-a-000103455
- Zubić N., Liò P., An effective loss function for generating 3D models from single 2D image without rendering, in: Artificial Intelligence Applications and Innovations, 2021, pp. 309–322. https://doi.org/10.1007/978-3-030-79150-6_25
Authors’ Short Biographies

Priya Tripathi is currently pursuing a doctoral degree in Civil Engineering at Florida International University (FIU) in Miami, Florida, USA. She also completed her master’s degree at FIU after finishing her undergraduate studies in civil engineering at Mumbai University, India. Her research is focused on the characterization of 3D particle shapes and the development of a comprehensive framework for describing 3D particle geometry. Her work is particularly relevant in fields requiring precise particle shape analysis and has contributed significantly to advances in geotechnical and construction engineering.

Dr. Seung Jae Lee is an Associate Professor in the Department of Civil and Environmental Engineering at Florida International University, Miami, Florida, USA. His expertise lies in computational mechanics at the interfaces of geotechnical, structural, and computational engineering. His research focuses on understanding the fundamental mechanisms encoded at the micro- and grain-scales behind the complex macroscopic behaviors of discrete systems and materials. His contributions include expanding the length and time scale limits in discrete mechanical simulations by two orders of magnitude, and coining the new concept of ‘particle geometry space.’ This innovative approach enabled integrated characterization of particle shape, surface area, volume, specific surface, and size distribution within a single framework. He has received multiple awards from various research communities, including the ASCE Engineering Mechanics Institute.

Dr. Chang Hoon Lee is an Associate Professor in the Department of Civil and Environmental Engineering at Western New England University, Springfield, Massachusetts, USA. His research interests include developing multi-functional construction materials, sensor technology, and probabilistic modeling of physical-chemical property transitions. Furthermore, his current research integrates the chemistry of the corrosion process with mechanical damage across multiple length scales. He has been a member of the American Concrete Institute since 2016.

Dr. Moochul Shin is currently working as an Associate Professor in the Department of Civil and Environmental Engineering at Western New England University, Springfield, Massachusetts, USA. He has served as the institutional lead of the University of Transportation Center in the New England Region since 2018. His research interests are primarily in the structural applications of smart and innovative materials, advanced modeling, earthquake engineering, and prestressed concrete structures.
 https://ror.org/02gz6gg07


;%0A%09%09%09newWindow.document.open();%0A%09%09%09newWindow.document.write('<img src=%22./Graphics/42_2025017_17.jpg%22>');%0A%09%09%09newWindow.document.close();%0A%09%09)
;%0A%09%09%09newWindow.document.open();%0A%09%09%09newWindow.document.write('<img src=%22./Graphics/42_2025017_18.jpg%22>');%0A%09%09%09newWindow.document.close();%0A%09%09)
;%0A%09%09%09newWindow.document.open();%0A%09%09%09newWindow.document.write('<img src=%22./Graphics/42_2025017_19.jpg%22>');%0A%09%09%09newWindow.document.close();%0A%09%09)
;%0A%09%09%09newWindow.document.open();%0A%09%09%09newWindow.document.write('<img src=%22./Graphics/42_2025017_20.jpg%22>');%0A%09%09%09newWindow.document.close();%0A%09%09)